. 2022 Mar 14;12(1):4329.
doi: 10.1038/s41598-022-07890-1.

A hybrid machine learning/deep learning COVID-19 severity predictive model from CT images and clinical data

Affiliations

A hybrid machine learning/deep learning COVID-19 severity predictive model from CT images and clinical data

Matteo Chieregato et al. Sci Rep. .

Abstract

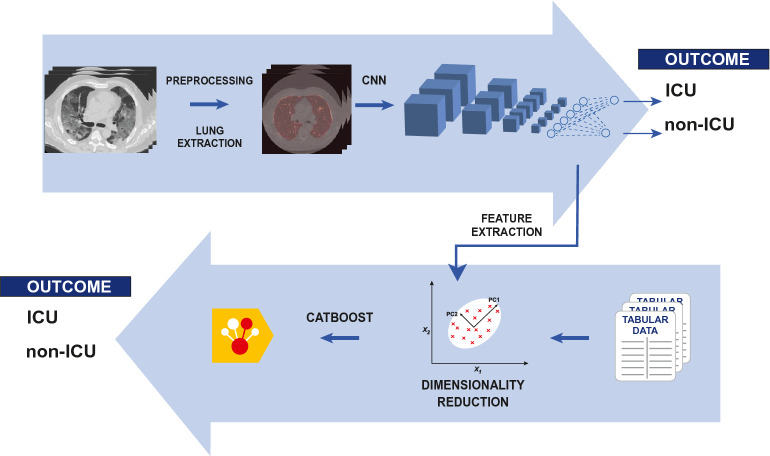
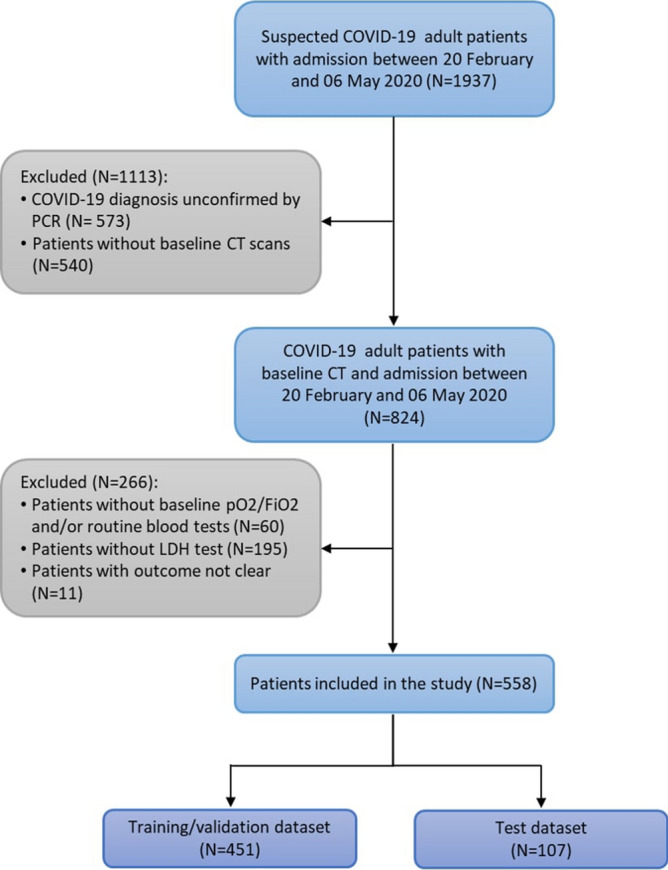
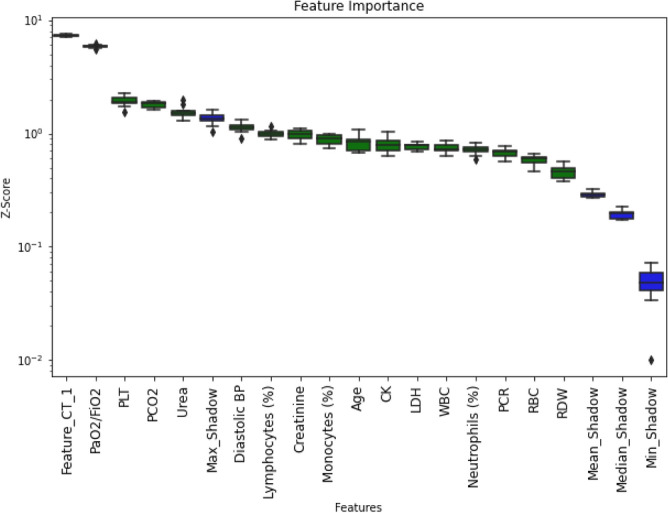
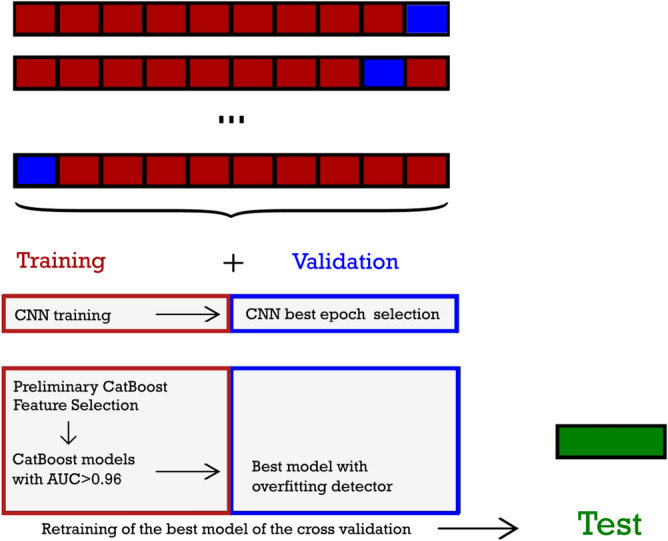
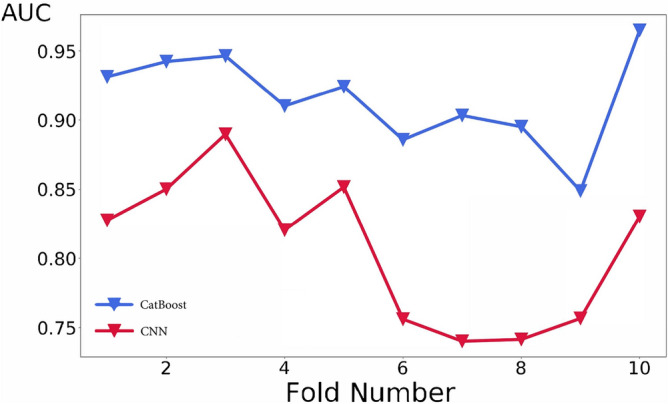
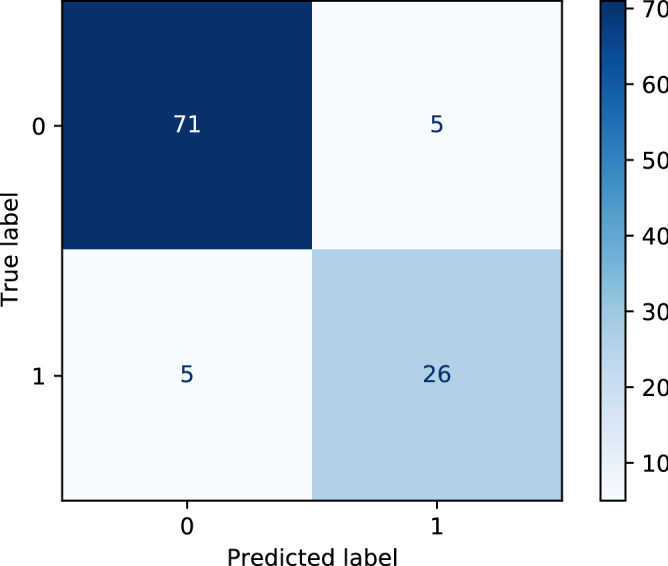
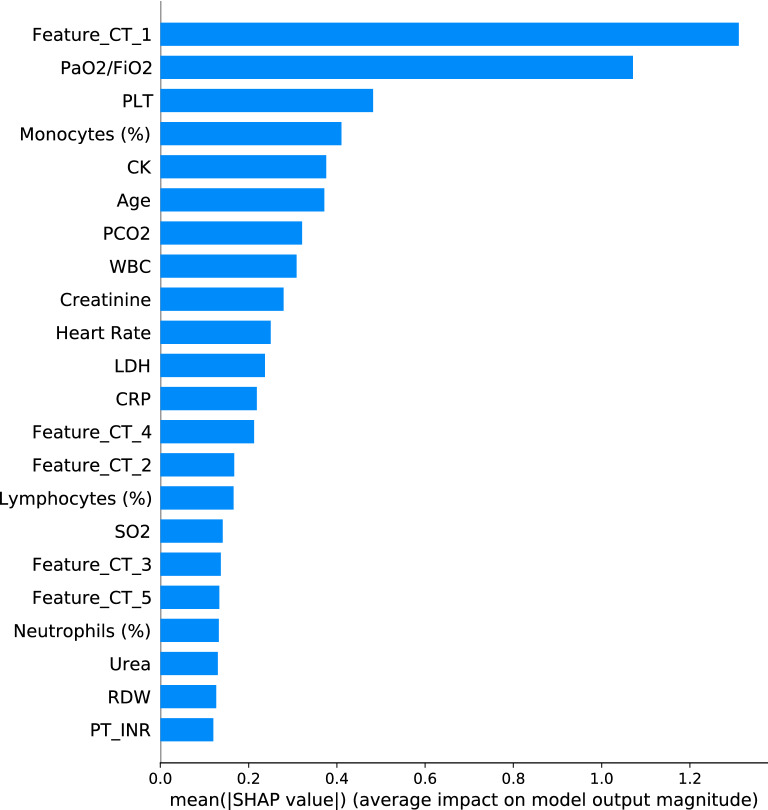
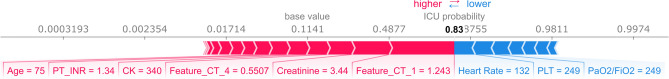
COVID-19 clinical presentation and prognosis are highly variable, ranging from asymptomatic and paucisymptomatic cases to acute respiratory distress syndrome and multi-organ involvement. We developed a hybrid machine learning/deep learning model to classify patients in two outcome categories, non-ICU and ICU (intensive care admission or death), using 558 patients admitted in a northern Italy hospital in February/May of 2020. A fully 3D patient-level CNN classifier on baseline CT images is used as feature extractor. Features extracted, alongside with laboratory and clinical data, are fed for selection in a Boruta algorithm with SHAP game theoretical values. A classifier is built on the reduced feature space using CatBoost gradient boosting algorithm and reaching a probabilistic AUC of 0.949 on holdout test set. The model aims to provide clinical decision support to medical doctors, with the probability score of belonging to an outcome class and with case-based SHAP interpretation of features importance.


Conflict of interest statement

The authors declare no competing interests.

Figures

Figure 1
Figure 1
A graphical representation of the proposed model.
Figure 2
Figure 2
Flowchart of patients inclusion/exclusion.
Figure 3
Figure 3
Distributions of Lactic Acid Dehydrogenase and PaO2/FiO2 for patients in Non-ICU (grey) and ICU (red) severity classes. Yellow area is normal value range. Mean and median values are also indicated. LDH is an effective inflammatory biomarker. PaO2/FiO2 is a biomarker of lung functionality.
Figure 4
Figure 4
A representation of the CNN architecture used. Actual model is volumetric, i.e. three spatial dimensions plus a channels dimension. Green arrows represent convolution operations with stride of 1. A ReLU nonlinear activation is applied after convolutions, and then a 2×2×2 max pooling in order to reduce spatial dimensions. Red arrow represents flattening. Blue arrows are full connections (with a 0.25 dropout), purple arrow stands for the final classifier with Log SoftMax and Cross Entropy loss function.
Figure 5
Figure 5
A representative BorutaSHAP importance plot. Green are features to keep in the model for this fold. Blue are maximum, mean, median and minimum shadow features.
Figure 6
Figure 6
A sketch of the cross validation procedure with feature selection. The dataset is split in test, used only for final evaluation, and training/validation, used for CNN training and evaluation, deep learned feature extraction, feature selection and hyperparameter tuning. Ten fold cross validation is applied in the training/validation set. CNN is trained on the training set (upper left red box), evaluated for hyperparameters on the validation set (upper right blue box). Extracted features are combined with non-imaging features, and selected in the training set, with a preliminary model (lower left red box: Preliminary CatBoost+Feature Selection). Bayesian optimization with Optuna is used for the preliminary model hyperparameters choice. Feature selection is effected with BorutaSHAP. CatBoost hyperparameters tuning on the selected feature set was effected in two steps, first with abayesian optimization in order to reduce the hyperparameter (lower left red box: CatBoost models with AUC>0.96) and then with overfitting detector (lower right blue box: best model in validation set). The best model of cross validation is retrained on the combined training/validation set, and evaluated on the test.
Figure 7
Figure 7
Cross validation of the CatBoost and CNN classifiers. A roughly common trend can be discerned, however the highest score is reached at different folds (3rd for the CNN and 10th for the CatBoost classifier).
Figure 8
Figure 8
Confusion matrix obtained with the best model on the test set (0 : non-ICU patients and 1: ICU patients).
Figure 9
Figure 9
Mean absolute value of the SHAP values for each feature in the test set.
Figure 10
Figure 10
Force plot of SHAP values for a single patient. Less important features are omitted for the sake of visualization. Features are represented as arrows that push the outcome (black small vertical line), either towards a ICU outcome (red arrows) or a non-ICU outcome (blue arrows). The black number over the small vertical line, 0.83, is the probability of the outcome for this patient. The length of the arrows is proportional to the SHAP values of the associated features for this particular prediction. Under each arrow it is reported the corresponding feature name and value. More details in the text.

References

    1. Struyf, T. et al. Signs and symptoms to determine if a patient presenting in primary care or hospital outpatient settings has COVID-19 disease. In Cochrane Database of Systematic Reviews (2020). - PMC - PubMed
    1. Gupta A, et al. Extrapulmonary manifestations of COVID-19. Nat. Med. 2020;26:1017–1032. - PMC - PubMed
    1. Li H, et al. SARS-CoV-2 and viral sepsis: Observations and hypotheses. Lancet. 2020;395:1517–1520. - PMC - PubMed
    1. Wiersinga WJ, Rhodes A, Cheng AC, Peacock SJ, Prescott HC. Pathophysiology, transmission, diagnosis, and treatment of coronavirus disease 2019 (COVID-19): A review. JAMA. 2020;324:782–793. - PubMed
    1. Tayarani-N M-H. Applications of artificial intelligence in battling against Covid-19: A literature review. Chaos Solitons Fractals. 2021;142:110338. - PMC - PubMed