. 2022 Mar 14;13(1):1300.
doi: 10.1038/s41467-022-28874-9.

Lysosomal Ca2+-mediated TFEB activation modulates mitophagy and functional adaptation of pancreatic β-cells to metabolic stress

Affiliations

Lysosomal Ca2+-mediated TFEB activation modulates mitophagy and functional adaptation of pancreatic β-cells to metabolic stress

Kihyoun Park et al. Nat Commun. .

Abstract

Although autophagy is critical for pancreatic β-cell function, the role and mechanism of mitophagy in β-cells are unclear. We studied the role of lysosomal Ca2+ in TFEB activation by mitochondrial or metabolic stress and that of TFEB-mediated mitophagy in β-cell function. Mitochondrial or metabolic stress induced mitophagy through lysosomal Ca2+ release, increased cytosolic Ca2+ and TFEB activation. Lysosomal Ca2+ replenishment by ER- > lysosome Ca2+ refilling was essential for mitophagy. β-cell-specific Tfeb knockout (TfebΔβ-cell) abrogated high-fat diet (HFD)-induced mitophagy, accompanied by increased ROS and reduced mitochondrial cytochrome c oxidase activity or O2 consumption. TfebΔβ-cell mice showed aggravation of HFD-induced glucose intolerance and impaired insulin release. Metabolic or mitochondrial stress induced TFEB-dependent expression of mitophagy receptors including Ndp52 and Optn, contributing to the increased mitophagy. These results suggest crucial roles of lysosomal Ca2+ release coupled with ER- > lysosome Ca2+ refilling and TFEB activation in mitophagy and maintenance of pancreatic β-cell function during metabolic stress.


Conflict of interest statement

M.-S.L. is the CEO of LysoTech, Inc. All authors declare no competing interests.

Figures

Fig. 1
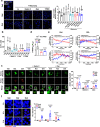
Fig. 1. Mitophagy after treating INS-1 cells with mitochondrial stressors.
a INS-1 cells transfected with pMito-Keima were treated with rotenone or O/A for 18 h. Keima fluorescence at neutral pH (green) and in acidic conditions (red) was determined, and the number of red puncta indicating mitophagy was counted (right). Representative fluorescence images are presented (left). (scale bar, 5 μm) (n = 9) (Veh, vehicle; Rot, rotenone; O/A, oligomycin + antimycin A) b INS-1 cells transfected with mRFP-LC3 were treated with rotenone or O/A for 24 h and then subjected to immunofluorescence using anti-TOM20 Ab to visualize the colocalization of an autophagic marker with a mitochondrial protein, i.e., mitophagy (right). Representative fluorescence images are presented (left). (scale bar, 5 μm) (n = 5) c INS-1 cells transfected with TFEB-GFP or TFE3-GFP were treated with rotenone or O/A for 4 h, and then cells with nuclear translocation of TFEB-GFP or TFE3-GFP were counted by confocal microscopy (right). Representative fluorescence images are presented (left). (scale bar, 20 μm) (n = 5 for TFEB-GFP; n = 3 for TFE3-GFP) d INS-1 cells were treated with rotenone or O/A for 4 h, and then cells with total or partial nuclear translocation of endogenous TFEB or TFE3 were counted after immunostaining with anti-TFEB or -TFE3 Ab (right). Representative fluorescence images are presented (left). (scale bar, 20 μm) (n = 4 for TFEB; n = 5 for TFE3) e Tfeb-KO and Tfe3-KO INS-1 cells generated by CRISPR/Cas9 technology were transfected with pMito-Keima, and then treated with rotenone or O/A for 18 h. Keima fluorescence at neutral pH and in acidic condition was determined by confocal microscopy (left). The number of red puncta indicating mitophagy was counted (right). (scale bar, 5 μm) (n = 7 for Tfeb KO + O/A; n = 9 for Tfeb KO; n = 10 for Tfeb KO + Rot; n = 15 for O/A or Tfe3 KO; n = 16 for Tfe3 KO + O/A; n = 18 for Tfe3 KO + Rot; n = 20 for Con or Rot) (Con, Cas9 control) Cells in the rectangles were magnified. All data in this figure are the means ± SEM from more than 3 independent experiments. P values were determined using one-way ANOVA with Tukey’s test. *, compared to Veh-treated cells; †, compared to Rot-treated Con cells; ‡, compared to O/A-treated Con cells.
Fig. 2
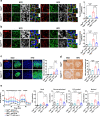
Fig. 2. Role of Ca2+ and calcineurin in mitophagy.
a Tfeb-GFP-transfectants were transfected with pcDNA 3.1-HA or -HA-ΔCnA-H151Q. After rotenone or O/A treatment for 4 h, cells were subjected to immunofluorescence with anti-HA Ab. (scale bar, 20 μm) (white arrow, HA-ΔCnA-H151Q-transfected cells showing no TFEB translocation by rotenone or O/A; yellow arrow, untransfected cells showing TFEB translocation by rotenone or O/A; magenta arrow, control-transfected cells showing TFEB translocation by rotenone or O/A). b The percentage of cells showing nuclear TFEB in cells of (a). (scale bar, 20 μm) (n = 8 for HA + Rot or HA + O/A; n = 9 for HA + Veh; n = 19 for HA-∆CnA-H151Q + Rot; n = 20 for HA-∆CnA-H151Q + O/A; n = 21 for HA-∆CnA-H151Q + Veh) c mRFP-LC3-transfectants were transfected with pcDNA 3.1-HA or -HA-ΔCnA-H151Q. After rotenone or O/A treatment for 24 h, cells were subjected to immunofluorescence with anti-TOM20 and -HA Abs. (scale bar, 10 μm) d The number mRFP-LC3 puncta colocalized with TOM20 in cells of (c). (n = 7 for HA + Veh, HA + Rot, HA-∆CnA-H151Q + Rot or HA-∆CnA-H151Q + O/A; n = 8 for HA-∆CnA-H151Q + Veh; n = 9 for HA + O/A) e During GPN treatment of GCaMP3-ML1-transfected cells with or without rotenone or O/A pretreatment, perilysosomal fluorescence was traced (right upper). Peak fluorescence (right lower). Representative fluorescence images (left). (scale bar, 20 μm) (n = 5) f After mitochondrial stressor treatment for 4 h, [Ca2+]Lys was determined by Oregon Green 488 BAPTA-1 Dextran loading. Fluorescence intensity (right). Representative fluorescence images (left). (scale bar, 20 μm) (n = 7) g During GPN treatment of Fura-2-loaded cells with or without rotenone or O/A pretreatment, 340/380 nm fluorescence ratio was monitored (left). Lysosomal Ca2+ reservoir estimated by calculating AUC of the curve (right). (n = 14) h After treatment with mitochondrial stressors for 1 h, [Ca2+]i was determined using Fura-2. (n = 10) i After mitochondrial stressor treatment for 4 h in the presence or absence of BAPTA-AM, TFEB-GFP nuclear translocation was determined (right). Representative fluorescence images (left). (scale bar, 20 μm) (n = 5) Cells in the rectangles were magnified. All data in this figure are the means ± SEM from more than 3 independent experiments. P values were determined using one-way ANOVA with Tukey’s test. *, compared to Veh-treated cells; †, compared to INS-1 cells or HA transfectants treated with Rot alone; ‡, compared to INS-1 cells or HA transfectants treated with O/A alone.
Fig. 3
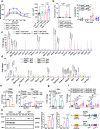
Fig. 3. ER → lysosome Ca2+ refilling during mitophagy.
a Oregon Green 488 BAPTA-1 Dextran-labeled INS-1 cells were treated with mitochondrial stressors for 1 h. After removal of stressors for 1 h, recovery of [Ca2+]Lys was determined with and without Xesto C, Dan or TPEN pretreatment (right). Representative fluorescence images are presented (left). (Xesto C, Xesto-spongin C; Dan, Dantrolene) (scale bar, 20 μm) (n = 7 for O/A + Recovery + Xesto C; n = 11 for Veh or Rot + Recovery + TPEN; n = 12 for Rot, O/A or O/A + Recovery; n = 13 for O/A + Recovery + Dan or O/A + Recovery + TPEN; n = 14 for Rot + Recovery + Dan; n = 15 for Rot + Recovery or Rot + Recovery + Xesto C) b [Ca2+]i was determined in cells treated with mitochondrial stressors for 1 h with or without Xesto C, Dan or TPEN pretreatment using Fura-2. (n = 8) c pMito-Keima-transfected cells were treated with rotenone or O/A for 18 h with and without Xesto C or Dan pretreatment, and the number of red acidic puncta in cells was determined (right). Representative fluorescence images are presented (left). (scale bar, 5 μm) (n = 6 for Xesto C + O/A; n = 7 for Xesto C + Rot; n = 8 for Dan + Rot or Dan + O/A; n = 9 for Veh, O/A, Xesto C or Dan; n = 10 for Rot) d [Ca2+]ER was determined after treating D1ER-transfected cells with mitochondrial stressors for 1 h in the absence of extracellular Ca2+. (n = 6) e Cells transfected with GEM-CEPIA1er and labeled with Oregon Green 488 BAPTA-1 Dextran were treated with mitochondrial stressors for 1 h. After removal of stressors, the recovery of [Ca2+]Lys and changes in [Ca2+]ER were determined simultaneously in the absence of extracellular Ca2+. f Cells were treated with rotenone or O/A, and contact between ER and lysosome was studied by PLA using Abs to VAPA on ER and to ORP1L on lysosome (right). Representative fluorescence images are presented (left). Values on the y-axis represent the numbers of PLA dots in the left panel after treatment with Rot (red bar) or O/A (blue bar). (scale bar, 10 μm) (n = 10) Cells in the rectangles were magnified. All data in this figure are the means ± SEM from more than 3 independent experiments. P values were determined using one-way ANOVA with Tukey’s test. *, compared to Veh-treated cells; †, compared to cells treated with Rot alone; ‡, compared to cells treated with O/A alone; §, compared to Rot-treated cells after recovery; ¶, compared to O/A-treated cells after recovery.
Fig. 4
Fig. 4. Effect of PA on mitochondria and mitophagy.
a After treating INS-1 cells with PA for 2-24 h, mitochondrial ROS was determined using MitoSOX (right). Representative flow cytometric scattergrams are presented (left). (n = 4) b After treating cells with PA for 1 h, [Ca2+]Lys was determined by Oregon Green 488 BAPTA-1 Dextran loading (right). Representative fluorescence images are presented (left). (scale bar, 20 μm) (n = 9) c After treating cells with PA for 1 h, [Ca2+]i was determined using Fura-2 (n = 10) d After treating Tfeb-GFP-transfected cells with PA for 4-16 h, nuclear TFEB was examined by confocal microscopy (right). Representative fluorescence images are presented (left). (scale bar, 20 μm) (n = 10 for 16 h; n = 11 for Veh; n = 12 for 4 h or 6 h) e After treating pMito-Keima-transfected cells with PA for 18 h, the number of red acidic puncta in transfected cells was determined (right). Representative fluorescence images are presented (left). (scale bar, 5 μm) (n = 7) f After PA treatment for 4 h with or without ROS quencher pretreatment for 1 h, nuclear TFEB was examined as in (d) (lower). Representative fluorescence images are presented (upper). (scale bar, 20 μm) (n = 6 for MitoTEMPO; n = 7 for NAC; n = 11 for Veh, PA, NAC + PA or MitoTEMPO+PA) Cells in the rectangles were magnified. All data in this figure are the means ± SEM from more than 3 independent experiments. P values were determined using one-way ANOVA with Tukey’s test (a, d, f) or two-tailed t test (b, c, e). *, compared to Veh-treated cells; †, compared to cells treated with PA alone.
Fig. 5
Fig. 5. Effect of in vivo Tfeb KO on mitophagy in β-cells.
a Colocalization of LC3 puncta with TOM20, a mitochondrial marker, in pancreatic islets of Tfeb∆β-cell and TfebF/F mice fed NCD or HFD for 12 weeks estimated by Pearson’s correlation analysis (right). Representative fluorescence images are presented (left). (scale bar, 10 μm) (n = 6) b Colocalization of LAMP2 spot, a lysosomal marker, with TOM20 in pancreatic islets of Tfeb∆β-cell and TfebF/F mice fed NCD or HFD for 12 weeks estimated by Pearson’s correlation analysis (right). Representative fluorescence images are presented (left). (scale bar, 10 μm) (n = 6) c ROS accumulation determined by HNE staining of pancreatic sections from Tfeb∆β-cell and TfebF/F mice fed NCF or HFD for 12 weeks (right). Representative fluorescence images are presented (left). (scale bar, 50 μm) (n = 7 for Tfeb∆β-cell:HFD; n = 8 for Tfeb∆β-cell:NCD; n = 11 for TfebF/F:NCD; n = 14 for TfebF/F:HFD) d Mitochondrial COX activity in pancreatic islets of Tfeb∆β-cell and TfebF/F mice fed NCD or HFD for 12 weeks (right). Representative DAB images are presented (left). (scale bar, 100 μm) (n = 6) e Seahorse XF respirometry using primary pancreatic islets from Tfeb∆β-cell and TfebF/F mice on NCD or HFD for 12 weeks (left). Basal, glucose-stimulated, ATP-coupled and maximal O2 consumptions were calculated from the curves (right). (OCR, O2 consumption rate; FCCP, carbonyl cyanide-4-[trifluoromethoxy]phenylhydrazone; Rot, rotenone; AA, antimycin A) Cells in the rectangles were magnified. All data in this figure are the means ± SEM from more than 3 independent experiments. P values were determined using one-way ANOVA with Tukey’s test; ns, not significant.
Fig. 6
Fig. 6. Effect of β-cell-specific Tfeb KO on metabolic profile and target gene expression.
a GTT in Tfeb∆β-cell and TfebF/F mice on NCD or HFD for 12 weeks (left). AUC (right). b Insulinogenic index in Tfeb∆β-cell and TfebF/F mice on NCD or HFD for 12 weeks (left). Serum insulin levels before and 15 min after glucose injection (right). c mRNA from pancreatic islets of Tfeb∆β-cell and TfebF/F mice fed NCD or HFD for 12 weeks was subjected to real-time RT-PCR. d Pancreatic islets from NCD-fed Tfeb∆β-cell and TfebF/F mice were treated with mitochondrial stressors for 6 h. mRNA from the treated islets was subjected to real-time RT-PCR. (n = 8) e Expression of TFEB mRNA in 1.1B4 cells transfected with TFEB siRNA examined by real-time RT-PCR. (n = 6) f After treating TFEB siRNA-transfected 1.1B4 cells with mitochondrial stressors for 6 h, expression of the indicated genes was examined by real-time RT-PCR. (n = 6) (SiCon, control siRNA) g Forty-eight h after transfection of 1.1B4 cells with control GFP or TFEB-GFP, expression of the indicated genes was examined by real-time RT-PCR. (n = 4) h After treatment of 1.1B4 cells with mitochondrial stressors, ChIP assay was conducted. Fold changes (middle). Representative immunoblots (left). (n = 4) Positions of putative TFEB-binding CLEAR sequence in the promoter regions of NDP52 and OPTN (right). i Pancreatic islets from Nfe2l2-KO and control mice were treated with mitochondrial stressors for 6 h. Expression of Ndp52 and Optn evaluated by real-time RT-PCR mRNA. (n = 10 for Nfe2l2 WT; n = 12 for Nfe2l2 KO) All data in this figure are the means ± SEM from more than 3 independent experiments. P values were determined using o one-way ANOVA with Tukey’s test (ad, f, h, i), two-way ANOVA with Bonferroni’s test (a) or two-tailed t test (e, g). ns, not significant; *, compared to (wild-type) cells or control transfectants treated with Veh; †, compared to wild-type cells or control transfectants treated with Rot alone; ‡, compared to wild-type cells or control transfectants treated with O/A alone.

Similar articles

Cited by

References

    1. Miki T, et al. Defective insulin secretion and enhanced insulin action in KATP channel-deficient mice. Proc. Natl Acad. Sci. USA. 1998;95:10402–10406. - PMC - PubMed
    1. Jung HS, et al. Loss of autophagy diminishes pancreatic b-cell mass and function with resultant hyperglycemia. Cell Metab. 2008;8:318–324. - PubMed
    1. Settembre C, et al. TFEB links autophagy to lysosomal biogenesis. Science. 2011;332:1429–1433. - PMC - PubMed
    1. Nezich CL, Wang C, Fogel A, Youle RJ. MiT/TFE transcription factors are activated during mitophagy downstream of Parkin and Atg5. J. Cell Biol. 2015;210:435–450. - PMC - PubMed
    1. Zhang X, et al. MCOLN1 is a ROS sensor in lysosomes that regulates autophagy. Nat. Commun. 2016;7:12109. - PMC - PubMed

Publication types

MeSH terms

Substances

LinkOut - more resources