

Intra- and inter-spatial variability of meiofauna in hadal trenches is linked to microbial activity and food availability
- PMID: 35288586
- PMCID: PMC8921185
- DOI: 10.1038/s41598-022-08088-1
Intra- and inter-spatial variability of meiofauna in hadal trenches is linked to microbial activity and food availability
Abstract
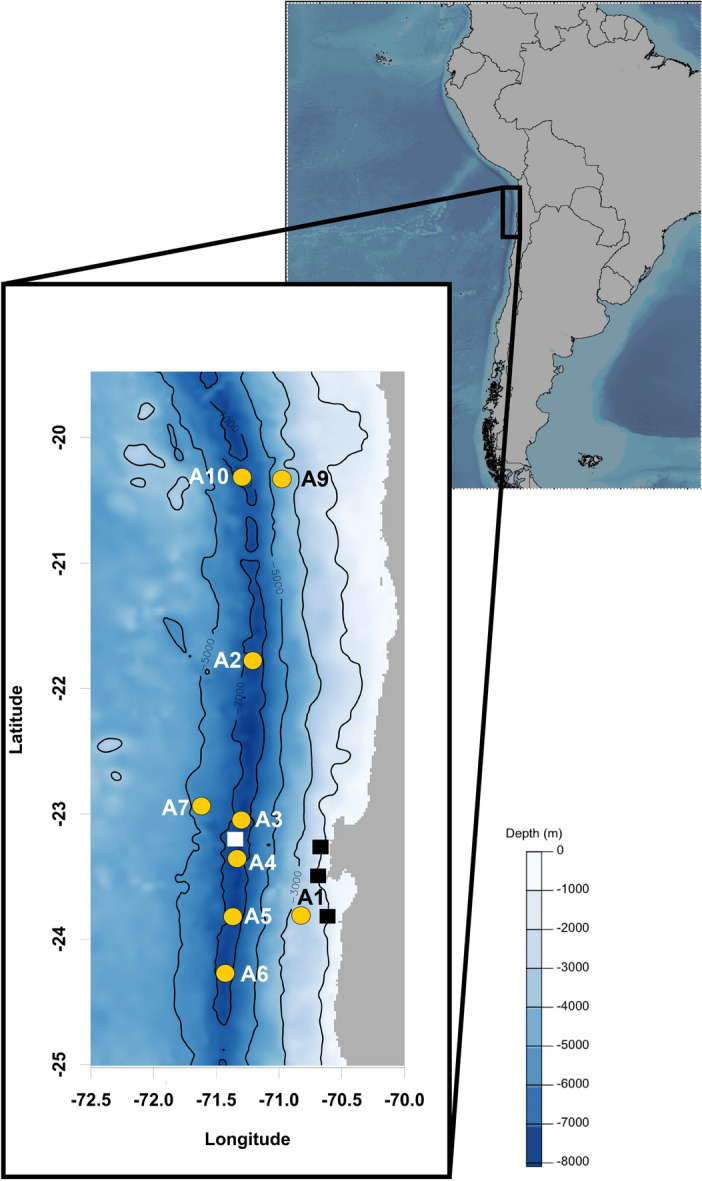
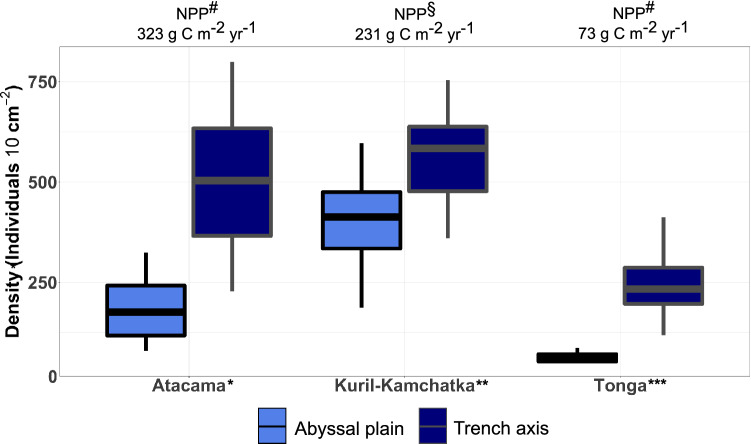
Hadal trenches are depocenters for organic material, and host intensified benthic microbial activity. The enhanced deposition is presumed to be reflected in elevated meiofaunal standing-stock, but available studies are ambiguous. Here, we investigate the distribution of meiofauna along the Atacama Trench axis and adjacent abyssal and bathyal settings in order to relate the meiofauna densities to proxies for food availability. Meiofauna densities peaked at the sediment surface and attenuated steeply with increasing sediment depth. The distribution mirrored the vertical profile of the microbial-driven oxygen consumption rate demonstrating a close linkage between microbial activity and meiofauna density. Meiofaunal standing-stock along the trench axis varied by a factor of two, but were markedly higher than values from the abyssal site at the oceanic plate. Overall, meiofaunal densities poorly correlated with common proxies for food availability such as total organic carbon and phytopigments, but strongly correlated with the microbial benthic O2 consumption rate. We argue that microbial biomass likely represents an important meiofaunal food source for hadal meiofauna. Observations from three trench systems underlying surface water of highly different productivity confirmed elevated meiofaunal densities at the trench axis as compared to abyssal sites on oceanic plates. Food availability appear to drive elevated abundance and variations in meiofauna densities in hadal sediments.
© 2022. The Author(s).
Conflict of interest statement
The authors declare no competing interests.
Figures


References
-
- Danovaro R, Snelgrove PV, Tyler P. Challenging the paradigms of deep-sea ecology. Trends Ecol. Evol. 2014;29:465–475. - PubMed
-
- Smith CR, Hoover DJ, Doan SE. Phytodetritus at the abyssal seafloor across 10° of latitude in the central equatorial Pacific. Oceanogr. Lit. Rev. 1997;4:318.
-
- Buesseler KO, et al. Revisiting carbon flux through the ocean’s twilight zone. Science. 2007;316:567–570. - PubMed
-
- Rex MA, et al. Global bathymetric patterns of standing stock and body size in the deep-sea benthos. Mar. Ecol. Prog. Ser. 2006;317:1–8.
-
- Clough LM, Renaud PE, Ambrose WG., Jr Impacts of water depth, sediment pigment concentration, and benthic macrofaunal biomass on sediment oxygen demand in the western Arctic Ocean. Can. J. Fish. Aquat. Sci. 2005;62:1756–1765.
Publication types
MeSH terms
LinkOut - more resources
Full Text Sources
