. 2022 Apr;7(4):581-589.
doi: 10.1038/s41564-022-01079-y. Epub 2022 Mar 14.

Population genomics of Escherichia coli in livestock-keeping households across a rapidly developing urban landscape

Affiliations

Population genomics of Escherichia coli in livestock-keeping households across a rapidly developing urban landscape

Dishon M Muloi et al. Nat Microbiol. 2022 Apr.

Abstract

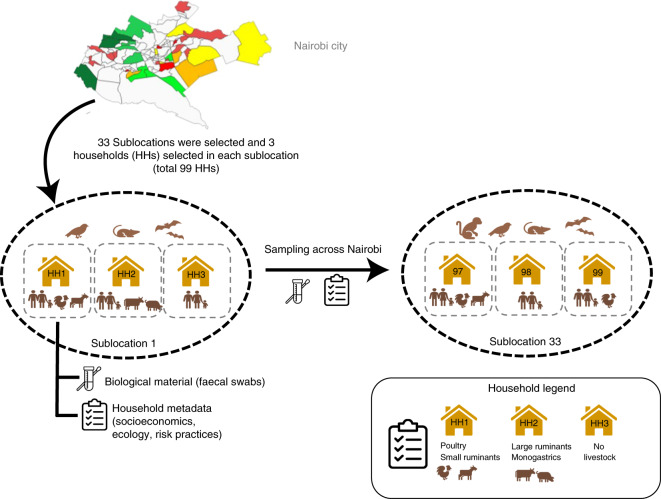
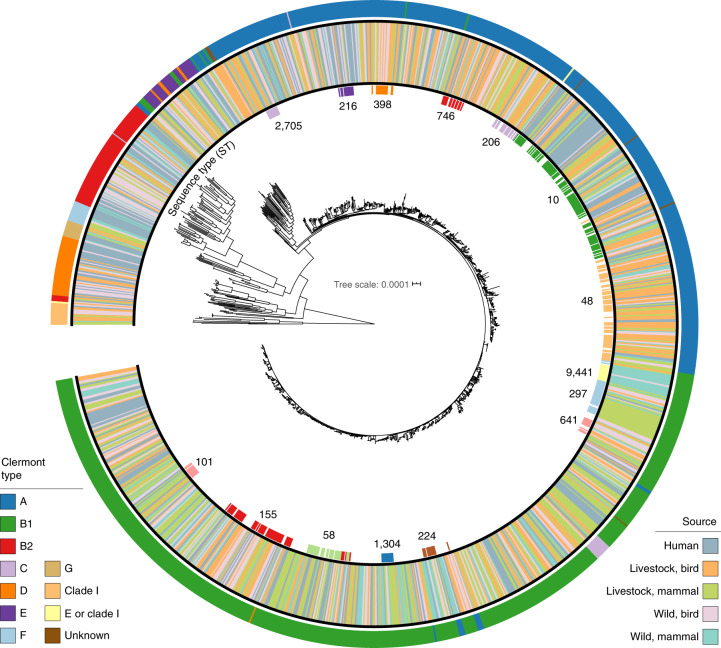
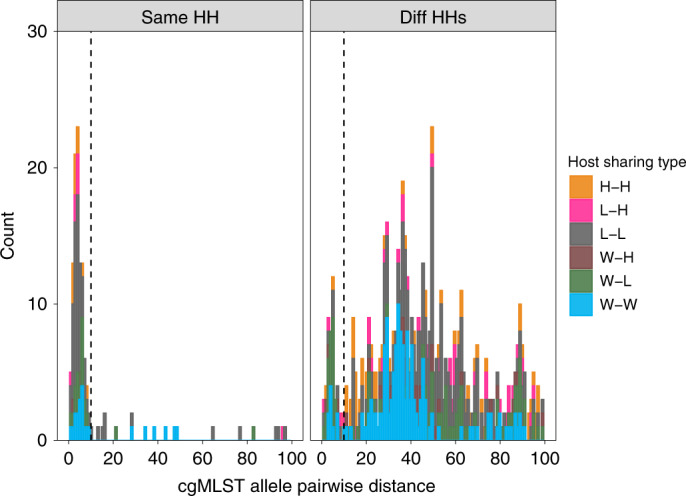
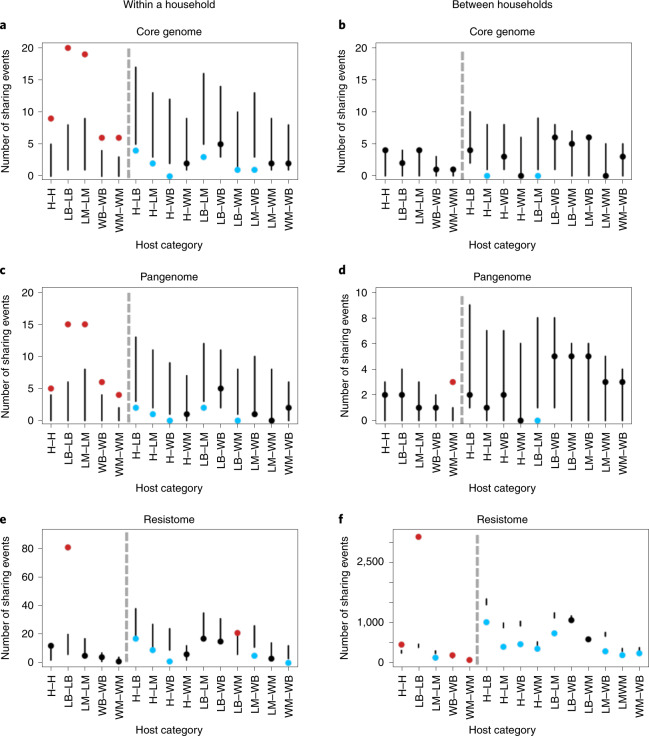
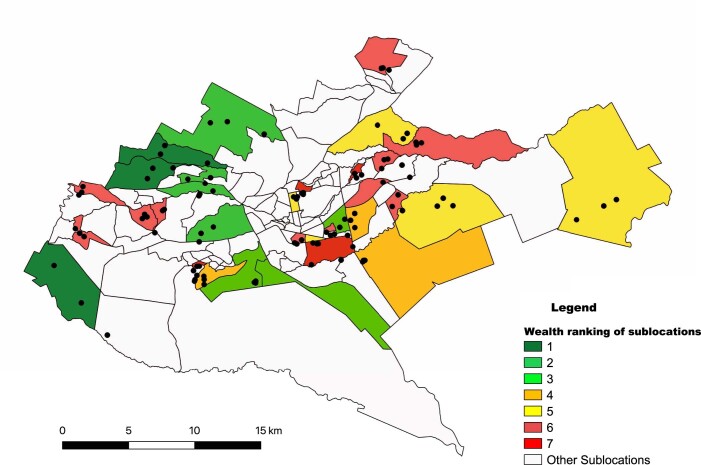
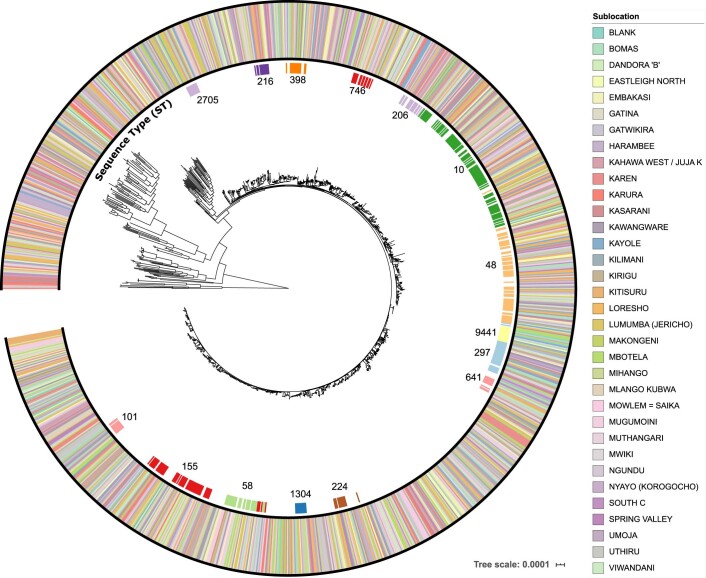
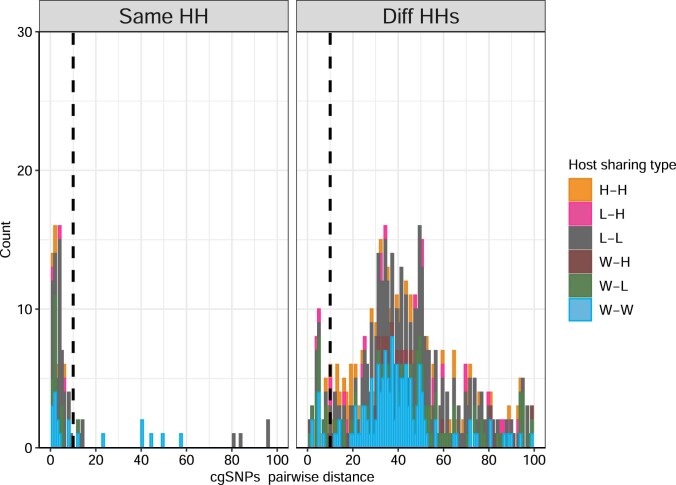
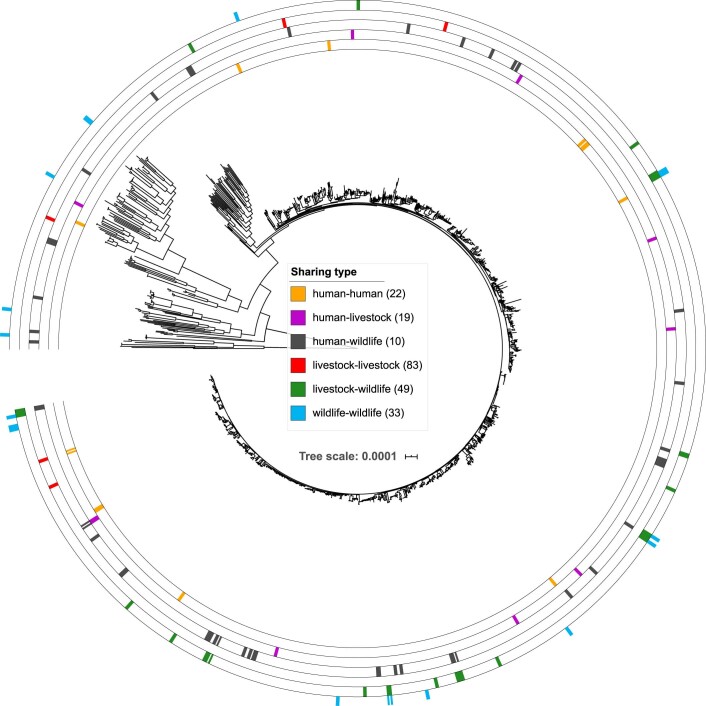
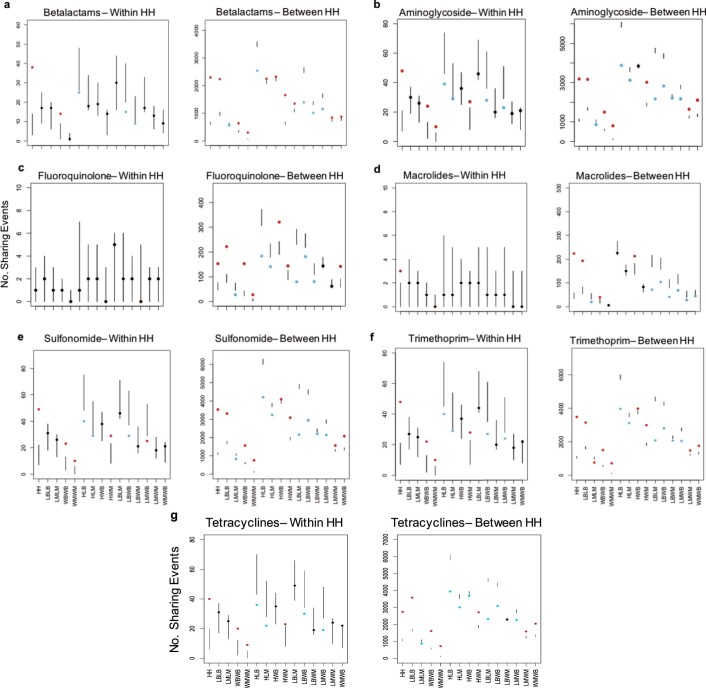
Quantitative evidence for the risk of zoonoses and the spread of antimicrobial resistance remains lacking. Here, as part of the UrbanZoo project, we sampled Escherichia coli from humans, livestock and peri-domestic wildlife in 99 households across Nairobi, Kenya, to investigate its distribution among host species in this rapidly developing urban landscape. We performed whole-genome sequencing of 1,338 E. coli isolates and found that the diversity and sharing patterns of E. coli were heavily structured by household and strongly shaped by host type. We also found evidence for inter-household and inter-host sharing and, importantly, between humans and animals, although this occurs much less frequently. Resistome similarity was differently distributed across host and household, consistent with being driven by shared exposure to antimicrobials. Our results indicate that a large, epidemiologically structured sampling framework combined with WGS is needed to uncover strain-sharing events among different host populations in complex environments and the major contributing pathways that could ultimately drive the emergence of zoonoses and the spread of antimicrobial resistance.


Conflict of interest statement

The authors declare no competing interests.

Figures

Fig. 1
Fig. 1. Flow diagram of the household selection procedure.
Different colours given to the sublocations on the Nairobi city map represent different wealth categories (dark green, wealthy; dark red, poor). Source data
Fig. 2
Fig. 2. Core genome phylogeny of 1,338 E. coli isolates.
Inner ring: STs (only STs with a minimum of ten isolates are shown); middle ring: source type of isolate; outer ring: Clermont phylotype classifications. The tree is rooted on the clade I group. Source data
Fig. 3
Fig. 3. Frequency distribution of pairwise distances among isolates from the same household and from different households.
cgMLST allele pairwise distances among isolates from the same household (HH; left) and from different (Diff) HHs (right). The sources of isolates in each pair are indicated by the colour. Only pairs that are closer than 100 cgMLST loci apart are shown. The vertical dashed black line indicates the sharing threshold (10 cgMLST alleles). H, human; L, livestock; W, wildlife. Source data
Fig. 4
Fig. 4. Number of sharing pairs for core genomes, pangenomes and resistomes within and between households.
a,c,e, Number of within-household sharing pairs across 15 host category types for core genomes (a) (n = 121), pangenomes (c) (n = 94) and resistomes (e) (n = 9,502). b,d,f, Number of between-household sharing pairs across 15 host category types for core genomes (b) (n = 121), pangenomes (d) (n = 94) and resistomes (f) (n = 9,502). Panels show the 95% confidence intervals (vertical lines) of the calculated expected distribution using a resampling approach. Points depict the observed number of sharing pairs in each category coloured according to whether they fall above (red), below (blue) or within (black) the expected distribution. Hosts in the same category (for example, H–H) and different categories (for example, H–LB) are separated by grey dashed lines. Source type of isolate pairs is indicated on the x axis with human (H), livestock birds (LB), livestock mammals (LM), wildlife birds (WB) and wildlife mammals (WM). In each plot, within-category connections are on the left of the grey dotted line and between-category connections are on the right.
Extended Data Fig. 1
Extended Data Fig. 1. Geographical distribution of selected sublocations within the city of Nairobi chosen based on a socio-economic stratification, together with locations of each of 99 households selected within each stratum.
Different colours given to the sublocations represent different wealth categories (Dark green – wealthy, dark red – poor). Source data
Extended Data Fig. 2
Extended Data Fig. 2. Maximum-Likelihood tree of a core genome alignment showing the distribution of isolates across 33 sublocations in Nairobi.
The outermost ring is colored according to the sublocation of sample origin and innermost ring represents the commonly predicted sequence types (ST) in our isolate collection. Source data
Extended Data Fig. 3
Extended Data Fig. 3. Output of cutpointR, used to identify the optimal threshold to maximise the differentiation between sharing pairs occurring within households (same) and between households (diff) at 10 cgMLST loci.
The black vertical lines on the 2 panels on the left indicate the optimal_cutpoint value of 10 as calculated by cutpointR. Source data
Extended Data Fig. 4
Extended Data Fig. 4. Plot of geographical distance of bacterial sharing in pairs involving different households (n = 49).
Abbreviations: H- Human, LB – Livestock Bird, WB – Wild Birds, LM – Livestock mammals, LB – Livestock Birds. Boxplot centre lines show median value; upper and lower bounds show the 25th and 75th quantile, respectively; upper and lower whiskers show the largest and smallest values within 1.5 times the interquartile range above the 75th percentile and below the 25th percentile, respectively; and points show data points (jittered to improve visualisation). Source data
Extended Data Fig. 5
Extended Data Fig. 5. The distribution of closely related isolates (separated by 100 cgSNPS, n = 660) based on core genome SNPs (cgSNPs).
An alignment of 399,673 aligned nucleotide positions were used. Each of these core SNP positions were conserved in at least 99.8% of isolates (1335/1338). The vertical dashed black line indicates the sharing threshold (10 cgSNPs). Source data
Extended Data Fig. 6
Extended Data Fig. 6. The correlation between pairwise genetic distances measured by core genome single nucleotide polymorphisms (cgSNPs) and core genome multi locus sequence typing (cgMLST) of pairs of isolates with ≤ 100 cgMLST and ≤ 1000 cgSNPs.
73% of pairs with ≤ 10 cgMLST loci apart (n = 109) were separated by ≤ 4 cgSNPs while 97% (n = 145) of these ≤10 cgMLST pairs were separated by ≤10 core SNPs. Only one pair had more than 13 cgSNPs. Two horizontal red dotted lines indicate 4 and 10 cgSNPs. Boxplot centre lines show median value; upper and lower bounds show the 25th and 75th quantile, respectively; upper and lower whiskers show the largest and smallest values within 1.5 times the interquartile range above the 75th percentile and below the 25th percentile, respectively; and points show show samples outside the whisker range. Source data
Extended Data Fig. 7
Extended Data Fig. 7. Core genome phylogenetic tree showing the distribution of isolates involved in the 6 different categories of sharing events.
Ring colours indicate the sharing category (human-human, human-livestock, human-wildlife, livestock-livestock, livestock-wildlife, wildlife-wildlife) from the innermost to the outermost rings, respectively. Source data
Extended Data Fig. 8
Extended Data Fig. 8. Number of sharing events across 15 host category types, within and between households for each of 7 identified antibiotic classes.
(a) Beta-lactam (n = 21686), (b) Aminoglycosides (n = 36934), (c) Fluoroquinolone (n = 2088), (d) Macrolide (n = 1533), (e) Sulfonamide (n = 38125), (f) Trimethoprim (n = 36315), (g) Tetracyclines (n = 36816). Panels show the 95% confidence intervals (vertical lines) of the calculated expected distribution using a resampling approach, points depict the observed number of sharing events in each category coloured according to whether they fall above (red), below (blue) or within (black) the expected distribution. Source type of isolate pairs are indicated on the x-axis with either Human (H), Livestock birds (LB), Livestock mammals (LM), Wildlife birds (WB), Wildlife mammals (WM). In each plot, within-category connections are on the left of the grey dotted line and between-category connections are on the right. Source data

Comment in

  • Baas Becking meets One Health.
    van Schaik W. van Schaik W. Nat Microbiol. 2022 Apr;7(4):482-483. doi: 10.1038/s41564-022-01100-4. Nat Microbiol. 2022. PMID: 35365789 No abstract available.

References

    1. Karesh WB, et al. Ecology of zoonoses: natural and unnatural histories. Lancet. 2012;380:1936–1945. - PMC - PubMed
    1. Wolfe ND, Dunavan CP, Diamond J. Origins of major human infectious diseases. Nature. 2007;447:279–283. - PMC - PubMed
    1. Allen T, et al. Global hotspots and correlates of emerging zoonotic diseases. Nat. Commun. 2017;8:1124. - PMC - PubMed
    1. Zhang, F. et al. Global discovery of human-infective RNA viruses: a modelling analysis. PLoS Pathog. 10.1371/journal.ppat.1009079 (2020). - PMC - PubMed
    1. Gottdenker NL, Streicker DG, Faust CL, Carroll CR. Anthropogenic land use change and infectious diseases: a review of the evidence. EcoHealth. 2014;11:619–632. - PubMed

Publication types