Meta-Analysis
. 2022 Apr;28(4):743-751.
doi: 10.1038/s41591-022-01720-7. Epub 2022 Mar 14.

Single-cell transcriptomics reveals a distinct developmental state of KMT2A-rearranged infant B-cell acute lymphoblastic leukemia

Affiliations
Meta-Analysis

Single-cell transcriptomics reveals a distinct developmental state of KMT2A-rearranged infant B-cell acute lymphoblastic leukemia

Eleonora Khabirova et al. Nat Med. 2022 Apr.

Abstract

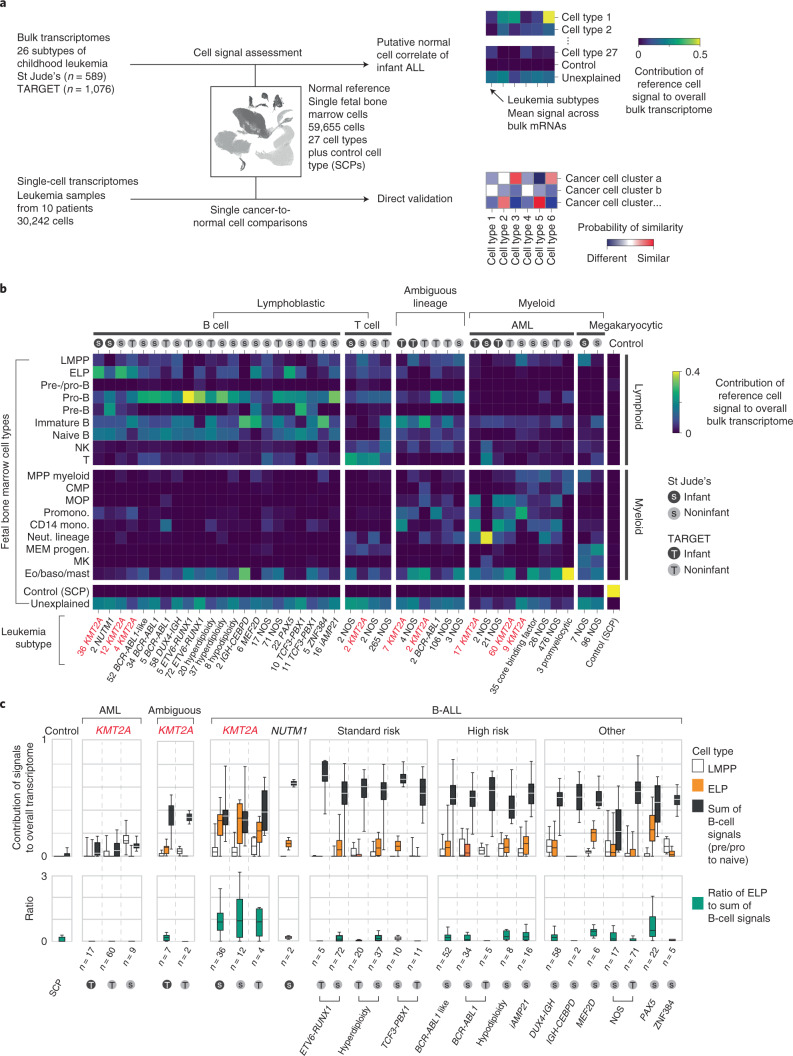
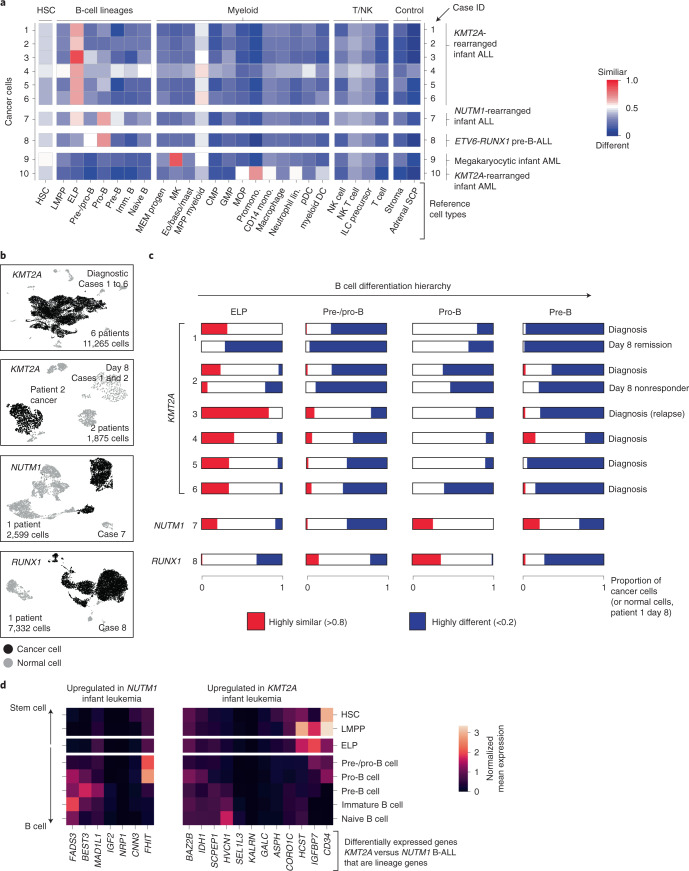
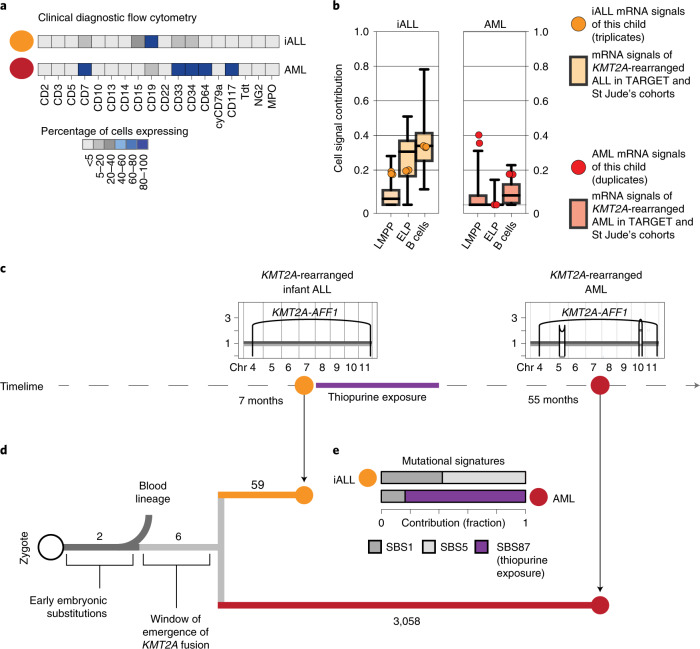
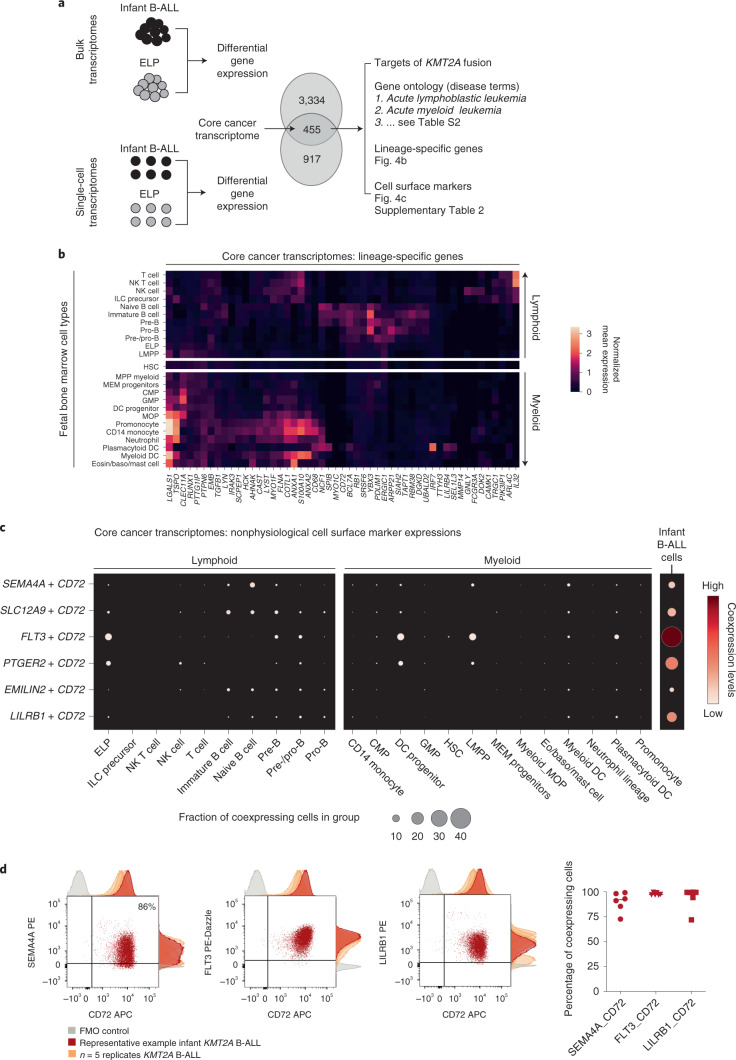
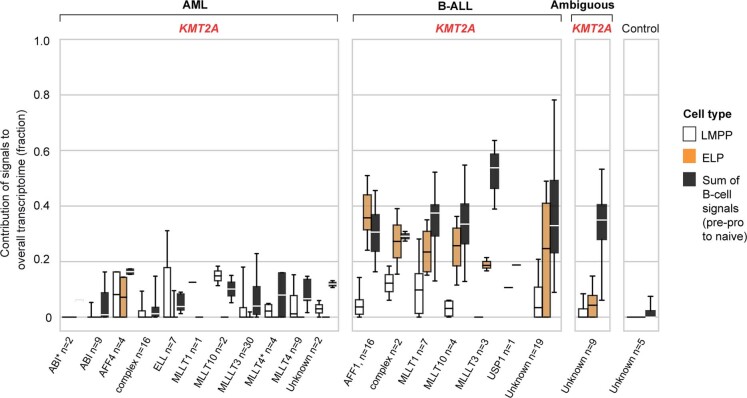
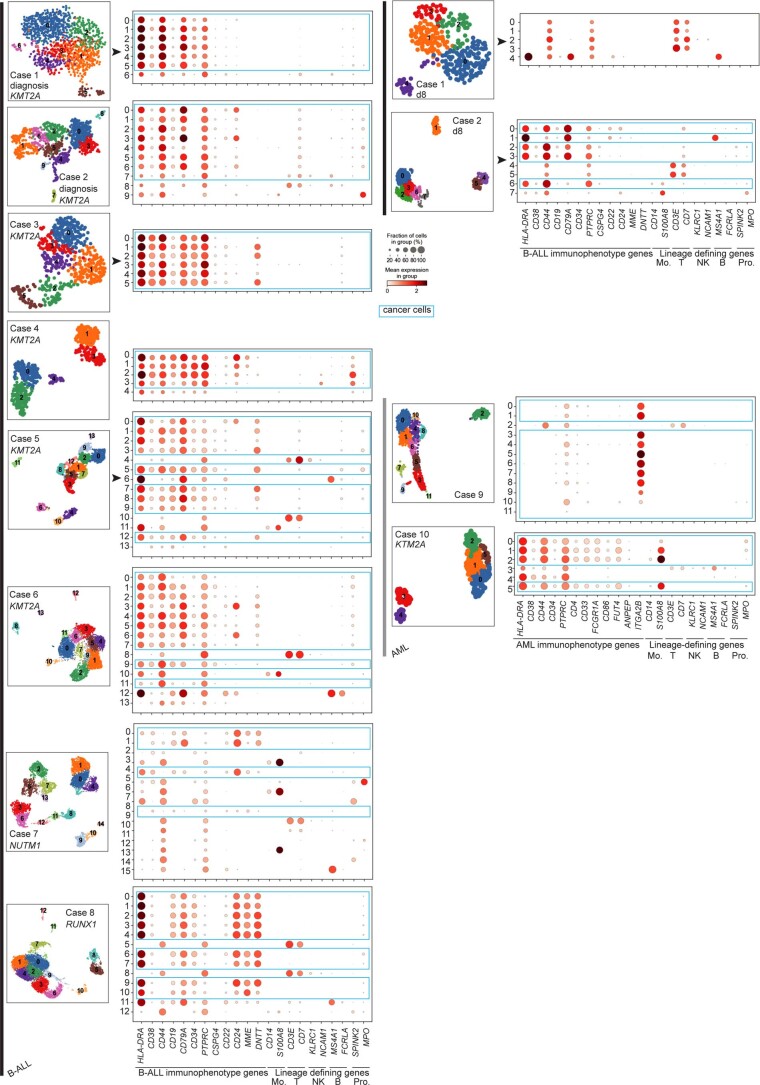
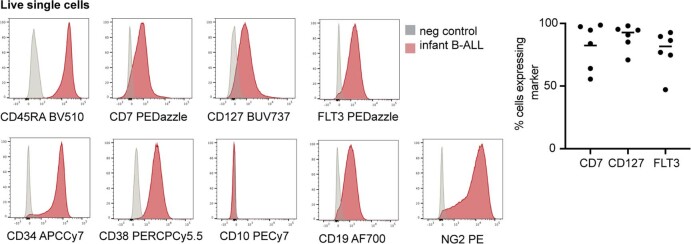
KMT2A-rearranged infant ALL is an aggressive childhood leukemia with poor prognosis. Here, we investigated the developmental state of KMT2A-rearranged infant B-cell acute lymphoblastic leukemia (B-ALL) using bulk messenger RNA (mRNA) meta-analysis and examination of single lymphoblast transcriptomes against a developing bone marrow reference. KMT2A-rearranged infant B-ALL was uniquely dominated by an early lymphocyte precursor (ELP) state, whereas less adverse NUTM1-rearranged infant ALL demonstrated signals of later developing B cells, in line with most other childhood B-ALLs. We compared infant lymphoblasts with ELP cells and revealed that the cancer harbored hybrid myeloid-lymphoid features, including nonphysiological antigen combinations potentially targetable to achieve cancer specificity. We validated surface coexpression of exemplar combinations by flow cytometry. Through analysis of shared mutations in separate leukemias from a child with infant KMT2A-rearranged B-ALL relapsing as AML, we established that KMT2A rearrangement occurred in very early development, before hematopoietic specification, emphasizing that cell of origin cannot be inferred from the transcriptional state.


Conflict of interest statement

The authors declare no competing interests.

Figures

Fig. 1
Fig. 1. Cell signal analysis of 1,665 leukemia transcriptomes reveals an ELP state in KMT2A-rearranged B-ALL.
a, Schematic overview of the study approach. We assessed the differentiation state of KMT2A-rearranged infant ALL by measuring signals of human fetal bone marrow cell types across the entire spectrum of childhood leukemia in data derived from two different cohorts (St Jude’s and TARGET). We then validated cell signals by single-cell mRNA sequencing for direct comparison of cancer and normal cells. b, Heatmap showing mean cell signals of human fetal bone marrow cells (y axis) in human leukemia bulk transcriptomes subdivided by genetic subtype (see labels underneath, KMT2A rearrangements shown in red text), age (gray circle, infant; black circle, noninfant) and source (S, St Jude’s; T, TARGET). Numbers next to labels refer to case load per subtype. Subtypes with only one case were excluded from analysis. baso, basophil; CMP, common myeloid progenitor; Eo, eosinophil; LMPP, lymphoid-primed multipotent progenitor; MEM progen., ; MK, megakaryocyte; mono., monocyte; MOP, monocyte progenitor; MPP, multipotent progenitor; Neut., neutrophil; NK, natural killer; Promono., promonocyte. c, Top: box and whisker plots showing proportional contribution of signals (lymphomyeloid-primed progenitor, ELP and later B-cell stages combined (i.e., pre-/pro-B, pro-B, pre-B and naive B)) to the transcriptome of leukemias (see x axis labels). Bottom: box and whisker plots summarizing the ratio of ELP to later B-cell stage signals. Center lines represent the median, box limits represent 25%/75% quartiles and whiskers represent minimum/maximum (top) and 1.5× interquartile range (bottom). n is the number of biologically independent variables, as listed below each group of plots. Risk refers to the clinical cytogenetic risk as defined in the protocol of the current European ALL trial ‘ALLTogether’ (EudraCT 2018-001795-38).
Fig. 2
Fig. 2. Validation of ELP signals by direct single cancer cell to normal cell comparison.
a, Heatmap comparing cell clusters from diagnostic specimens (y axis) to normal human fetal bone marrow cell types (x axis; bold labels highlight cell types shown in C). Cell clusters represent cancer (as defined by clinical diagnostic flow cytometric profiles, see Extended Data Fig. 2) and normal cells of individual patient samples (as per case ID number; see Supplementary Table 3 for an overview of patients). All are diagnostic samples at presentation, except case 3 (relapse presentation). Heat colors represent the mean probability (across the cell cluster) of a match as determined by logistic regression (red, similar; blue, different). DC, dendritic cell; GMP, granulocyte–monocyte progenitor; HSC, hematopoietic stem cell; ILC, innate lymphoid cell; Imm., immature; lin., lineage; pDC, plasmacytoid dendritic cell. b, Uniform manifold approximation and projection of B-ALL scRNA-seq data divided by genetic subtype. KMT2A-rearranged B-ALL at diagnosis and day 8 of treatment are presented separately. Within each heatmap, black dots represent cancer and gray dots noncancer. c, Per cancer cell (normal cells for day 8 remission samples of patient 1) logistic regression score against reference B-lineage cell states, with thresholds of >0.8 indicating similarity (red) and <0.2 indicating dissimilarity (blue). d, Subset of differentially expressed genes between infant KMT2A-rearranged B-ALL and NUTM1-rearranged B-ALL. x axis, gene name; y axis, fetal bone marrow cell type. Heatmap shows the average gene expression per reference cell type for genes up-regulated in NUTM1 B-ALL (left) and KMT2A B-ALL (right).
Fig. 3
Fig. 3. Phylogenetic timing of the origin of infant ALL.
a, Diagnostic flow cytometry of two leukemias that arose in the same child 4 years apart: KMT2A-rearranged infant ALL (yellow, abbreviated iALL) and KMT2A-rearranged AML (red). MPO, myeloperoxidase. b, Cell signal assessment of bulk transcriptomes generated from this child (ALL in technical triplicates, AML in technical duplicates) shows that the cell signals (LMMP, ELP and B cells (i.e., the sum of all B-cell signals)) of ALL (yellow circle) and AML (red circle) follow the pattern of KMT2A-rearranged ALL (left, boxplots in background, n = 52 biologically independent samples) and KMT2A-rearranged AML (right, boxplots in background, n = 86 biologically independent samples), as defined in the St Jude’s and TARGET cohorts. Boxplot center line represents the median, whiskers represent minimum/maximum and box limits represent 25%/75% quartiles. c, Timeline with copy-number profiles of chromosomes 4 to 11 (all other chromosomes were diploid) in both leukemias showing chromosomes (x axis) and copy number (y axis), alleles (light and dark grey lines) and rearrangement breakpoints (black vertical lines and arcs), including the chromosome 4:11 translocation underpinning the KMT2A-AFF1 fusion. d, Phylogeny of blood and leukemia lineages with substitution burden defining each branch (number). e, Assessment of mutational signatures as defined by the trinucleotide context of substitutions (nomenclature as per Alexandrov et al.) highlighting in purple the dominant contribution (as percentage of all clonal substitutions) of signature 87 to AML. This signature is thought to be due to thiopurine agents that the child had received for ALL treatment (see timeline).
Fig. 4
Fig. 4. Therapeutic hypotheses based on the ELP state of infant ALL.
a, Distilling the core cancer transcriptome (i.e., differential gene expression between infant ALL and ELP cells from bulk and single-cell data) to generate a cross-validated gene list that we annotated in three ways (right). b, The core cancer transcriptome encodes a mixed myeloid–lymphoid phenotype. Shown is the log normalized expression (heat color) of genes (x axis) that have relative lineage specificity in normal fetal bone marrow cell types (y axis). Eosin, eosinophil. c, Examples of nonphysiological combinations of cell surface markers that the core cancer transcriptome encompasses. x axis, fetal bone marrow cell type or infant B-ALL lymphoblasts; y axis, marker combinations. Dots represent coexpression of the markers (average of the product of gene expression). Dot size represents the percentage of cells in the cluster that express both markers, and heat color represents the normalized coexpression level. d, Left: dotplots showing coexpression of antigen combinations in a representative primary KMT2A-rearranged infant B-ALL sample, as measured by flow cytometry on live, single CD34+CD19+ blasts. Adjunct histograms show fluorescence-minus-one (FMO) negative controls (gray) and antigen expression in the representative sample (red) compared with n = 2 xenograft samples and n = 3 further primary infant B-ALL samples (orange). APC, allophycocyanin; PE, phycoerythrin. Right: scatterplot demonstrating the percentage of cells in each sample with expression of antigen pair higher than the fluorescence-minus-one control (line represents median).
Extended Data Fig. 1
Extended Data Fig. 1. ELP signal is common to KMT2A-rearranged B-ALL, independent of fusion partner.
Box and whisker plots showing contributions of cell signals – LMPP, ELP and latter B-cell stages (that is pre-pro-B, pro-B, pre-B and naive B combined) to the transcriptome of KMT2A-rearranged leukemias grouped by KMT2A fusion partner (see x axis labels). Centre lines=median, box limits=25%/75% quartiles, whiskers=min/max (top) and 1.5*interquartile range (bottom). n= biologically independent variables, as listed below each group of plots.
Extended Data Fig. 2
Extended Data Fig. 2. Identification of cancer cells in leukemia scRNA-seq data using immunophenotype gene expression.
UMAP projections of leukaemia scRNA-seq data sets, coloured by Louvain cluster. Accompanying dotplots show per-cluster expression of B-ALL immunophenotype genes or AML immunophenotype genes and lineage-defining genes of monocytes (Mo.), T cells (T), NK cells (NK), B cells (B) and progenitors (Pro.). Dot colour denotes log-transformed, normalised and scaled gene expression value, while dot size indicates percentage of cells in each cluster expressing the stated gene. Immunophenotypes are provided in Supplementary Table 4.
Extended Data Fig. 3
Extended Data Fig. 3. Immunophenotype of KMT2A-rearranged infant B-ALL.
Left: Histograms showing surface antigen expression in a representative primary KMT2A-rearranged infant B-ALL sample relative to negative control. Right: Scatterplot showing percentage of cells in each sample expressing ELP-characteristic antigens > negative control (n = 2 xenograft, n = 4 primary KMT2A-rearranged infant B-ALL). Line= mean; 82% CD7+, 93% CD127+ and 82% FLT3+).
Extended Data Fig. 4
Extended Data Fig. 4. Annotation of genes shared by KMT2A-rearranged myeloid and lymphoid leukemias.
Barplot showing biological categories of genes shared between the KMT2A-rearranged B-ALL and KMT2A-rearranged AML core cancer transcriptomes.

References

    1. Pieters R, et al. Outcome of infants younger than 1 year with acute lymphoblastic leukemia treated with the Interfant-06 protocol: results from an international phase III randomized study. J. Clin. Oncol. 2019;37:2246–2256. doi: 10.1200/JCO.19.00261. - DOI - PubMed
    1. Pieters R, et al. A treatment protocol for infants younger than 1 year with acute lymphoblastic leukaemia (Interfant-99): an observational study and a multicentre randomised trial. Lancet. 2007;370:240–250. doi: 10.1016/S0140-6736(07)61126-X. - DOI - PubMed
    1. Ramakers-van Woerden NL, et al. In vitro drug-resistance profile in infant acute lymphoblastic leukemia in relation to age, MLL rearrangements and immunophenotype. Leukemia. 2004;18:521–529. doi: 10.1038/sj.leu.2403253. - DOI - PubMed
    1. Gardner R, et al. Acquisition of a CD19-negative myeloid phenotype allows immune escape of MLL-rearranged B-ALL from CD19 CAR-T-cell therapy. Blood. 2016;127:2406–2410. doi: 10.1182/blood-2015-08-665547. - DOI - PMC - PubMed
    1. Sison EAR, Brown P. Does hematopoietic stem cell transplantation benefit infants with acute leukemia? Hematology. 2013;2013:601–604. doi: 10.1182/asheducation-2013.1.601. - DOI - PMC - PubMed

Publication types

Substances