Multicenter Study
. 2022 Apr;28(4):713-723.
doi: 10.1038/s41591-022-01702-9. Epub 2022 Mar 14.

Gut microbiome correlates of response and toxicity following anti-CD19 CAR T cell therapy

Affiliations
Multicenter Study

Gut microbiome correlates of response and toxicity following anti-CD19 CAR T cell therapy

Melody Smith et al. Nat Med. 2022 Apr.

Erratum in

  • Author Correction: Gut microbiome correlates of response and toxicity following anti-CD19 CAR T cell therapy.
    Smith M, Dai A, Ghilardi G, Amelsberg KV, Devlin SM, Pajarillo R, Slingerland JB, Beghi S, Herrera PS, Giardina P, Clurman A, Dwomoh E, Armijo G, Gomes ALC, Littmann ER, Schluter J, Fontana E, Taur Y, Park JH, Palomba ML, Halton E, Ruiz J, Jain T, Pennisi M, Afuye AO, Perales MA, Freyer CW, Garfall A, Gier S, Nasta S, Landsburg D, Gerson J, Svoboda J, Cross J, Chong EA, Giralt S, Gill SI, Riviere I, Porter DL, Schuster SJ, Sadelain M, Frey N, Brentjens RJ, June CH, Pamer EG, Peled JU, Facciabene A, van den Brink MRM, Ruella M. Smith M, et al. Nat Med. 2023 Nov;29(11):2954. doi: 10.1038/s41591-022-02069-7. Nat Med. 2023. PMID: 36253610 Free PMC article. No abstract available.

Abstract

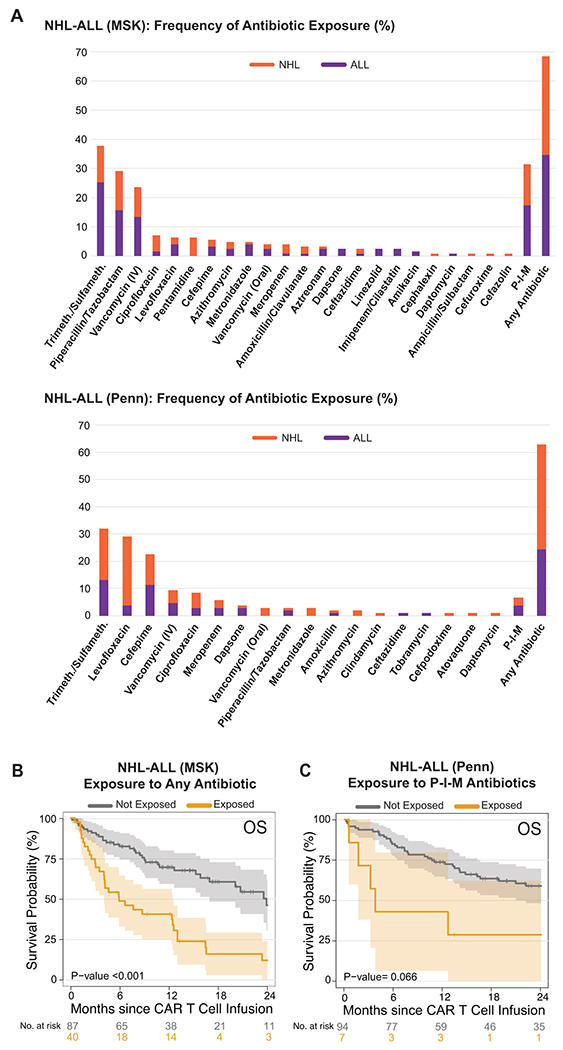
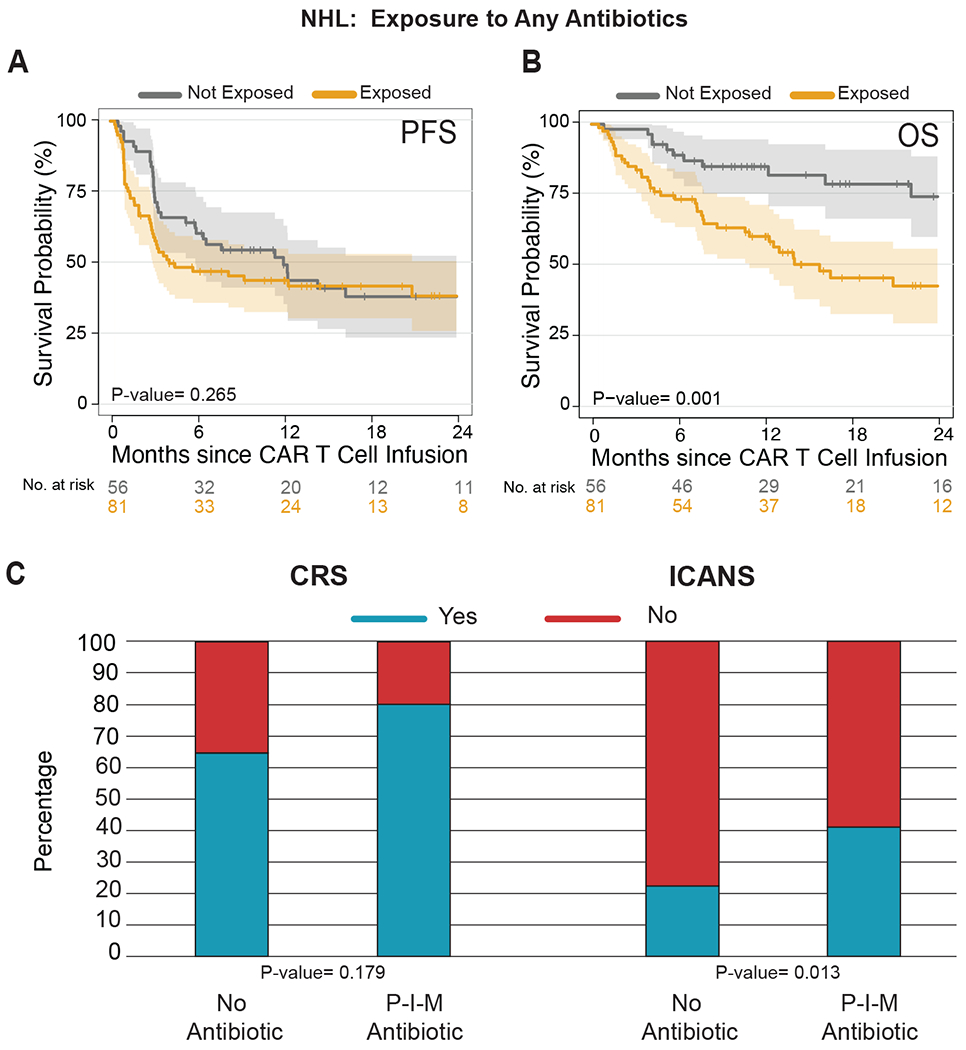
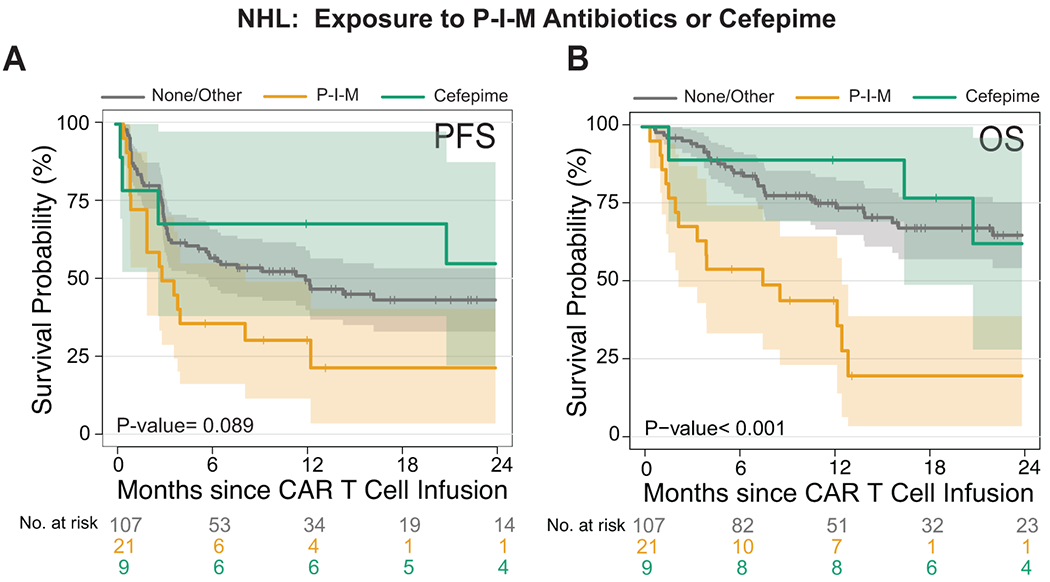
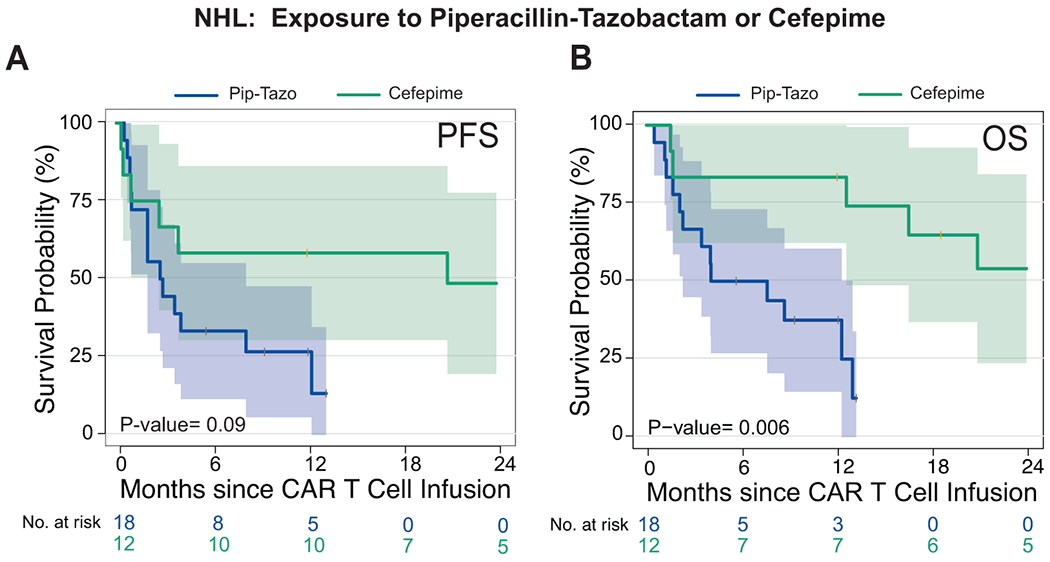
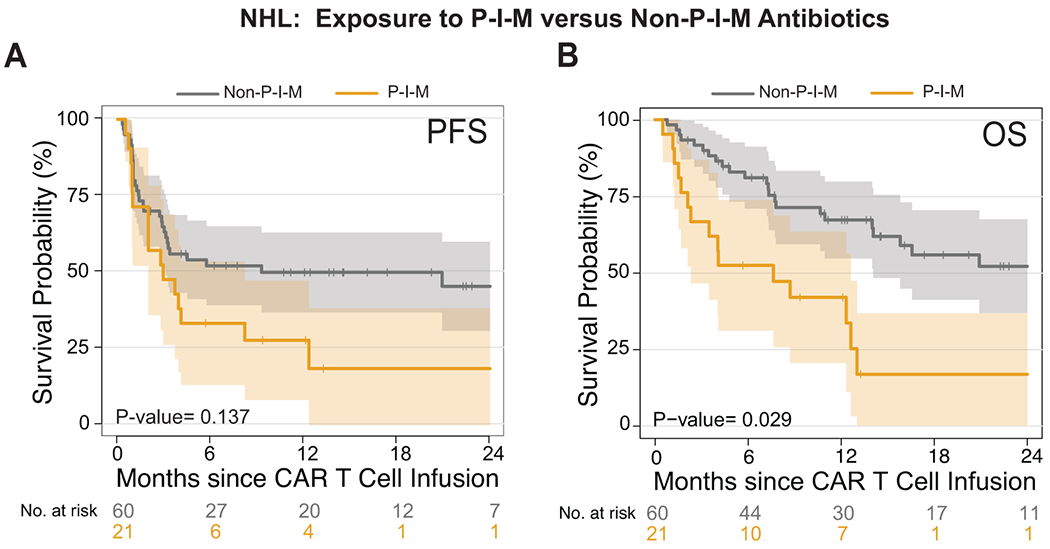
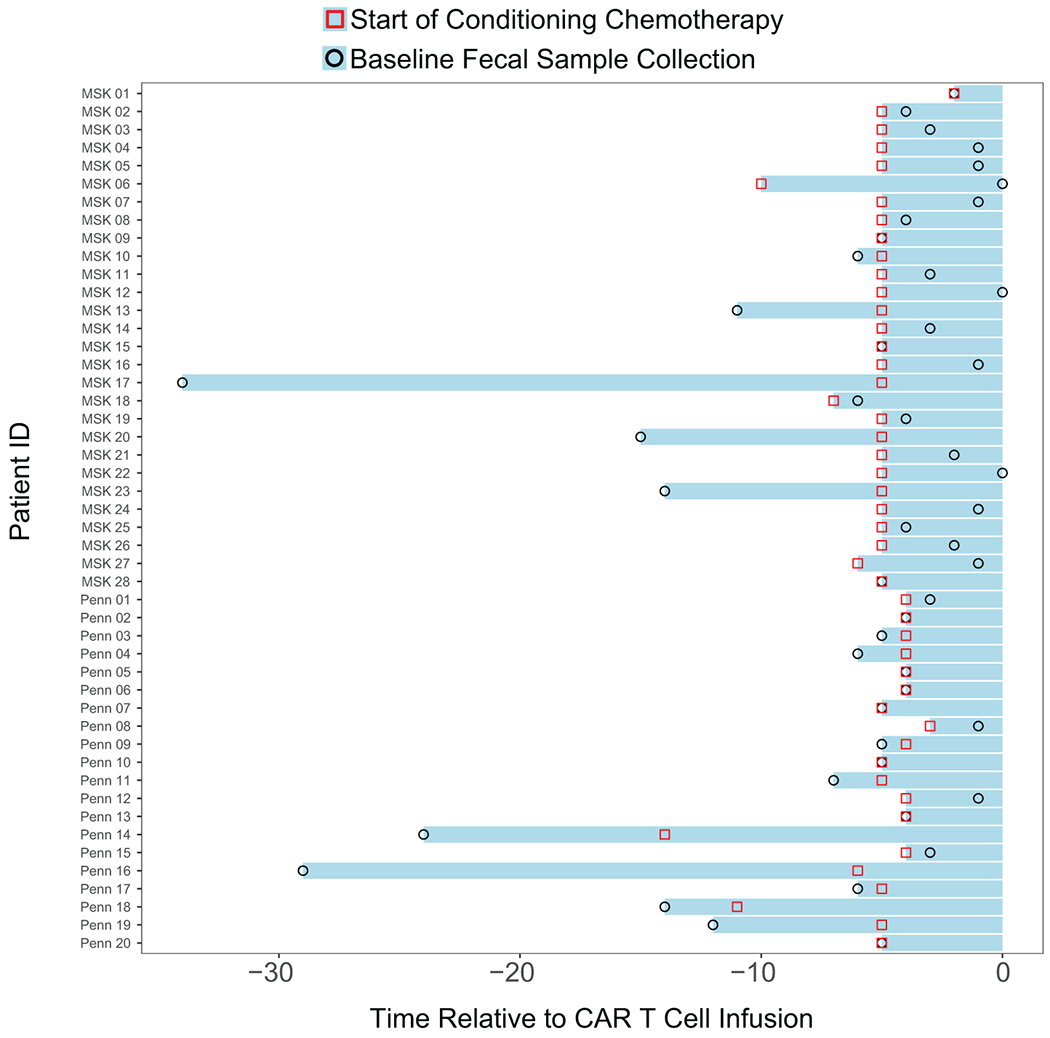
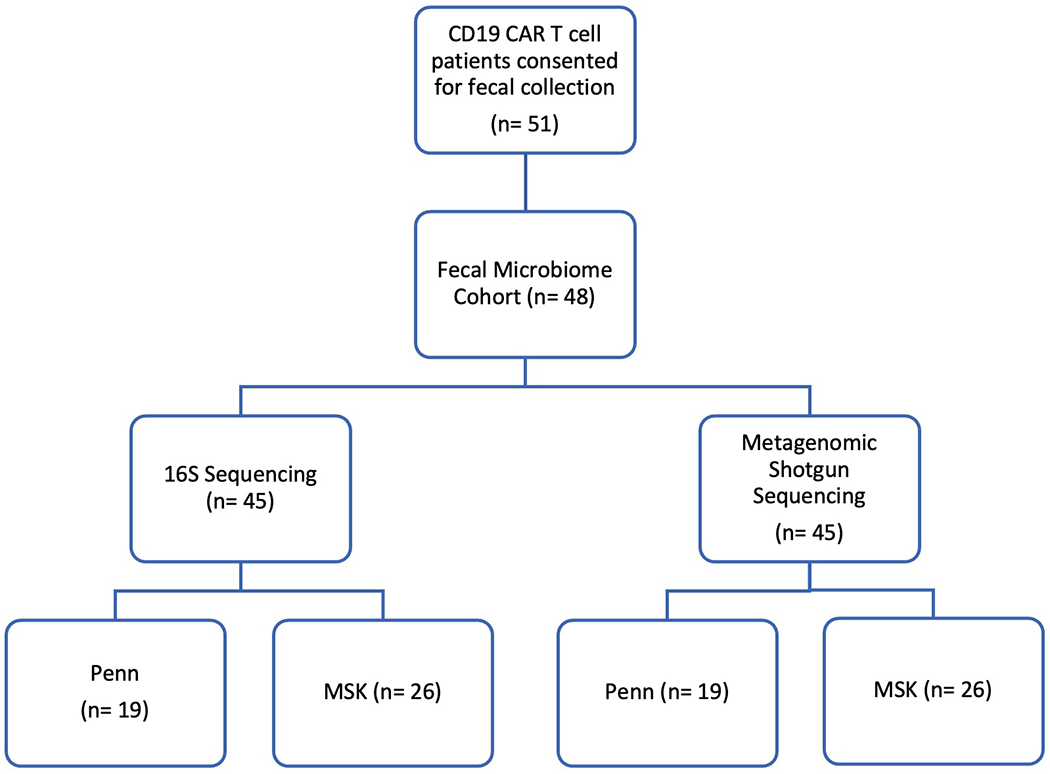
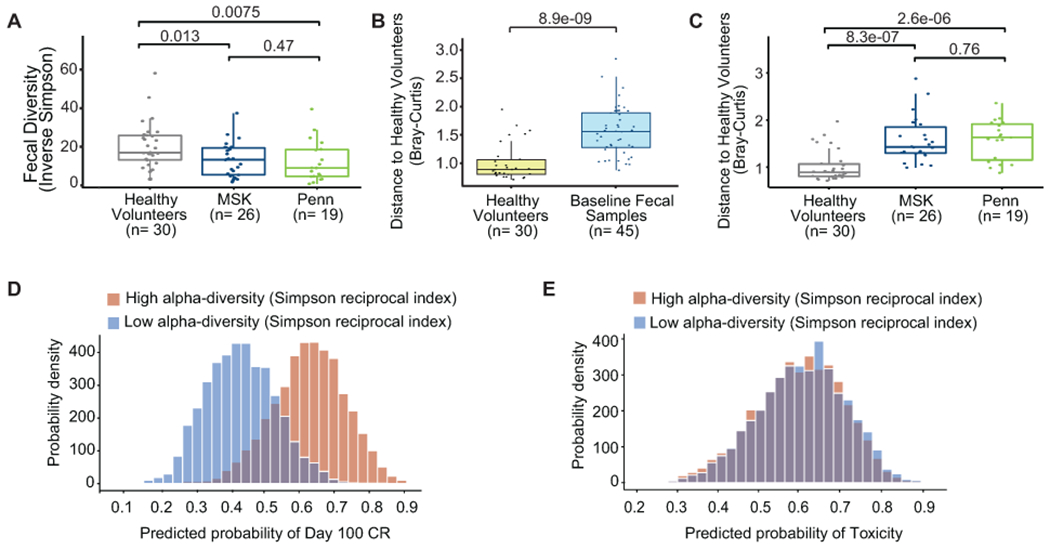
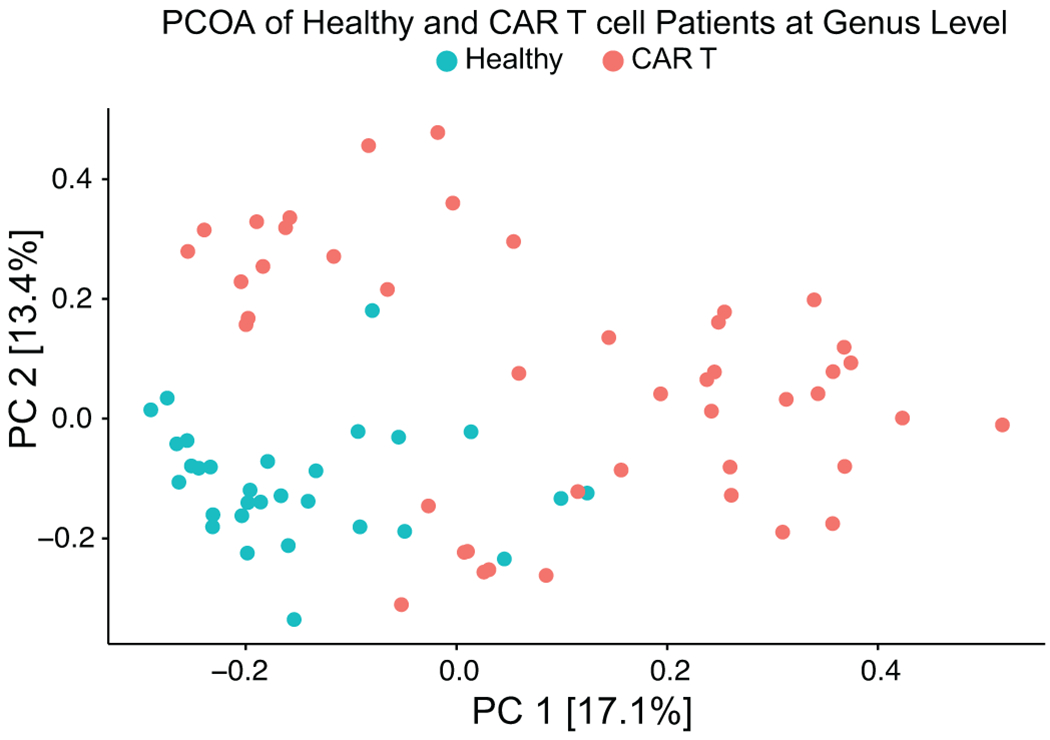
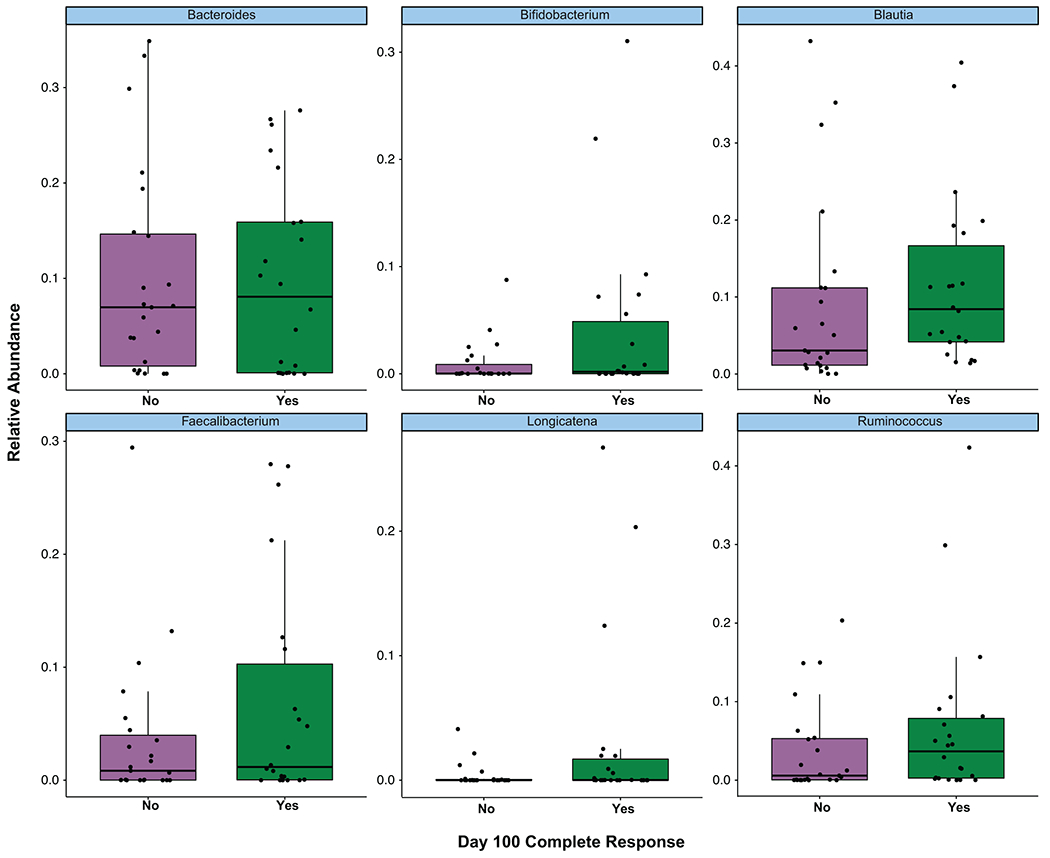
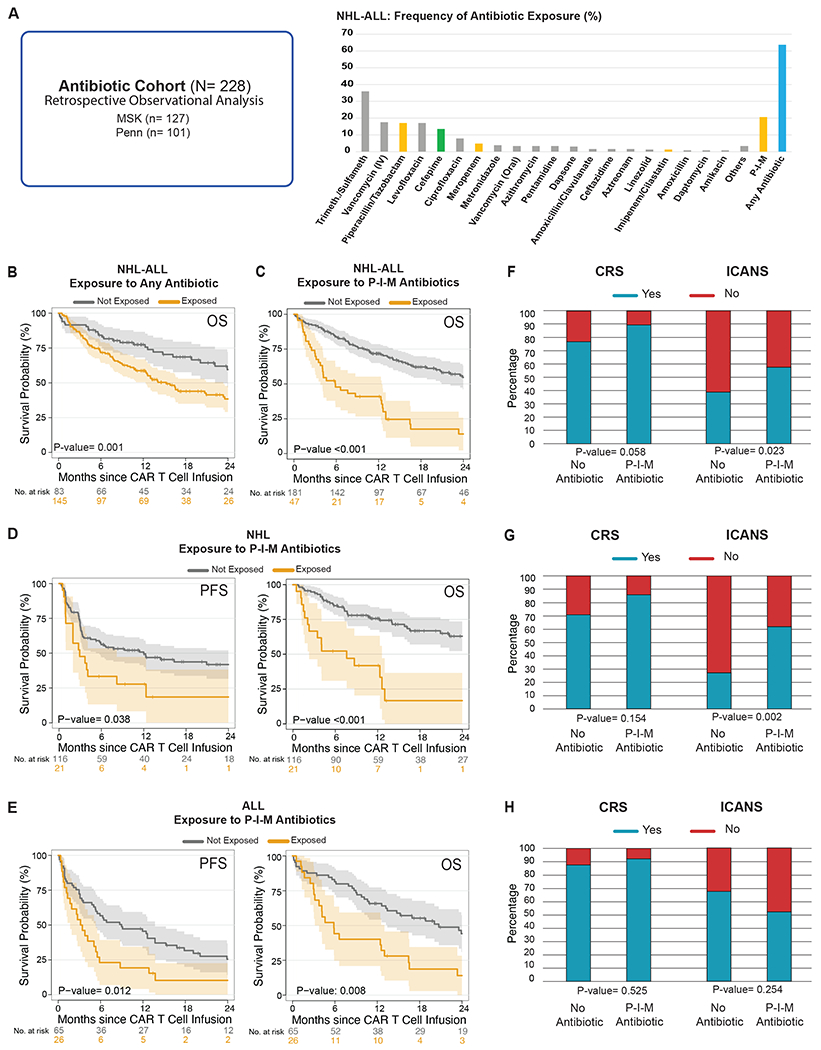
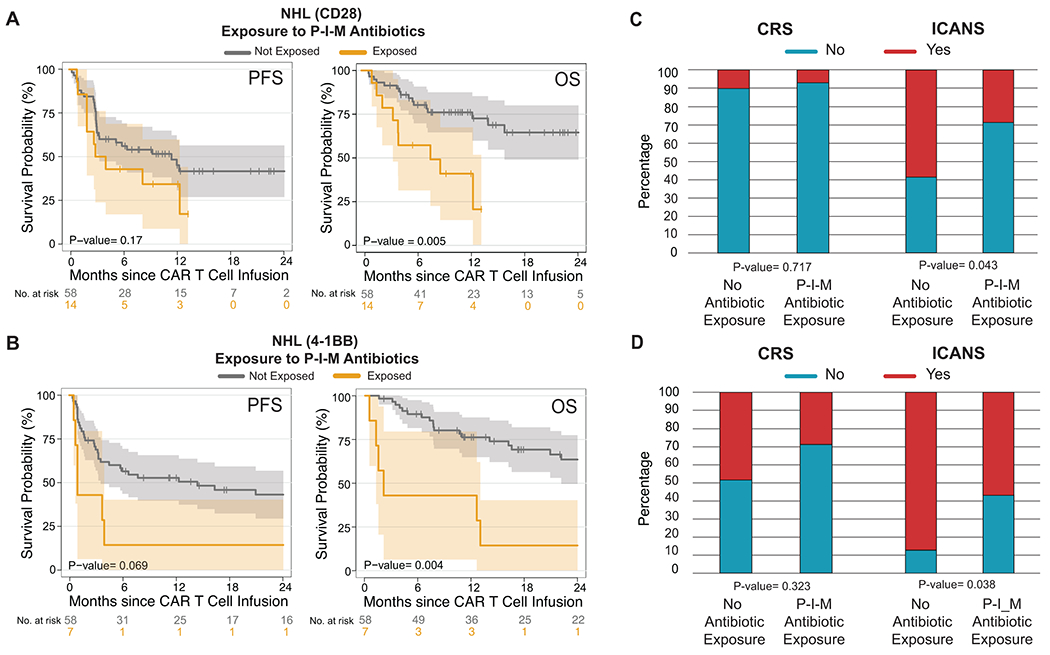
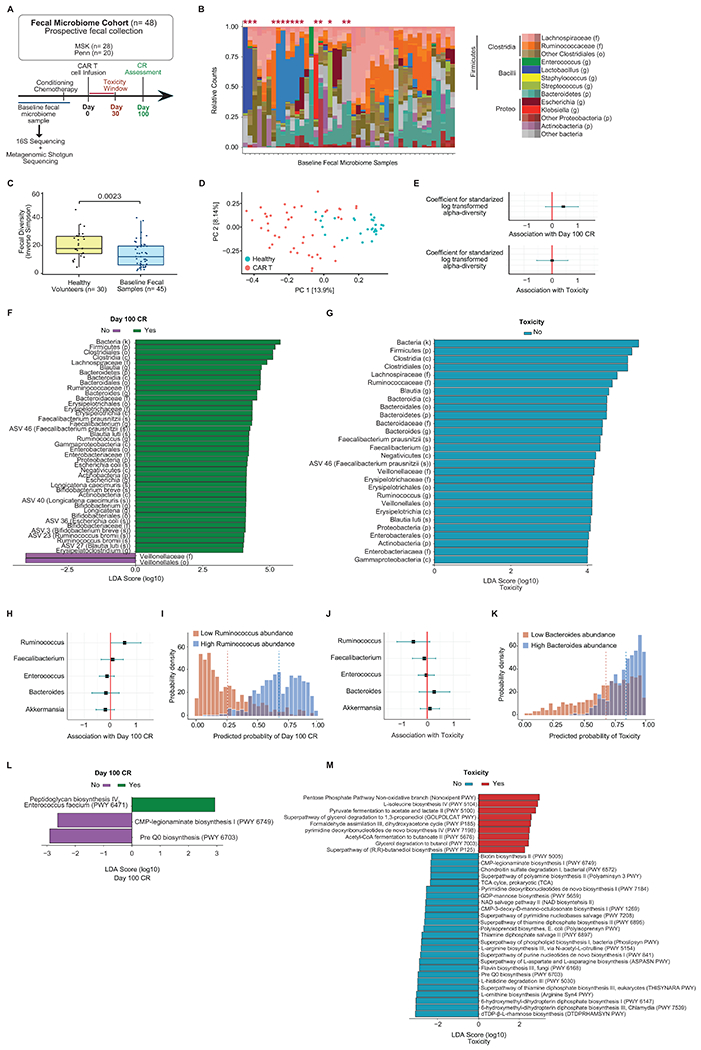
Anti-CD19 chimeric antigen receptor (CAR) T cell therapy has led to unprecedented responses in patients with high-risk hematologic malignancies. However, up to 60% of patients still experience disease relapse and up to 80% of patients experience CAR-mediated toxicities, such as cytokine release syndrome or immune effector cell-associated neurotoxicity syndrome. We investigated the role of the intestinal microbiome on these outcomes in a multicenter study of patients with B cell lymphoma and leukemia. We found in a retrospective cohort (n = 228) that exposure to antibiotics, in particular piperacillin/tazobactam, meropenem and imipenem/cilastatin (P-I-M), in the 4 weeks before therapy was associated with worse survival and increased neurotoxicity. In stool samples from a prospective cohort of CAR T cell recipients (n = 48), the fecal microbiome was altered at baseline compared to healthy controls. Stool sample profiling by 16S ribosomal RNA and metagenomic shotgun sequencing revealed that clinical outcomes were associated with differences in specific bacterial taxa and metabolic pathways. Through both untargeted and hypothesis-driven analysis of 16S sequencing data, we identified species within the class Clostridia that were associated with day 100 complete response. We concluded that changes in the intestinal microbiome are associated with clinical outcomes after anti-CD19 CAR T cell therapy in patients with B cell malignancies.


Figures

Extended Data Fig. 1
Extended Data Fig. 1. Impact of antibiotic exposure in patients with hematologic malignancies treated with anti-CD19 CAR T cell therapy according to institution
(A) Frequency of antibiotic exposure in the four weeks prior to CD19 CAR T cell infusion in patients with NHL and ALL treated at MSK (upper panel, n= 127) and Penn (bottom panel, n= 101). Purple denotes patients with ALL, while orange denotes patients with NHL. (B and C) Kaplan-Meier curves of overall survival (OS) by log-rank test according to the exposure to P-I-M antibiotics within 4 weeks before CD19 CAR T cell infusion in patients with ALL and NHL treated at MSK (B, n= 127) and Penn (C, n= 101). The dark gray line is estimated Kaplan-Meier survival probability for patients not exposed to P-I-M antibiotics, while the dark yellow line is the estimated probability for patients exposed to P-I-M antibiotics. The shading is the estimated pointwise 95% confidence interval, and the tick marks indicate censored events. Abbreviations: Trimeth./Sulfameth.: trimethoprim/sulfamethoxazole; IV: intravenous; NHL: non-Hodgkin lymphoma; ALL: acute lymphoblastic leukemia; MSK: Memorial Sloan Kettering Cancer Center; Penn: University of Pennsylvania; P-I-M: exposure to either piperacillin/tazobactam, imipenem/cilastatin or meropenem within the 4 weeks before CD19 CAR T cell infusion; Not exposed: patients exposed to non-P-I-M plus patients who did not receive any antibiotics; IV: intravenous; p: p-value
Extended Data Fig. 2
Extended Data Fig. 2. Impact of any antibiotic exposure in patients with non-Hodgkin lymphoma treated with anti-CD19 CAR T cell therapy
(A and B) Kaplan-Meier (A) progression-free (PFS) and (B) overall survival (OS) curves by log-rank test in NHL populations according to exposure to any antibiotic within 4 weeks before CD19 CAR T cell infusion (n= 137). The dark gray line is the estimated Kaplan-Meier survival estimates for patients not exposed to any antibiotic treatment, while the dark yellow line is the estimated probability for patients exposed to any antibiotic treatment. The shading indicates the pointwise 95% confidence interval, and the tick marks indicate censored events. (C) Histograms of the frequencies of any grade CRS and ICANS by two-sided Wilcoxon rank-sum test according to the exposure to any antibiotic within the 4 weeks before CD19 CAR T cell infusion in patients with NHL (n= 137). Blue indicates the absence of CRS or ICANS of any grade, while red indicates the presence of CRS or ICANS of any grade. Abbreviations: NHL: non-Hodgkin lymphoma; p: p-value; CRS: cytokine releasing syndrome; ICANS: immune effector cell-associated neurotoxicity
Extended Data Fig. 3
Extended Data Fig. 3. Survival analysis comparison of different antibiotics exposure on non-Hodgkin lymphoma patients treated with CD19 CAR T cells
(A and B) Kaplan-Meier curves of (A) progression-free survival (PFS) and (B) overall survival (OS) by log-rank test. Data shows the combined NHL population (n= 137) treated with different antibiotics in the 4 weeks before CD19 CAR T cell infusion. The dark gray line is the estimated Kaplan-Meier survival probability for patients not exposed to P-I-M antibiotics or cefepime (n= 107), the dark yellow line is the estimated probability for patients exposed to P-I-M antibiotics (n= 21), and the dark green line is the estimated probability for patients not exposed to P-I-M antibiotics and exposed to cefepime (n=9). The shading is the estimated pointwise 95% confidence interval, and the tick marks indicate censored events. P values are shown (log-rank test). Abbreviations: NHL: non-Hodgkin lymphoma; P-I-M: exposure to either piperacillin/tazobactam, imipenem/cilastatin or meropenem within the 4 weeks before CD19 CAR T cell infusion; No P-I-M antibiotic exposure: patients exposed to non-P-I-M plus patients who did not receive any antibiotics within 4 weeks before CD19 CAR T cell infusion; p: p-value
Extended Data Fig. 4
Extended Data Fig. 4. Survival analysis comparison of piperacillin/tazobactam compared to cefepime exposure in non-Hodgkin lymphoma patients treated with CD19 CAR T cells
(A and B) Kaplan-Meier curves of (A) progression-free survival (PFS) and (B) overall survival (OS) by log-rank test. Data shows patients from the combined NHL population treated with piperacillin/tazobactam or cefepime in the 4 weeks before CD19 CAR T cell infusion. The dark blue line is the estimated Kaplan-Meier survival probability for patients exposed to piperacillin/tazobactam (n= 18) and the dark green line is the estimated probability for patients exposed to cefepime (n= 12). The shading is the estimated pointwise 95% confidence interval, and the tick marks indicate censored events. P values are shown (log-rank test). P values are shown (log-rank analysis). The p-values are not stratified by Center. Abbreviations: NHL: non-Hodgkin lymphoma; p: p-value
Extended Data Fig. 5
Extended Data Fig. 5. Survival analysis comparison of P-I-M versus non-P-I-M exposure on non-Hodgkin lymphoma patients treated with CD19 CAR T cells
(A and B) Kaplan-Meier curves of (A) progression-free survival (PFS) and (B) overall survival (OS) by log-rank test. Data shows patients from the combined NHL population treated with P-I-M or non-P-I-M antibiotics in the 4 weeks before CD19 CAR T cell infusion. Patients who did not receive any antibiotic in the 30 days prior to CAR T cell infusion are excluded from this analysis. The dark gray line is the estimated Kaplan-Meier survival probability for patients exposed to P-I-M (n= 21) and the dark yellow line is the estimated probability for patients exposed to non-P-I-M (n= 60). The shading is the estimated pointwise 95% confidence interval, and the tick marks indicate censored events. P values are shown (log-rank test). The p-values are not stratified by Center. Abbreviations: NHL: non-Hodgkin lymphoma; p: p-value
Extended Data Fig. 6
Extended Data Fig. 6. Timing of fecal sample collection relative to the start of conditioning chemotherapy and CD19 CAR T cell infusion
Forty-eight patients were evaluated in the fecal microbiome cohort. Of the forty-eight patients, the fecal samples of fourteen were collected before the start of conditioning chemotherapy, whereas thirty-four fecal samples were collected after the start of conditioning chemotherapy. All the baseline fecal microbiome samples were collected prior to CD19 CAR T cell infusion. The red square denotes the start of conditioning chemotherapy. The black circle denotes the collection of the baseline fecal sample prior to CAR T cell infusion. Day 0 denotes the day of CD19 CAR T cell infusion.
Extended Data Fig. 7
Extended Data Fig. 7. Flow diagram of the fecal microbiome sample collection
Fifty-one unique patients were collected upon informed consent. Of the fifty-one patients, one patient did not have sufficient fecal material for sequencing and two patients failed during the amplification or quality control step. Following these exclusions, there were forty-eight patients in the fecal microbiome cohort. Of these patients, we successfully amplified and sequenced the 16S ribosomal RNA gene with ≥ 200 reads per sample from forty-five patients. Forty-five patients passed quality control measures for metagenomic shotgun sequencing. There were three non-overlapping patients in the 16S and shotgun sequencing cohorts. Hence, there were 48 unique patients in the fecal microbiome cohort.
Extended Data Fig. 8
Extended Data Fig. 8. The association of intestinal microbiota and clinical response in recipients of CD19 CAR T cells, including subset analysis institution
(A to E) All data reported in this figure is based on 16S rRNA gene sequencing data. (A) Inverse Simpson diversity index of the fecal microbiome in the baseline fecal samples by institution, MSK (n= 26) and Penn (n= 19), compared to healthy volunteers (n= 30) by two-sided Wilcoxon rank-sum test. The middle line is the median, the box limits represent the upper and lower quartiles, the whiskers note 1.5x the interquartile range, and the dots represent the individual data points. (B to C) Beta-diversity was calculated using the Bray-Curtis dissimilarity between a reference point defined by the average of healthy volunteers and each of 30 samples from healthy volunteers. Healthy volunteers were compared to the 45 baseline patient samples (B) and by institution (MSK n= 26; Penn n= 19) (C) by two-sided Wilcoxon rank-sum test. This healthy volunteer cohort has been investigated in a prior study. The middle line is the median, the box limits represent the upper and lower quartiles, the whiskers note 1.5x the interquartile range, and the dots represent the individual data points. (D to E) Patient samples with higher (one standard deviation above the mean) (red) or lower (one standard deviation below the mean) (blue) Inverse Simpson diversity index. The coefficients for the predicted probability of (C) Day 100 CR and (D) toxicity by Inverse Simpson diversity index. The coefficients correspond to the Bayesian models for Day 100 CR and toxicity, respectively, in Figure 3E.
Extended Data Fig. 9
Extended Data Fig. 9. Principal Coordinates Analysis (PCoA) visualization of beta-diversity of fecal samples of CAR T cell patients and healthy volunteers
All data reported in this figure is based on 16S rRNA gene sequencing data. Fecal microbiome composition of the CAR T cell patients (n= 45) and healthy volunteers (n= 30) was displayed in a PCoA. Composition was assessed using beta-diversity calculated with Bray-Curtis dissimilarity. Data visualized at the genus level. Red dots indicate CAR T cells patients and green dots indicate healthy volunteers.
Extended Data Fig. 10
Extended Data Fig. 10. Boxplots of the relative abundance of selected taxa from LEfSe of Day 100 CR
All data reported in this figure is based on 16S rRNA gene sequencing data from patients (n= 45). The relative abundance of Bacteroides, Bifidobacterium, Blautia, Faecalibacterium, Longicatena, and Ruminococcus are presented. Data is categorized by patients who did not achieve a Day 100 CR (No), and patients who achieved a Day 100 CR (Yes). Dots indicate relative abundance of the baseline fecal sample from a CAR T cell patient. Two-sided Wilcoxon rank-sum test was used to calculate the p-values, and the p-values were adjusted for multiple hypothesis testing. The middle line is the median, the box limits represent the upper and lower quartiles, the whiskers note 1.5x the interquartile range, and the dots represent the individual data points.
Figure 1.
Figure 1.. Impact of antibiotic exposure in patients with hematologic malignancies treated with anti-CD19 CAR T cell therapy.
(A) The antibiotic cohort consists of CD19 CAR T cell recipients from MSK (n= 127) and Penn (n= 101) who were assessed in a retrospective observational study of antibiotic exposure (left panel) (N= 228). Frequency of antibiotic exposure in the four weeks prior to CAR T cell infusion in patients with NHL and ALL (right panel). (B) Kaplan-Meier overall survival curves in ALL and NHL populations according to exposure to any antibiotic within the 4 weeks before CD19 CAR T cell infusion (N= 228). (C, D, E) Kaplan-Meier curves of progression-free survival (PFS) and overall survival (OS) according to the exposure to P-I-M antibiotics the within 4 weeks before CD19 CAR T cell infusion in patients with ALL and NHL (only OS, N= 228), NHL (n= 137) and ALL (n= 91), respectively. (B to E) The dark gray line is the estimated Kaplan-Meier survival probability for patients not exposed to P-I-M antibiotics, while the dark yellow line is the estimated probability for patients exposed to P-I-M antibiotics. The shading is the estimated pointwise 95% confidence interval, and the tick marks indicate censored events. (F, G, H) Histograms of the frequencies of any grade CRS and ICANS by Wilcoxon rank-sum test according to exposure to P-I-M antibiotics within 4 weeks before CD19 CAR T cell infusion in patients with ALL and NHL (N= 228), NHL (n= 137) and ALL (n= 91), respectively. Blue indicates the absence of CRS or ICANS of any grade, while red indicates the presence of CRS or ICANS of any grade. Abbreviations: Trimeth./Sulfameth.: trimethoprim/sulfamethoxazole; IV: intravenous; NHL: non-Hodgkin lymphoma; Not exposed: patients exposed to non-P-I-M plus patients who did not receive any antibiotics within the 4 weeks before CD19 CAR T cell infusion; ALL: acute lymphoblastic leukemia; p: p-value; P-I-M: exposure to either piperacillin/tazobactam, imipenem/cilastatin or meropenem within the 4 weeks before CD19 CAR T cell infusion; CRS: cytokine releasing syndrome; ICANS: immune effector cell-associated neurotoxicity
Figure 2.
Figure 2.. Impact of P-I-M antibiotics exposure in patients with non-Hodgkin lymphoma treated with anti-CD19 CAR T cell according to CAR-costimulatory domain.
(A and B) Kaplan-Meier curves of (A) progression-free survival (PFS) and (B) overall survival (OS) by log-rank test according to the exposure to P-I-M antibiotics within 4 weeks before CD19 CAR T cell infusion in a NHL population treated with CD19 CAR T cells with a CD28 costimulatory domain (A; n= 72) and CD19 CAR T cells with a 4-1BB costimulatory domain (B; n= 65). The dark gray line is the estimated Kaplan-Meier survival probability for patients not exposed to P-I-M antibiotics, while the dark yellow line is the estimated probability for patients exposed to P-I-M antibiotics. The shading is the estimated pointwise 95% confidence interval, and the tick marks indicate censored events. P values are shown (log-rank test). (C and D) Histograms show the frequencies of CRS and ICANS by Wilcoxon rank-sum test according to exposure to P-I-M antibiotics within the 4 weeks before CD19 CAR T cell infusion in patients with NHL who received (C) a product with a CD28 costimulatory domain and patients with NHL who received (D) a product with a 4-1BB costimulatory domain. Blue indicates the absence of CRS or ICANS of any grade, while red indicates the presence of CRS or ICANS of any grade. Abbreviations: NHL: non-Hodgkin lymphoma; P-I-M: exposure to either piperacillin/tazobactam, imipenem/cilastatin or meropenem within the 4 weeks before CD19 CAR T cell infusion; No P-I-M antibiotic exposure: patients exposed to non-P-I-M plus patients who did not receive any antibiotics within 4 weeks before CD19 CAR T cell infusion; PFS: progression-free survival; OS: overall survival: p: p-value; CRS: cytokine releasing syndrome; ICANS: immune effector cell-associated neurotoxicity
Figure 3.
Figure 3.. The association of baseline fecal microbiota with clinical response in recipients of CD19 CAR T cells.
(A to J) Data presented in these panels are based on 16S rRNA gene sequencing. (A) Schema of fecal sample collection and sequencing analyses. (B) Phylogenetic composition of fecal samples (n= 45). Red asterisks denote samples with domination. (C) Inverse Simpson diversity index of fecal samples from patients (n= 45) and healthy volunteers (n= 30) by two-sided Wilcoxon rank-sum test. This healthy volunteer cohort was investigated in a prior study. The middle line is the median, the box limits represent the upper and lower quartiles, the whiskers note 1.5x the interquartile range, and the dots represent the individual data points. (D) Composition of CAR T cell patients and healthy volunteers at the ASV level in PCoA. (E) Estimated coefficient for Inverse Simpson diversity index and Day 100 CR and toxicity using Bayesian logistic regression. (F, G) Linear discriminant analysis (LDA) scores for differentially abundant taxa of Day 100 CR (green) and no Day 100 CR (purple) as well as no toxicity (blue). LDA score > 4. (H, J) Estimated coefficients for log10 relative abundance of bacterial taxa at the genus level for Day 100 CR and toxicity. (I, K) Patient samples with highest 10% (red) or lowest 10% (blue) relative abundance of genera. Predicted probability of (H) Day 100 CR by Ruminococcus abundance and (J) predicted probability of toxicity by Bacteroides abundance. (E, H, J) Error bars represent the 95% credibility interval, and the dots represent the point estimate. (L, M) Data presented in these panels are based on metagenomic shotgun sequencing. LDA score for differentially abundant of Day 100 CR (green) and no Day 100 CR (purple) as well as toxicity (red) and no toxicity (blue). LDA score > 2. (F, G, L, M) Length indicates effect size associated with a taxon. Abbreviations: LDA: Linear discriminant analysis; ASV: amplicon sequence variant; NHL: non-Hodgkin lymphoma; P-I-M: exposure to either piperacillin/tazobactam, imipenem/cilastatin or meropenem within the 4 weeks before CD19 CAR T cell infusion; PFS: progression-free survival; OS: overall survival: p: p-value

Comment in

References

    1. Park JH, et al. Long-Term Follow-up of CD19 CAR Therapy in Acute Lymphoblastic Leukemia. N Engl J Med 378, 449–459 (2018). - PMC - PubMed
    1. Lee DW, et al. T cells expressing CD19 chimeric antigen receptors for acute lymphoblastic leukaemia in children and young adults: a phase 1 dose-escalation trial. Lancet 385, 517–528 (2015). - PMC - PubMed
    1. Davila ML, et al. Efficacy and toxicity management of 19-28z CAR T cell therapy in B cell acute lymphoblastic leukemia. Sci Transl Med 6, 224ra225 (2014). - PMC - PubMed
    1. Maude SL, et al. Tisagenlecleucel in Children and Young Adults with B-Cell Lymphoblastic Leukemia. N Engl J Med 378, 439–448 (2018). - PMC - PubMed
    1. Neelapu SS, et al. Axicabtagene Ciloleucel CAR T-Cell Therapy in Refractory Large B-Cell Lymphoma. N Engl J Med 377, 2531–2544 (2017). - PMC - PubMed

Methods-only References

    1. Schuster SJ, et al. Chimeric Antigen Receptor T Cells in Refractory B-Cell Lymphomas. N Engl J Med 377, 2545–2554 (2017). - PMC - PubMed
    1. Frey NV, et al. Optimizing Chimeric Antigen Receptor T-Cell Therapy for Adults With Acute Lymphoblastic Leukemia. J Clin Oncol 38, 415–422 (2020). - PMC - PubMed
    1. Locke FL, et al. Long-term safety and activity of axicabtagene ciloleucel in refractory large B-cell lymphoma (ZUMA-1): a single-arm, multicentre, phase 1-2 trial. Lancet Oncol 20, 31–42 (2019). - PMC - PubMed
    1. Porter D, Frey N, Wood PA, Weng Y & Grupp SA Grading of cytokine release syndrome associated with the CAR T cell therapy tisagenlecleucel. J Hematol Oncol 11, 35 (2018). - PMC - PubMed
    1. Dethlefsen L, Huse S, Sogin ML & Relman DA The pervasive effects of an antibiotic on the human gut microbiota, as revealed by deep 16S rRNA sequencing. PLoS Biol 6, e280 (2008). - PMC - PubMed

Publication types