. 2022 Jun;28(6):1314-1324.
doi: 10.1038/s41591-022-01750-1. Epub 2022 Mar 14.

COVID-19 and resilience of healthcare systems in ten countries

Affiliations

COVID-19 and resilience of healthcare systems in ten countries

Catherine Arsenault et al. Nat Med. 2022 Jun.

Abstract

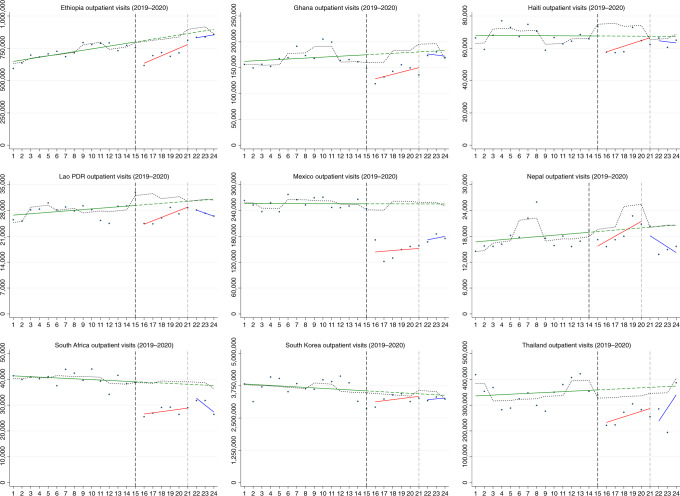
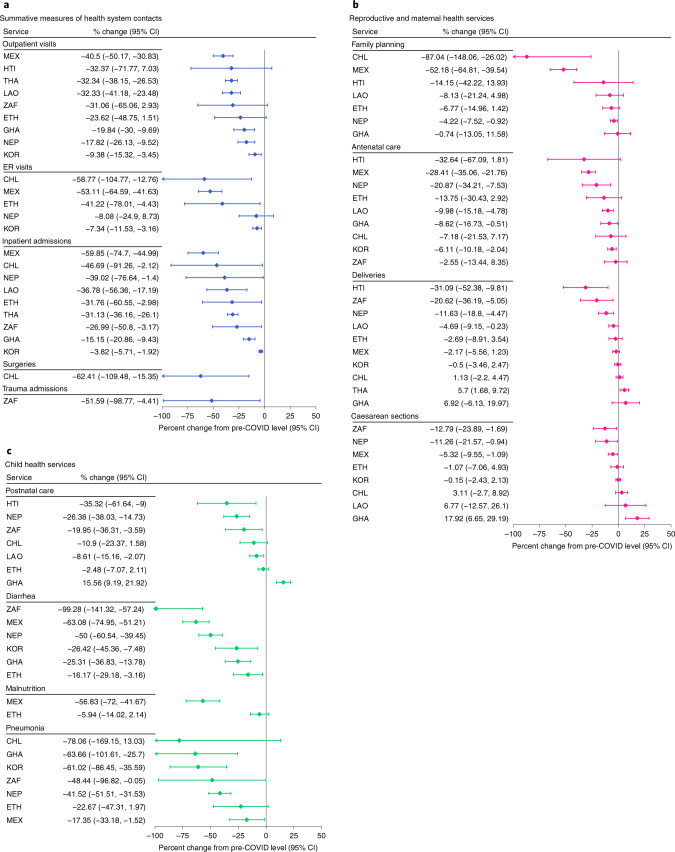
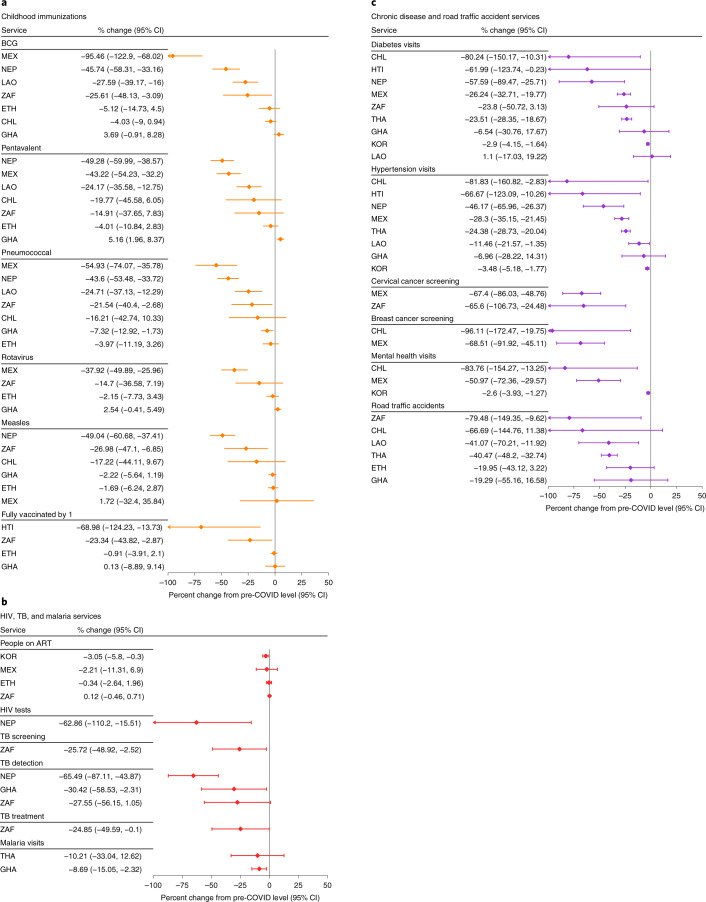
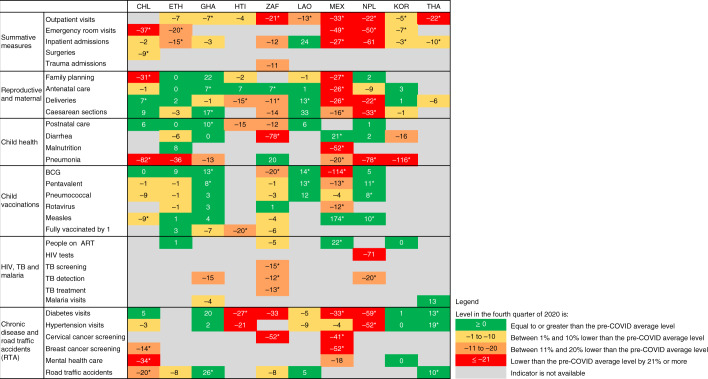
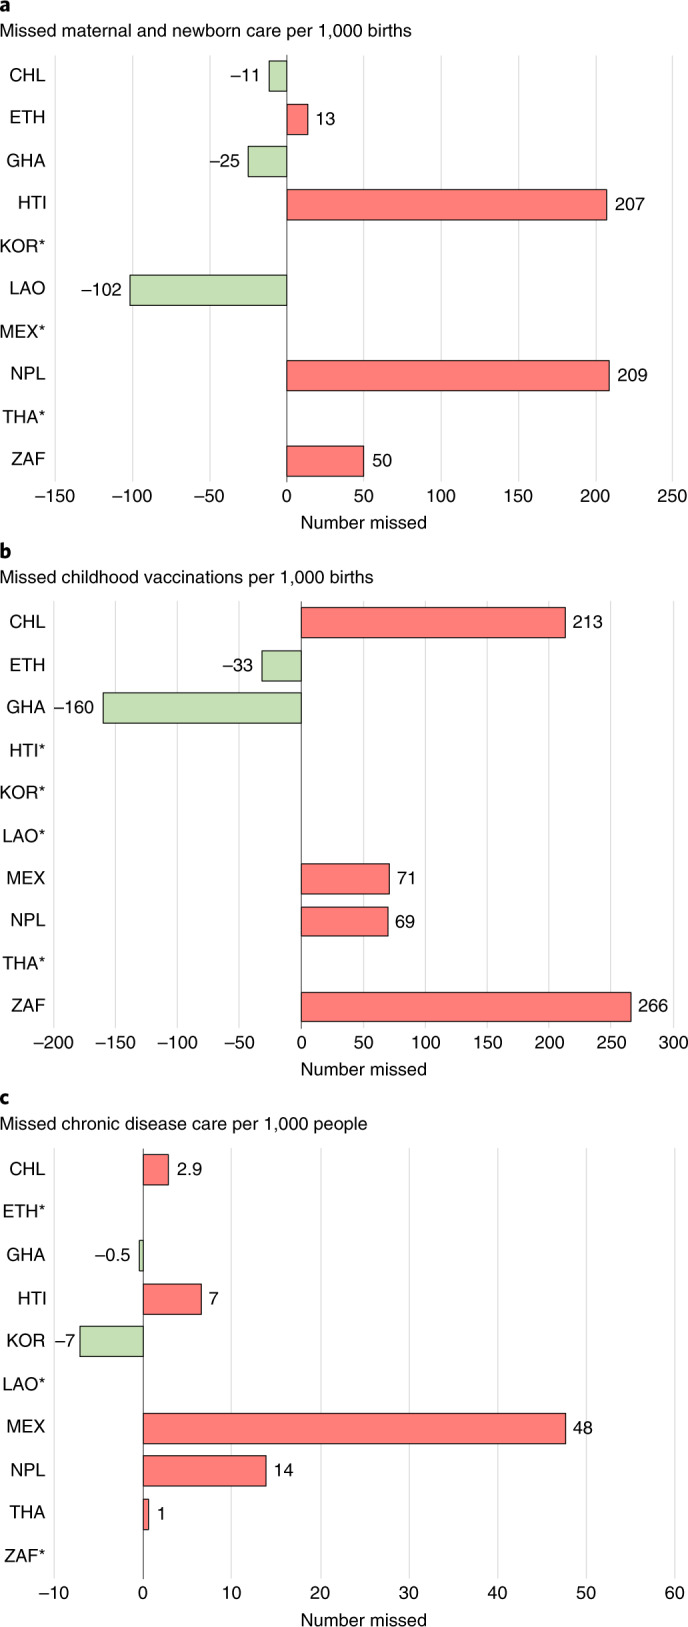
Declines in health service use during the Coronavirus Disease 2019 (COVID-19) pandemic could have important effects on population health. In this study, we used an interrupted time series design to assess the immediate effect of the pandemic on 31 health services in two low-income (Ethiopia and Haiti), six middle-income (Ghana, Lao People's Democratic Republic, Mexico, Nepal, South Africa and Thailand) and high-income (Chile and South Korea) countries. Despite efforts to maintain health services, disruptions of varying magnitude and duration were found in every country, with no clear patterns by country income group or pandemic intensity. Disruptions in health services often preceded COVID-19 waves. Cancer screenings, TB screening and detection and HIV testing were most affected (26-96% declines). Total outpatient visits declined by 9-40% at national levels and remained lower than predicted by the end of 2020. Maternal health services were disrupted in approximately half of the countries, with declines ranging from 5% to 33%. Child vaccinations were disrupted for shorter periods, but we estimate that catch-up campaigns might not have reached all children missed. By contrast, provision of antiretrovirals for HIV was not affected. By the end of 2020, substantial disruptions remained in half of the countries. Preliminary data for 2021 indicate that disruptions likely persisted. Although a portion of the declines observed might result from decreased needs during lockdowns (from fewer infectious illnesses or injuries), a larger share likely reflects a shortfall of health system resilience. Countries must plan to compensate for missed healthcare during the current pandemic and invest in strategies for better health system resilience for future emergencies.


Conflict of interest statement

The authors declare no competing interests.

Figures

Fig. 1
Fig. 1. Trends in total outpatient visits in nine countries from January 2019 to December 2020.
The blue dots are the average monthly number of outpatient visits per sub-national unit (observed). The x axes are months 1–24, representing January 2019 to December 2020, except in Nepal where they correspond to 15 January 2019 to 13 January 2021. The y axes are the total services provided. The vertical black line shows the beginning of the COVID-19 pandemic, and the vertical gray line shows the beginning of the potential resumption period (last quarter of 2020). The green trend line is the predicted trend based on pre-COVID-19 months. The black dotted trend line is the temporal trend adjusted for seasonality. The red line is the temporal trend in the 6 months after the pandemic was declared (April to September 2020). The blue line is the temporal trend in the last quarter of 2020. Trends extended to June 2021 are available for seven countries in Extended Data Fig. 1. In South Africa, outpatient visits are reported only by hospitals and, thus, represent only a fraction of service provision. In Chile, outpatient visits were not available.
Fig. 2
Fig. 2. Immediate effect of the pandemic on summative measures and reproductive, maternal and child health services.
Effect estimates are expressed as the percent change in service level after the declaration of the pandemic compared to the average level pre-COVID-19. The percent change from the average pre-COVID-19 is calculated by dividing the coefficient for the COVID-19 period (β2) from regression models to the monthly average in the 15 months pre-COVID-19. Lower and upper limits of the 95% confidence interval (CI) are also divided by the monthly average pre-COVID-19 to be expressed as percentages. Regression coefficients and CIs are in Supplementary Tables 10–19. Countries are represented with International Organization for Standardization country codes.
Fig. 3
Fig. 3. Immediate effect of the pandemic on childhood immunizations and services for HIV, TB, malaria, chronic diseases and road traffic accidents.
Effect estimates are expressed as the percent change in service level after the declaration of the pandemic compared to the average level pre-COVID-19. The percent change from the average pre-COVID-19 is calculated by dividing the coefficient for the COVID-19 period (β2) from regression models to the monthly average in the 15 months pre-COVID-19. Lower and upper limits of the 95% confidence interval (CI) are also divided by the monthly average pre-COVID-19 to be expressed as percentages. Regression coefficients and CIs are in Supplementary Tables 10–19. Childhood immunizations are for the number of children who received the final dose for the pentavalent vaccine, the pneumococcal conjugate vaccine and the rotavirus vaccine. Measles vaccination is for the number of children who received the first dose in Ethiopia and Nepal, the second dose in Mexico and South Africa and both first and second doses in Ghana. Full vaccination by age 1 is according to the national immunization schedule. Countries are represented with International Organization for Standardization country codes.
Fig. 4
Fig. 4. Resumption in services by the fourth quarter of 2020.
Estimates in the cells represent the remaining level change compared to the average level pre-COVID-19 and are expressed as the percent difference from the average pre-COVID-19. The percent difference in quarter 4 of 2020 to the average pre-COVID-19 is calculated by dividing the coefficient for the quarter 4 period (β4) from regression models to the monthly average in the 15 months pre-COVID-19. Asterisks (*) indicate statistical significance (P < 0.05). Countries are represented with International Organization for Standardization country codes.
Fig. 5
Fig. 5. Estimated amount of missed healthcare from April to December 2020.
Asterisks (*) indicate that countries were excluded if missing one or more indicator. Missed maternal and newborn care is the sum of antenatal care, delivery and postnatal care. Missed childhood vaccinations is the sum of BCG, pentavalent, pneumococcal and measles vaccinations. Missed chronic disease care is the sum of hypertension and diabetes visits. Negative numbers indicate that more consultations took place than expected according to pre-COVID-19 trend. Annual births are estimated by multiplying the crude birth rate per 1,000 by the population according to most recent population estimates. Countries are represented with International Organization for Standardization country codes.
Extended Data Fig. 1
Extended Data Fig. 1. Trends in total outpatient visits in seven countries from January 2019 to June 2021.
The dots are the average monthly number of outpatient visits per sub-national unit (observed) in 2019-2020 (blue) and 2021 (orange). The x-axis is January 2019 to May 2021 in Korea and January 2019 to June 2021 in Ethiopia, Laos, Mexico, Thailand, and South Africa. In Nepal, the last month ends on July 15, 2021, due to a different calendar. The y-axes are the total services provided. The vertical black line shows the beginning of the COVID-19 pandemic and the vertical grey line, the beginning of the potential resumption period (last quarter of 2020). The green trend line is the predicted trend based on pre-COVID-19 months. The black dotted line is the temporal trend adjusted for seasonality. The red line is the temporal trend in the 6 months after the pandemic was declared (April to September 2020). The orange dotted line is the trend from October 2020 to May or June 2021. In Ghana and Haiti, these data were only available until December 2020 and are presented in the main text. In South Africa outpatient visits are only reported by hospitals and thus only represent a fraction of service provision. In Chile, outpatient visits were not available.
Extended Data Fig. 2
Extended Data Fig. 2. Trends in facility-based deliveries in ten countries from January 2019 to June 2021.
The dots are the average monthly number of deliveries per sub-national unit (observed) in 2019-2020 (blue) and 2021 (orange). The x-axis is January 2019 to December 2020 in Chile, Ghana and Haiti, January 2019 to May 2021 in Korea, and January 2019 to June 2021 in Ethiopia, Laos, Mexico, South Africa, and Thailand. In Nepal, the last month ends on July 15, 2021, due to a different calendar. The y-axes are the total services provided. The vertical black line shows the beginning of the COVID-19 pandemic and the vertical grey line, the beginning of the potential resumption period (starting October 2020). The green trend line is the predicted trend based on pre-COVID-19 months. The black dotted line is the temporal trend adjusted for seasonality. The red line is the temporal trend in the 6 months after the pandemic was declared (April to September 2020). The blue line is the temporal trend in the last quarter of 2020 (in countries where 2021 data were not available). The orange dotted line is the trend from October 2020 to May or June 2021.
Extended Data Fig. 3
Extended Data Fig. 3. Trends in inpatient admissions in nine countries from January 2019 to June 2021.
The dots are the average monthly number of inpatient admissions per sub-national unit (observed) in 2019-2020 (blue) and 2021 (orange). The x-axis is January 2019 to December 2020 in Chile and Ghana, January 2019 to May 2021 in Korea and January 2019 to June 2021 in Ethiopia, Laos, Mexico, South Africa, and Thailand. In Nepal, the last month ends on July 15, 2021, due to a different calendar. The y-axes are the total services provided. The vertical black line shows the beginning of the COVID-19 pandemic and the vertical grey line, the beginning of the potential resumption period (starting October 2020). The green trend line is the predicted trend based on pre-COVID-19 months. The black dotted line is the temporal trend adjusted for seasonality. The red line is the temporal trend in the 6 months after the pandemic was declared (April to September 2020). The blue line is the temporal trend in the last quarter of 2020 (in countries where 2021 data were not available). The orange dotted line is the trend from October 2020 to May or June 2021.
Extended Data Fig. 4
Extended Data Fig. 4. Trends in pentavalent vaccinations in seven countries from January 2019 to June 2021.
The dots are the average monthly number of pentavalent vaccinations per sub-national unit (observed) in 2019-2020 (blue) and 2021 (orange). The x-axis is January 2019 to December 2020 in Chile and Ghana, and January 2019 to June 2021 in Ethiopia, Laos, Mexico and South Africa. In Nepal, the last month ends on July 15, 2021, due to a different calendar. The y-axes are the total services provided. The vertical black line shows the beginning of the COVID-19 pandemic and the vertical grey line, the beginning of the potential resumption period (starting October 2020). The green trend line is the predicted trend based on pre-COVID-19 months. The black dotted line is the temporal trend adjusted for seasonality. The red line is the temporal trend in the 6 months after the pandemic was declared (April to September 2020). The blue line is the temporal trend in the last quarter of 2020 (in countries where 2021 data were not available). The orange dotted line is the trend from October 2020 to May or June 2021.
Extended Data Fig. 5
Extended Data Fig. 5. Trends in visits for diabetes in nine countries from January 2019 to June 2021.
The dots are the average monthly number of diabetes visits per sub-national unit (observed) in 2019-2020 (blue) and 2021 (orange). The x-axis is January 2019 to December 2020 in Chile, Ghana and Haiti, January 2019 to May 2021 in Korea and January 2019 to June 2021 in Laos, Mexico, South Africa and Thailand. In Nepal, the last month ends on July 15, 2021, due to a different calendar. The y-axes are the total services provided. The vertical black line shows the beginning of the COVID-19 pandemic and the vertical grey line, the beginning of the potential resumption period (starting October 2020). The green trend line is the predicted trend based on pre-COVID-19 months. The black dotted line is the temporal trend adjusted for seasonality. The red line is the temporal trend in the 6 months after the pandemic was declared (April to September 2020). The blue line is the temporal trend in the last quarter of 2020 (in countries where 2021 data were not available). The orange dotted line is the trend from October 2020 to May or June 2021.
Extended Data Fig. 6
Extended Data Fig. 6. Scatter plots for the association between COVID-19 incidence, the stringency index and health service disruptions.
COVID-19 cases are from the Data Repository by the Center for Systems Science and Engineering (CSSE) at Johns Hopkins University. The stringency index was developed by the Oxford Government Response Tracker. The stringency index is a composite measure based on nine response indicators including school closures, workplace closures, cancellation of public events, restrictions on public gatherings, closures on public transport, stay-at-home requirements, public information campaigns, restrictions on internal movements and international travel controls, rescaled to a value from 0 to 100 (100 = strictest).

Comment in

References

    1. Haldane V, et al. Health systems resilience in managing the COVID-19 pandemic: lessons from 28 countries. Nat. Med. 2021;27:964–980. doi: 10.1038/s41591-021-01381-y. - DOI - PubMed
    1. Kruk ME, et al. High-quality health systems in the Sustainable Development Goals era: time for a revolution. Lancet Glob. Health. 2018;6:e1196–e1252. doi: 10.1016/S2214-109X(18)30386-3. - DOI - PMC - PubMed
    1. Kruk ME, Myers M, Varpilah ST, Dahn BT. What is a resilient health system? Lessons from Ebola. Lancet. 2015;385:1910–1912. doi: 10.1016/S0140-6736(15)60755-3. - DOI - PubMed
    1. Our World in Data. Statistics and Research: Coronavirus Pandemic (COVID-19), Country Profiles. https://ourworldindata.org/coronavirus#coronavirus-country-profiles2021 (2021).
    1. The Lancet Infectious Diseases. COVID-19 vaccine equity and booster doses. Lancet Infect. Dis. 2021;21:1193. doi: 10.1016/S1473-3099(21)00486-2. - DOI - PMC - PubMed

Publication types