. 2022 Apr;23(4):543-555.
doi: 10.1038/s41590-022-01163-9. Epub 2022 Mar 14.

Mechanisms of innate and adaptive immunity to the Pfizer-BioNTech BNT162b2 vaccine

Affiliations

Mechanisms of innate and adaptive immunity to the Pfizer-BioNTech BNT162b2 vaccine

Chunfeng Li et al. Nat Immunol. 2022 Apr.

Abstract

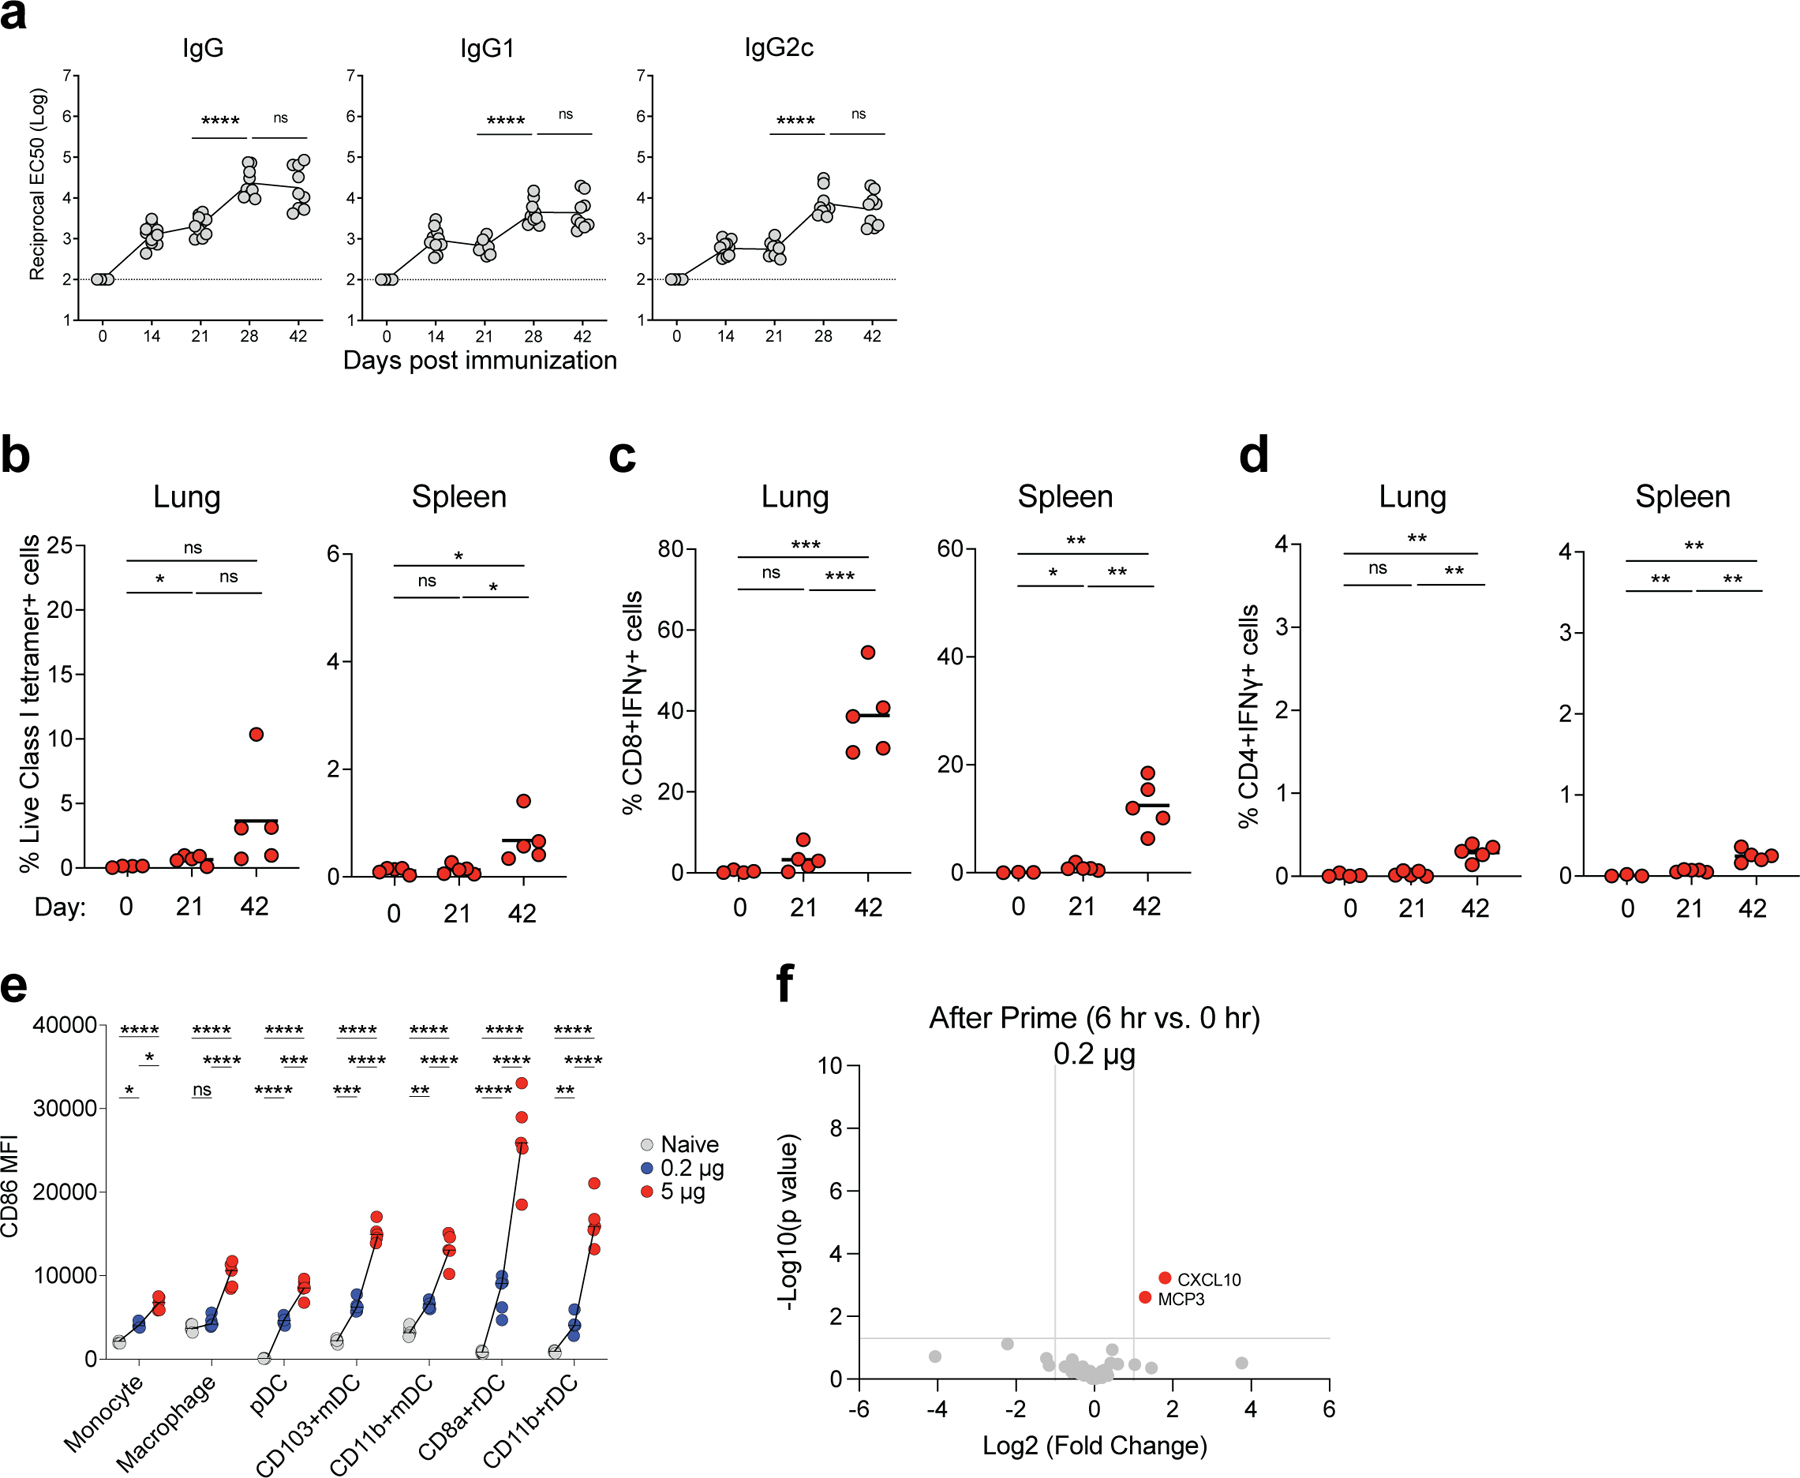
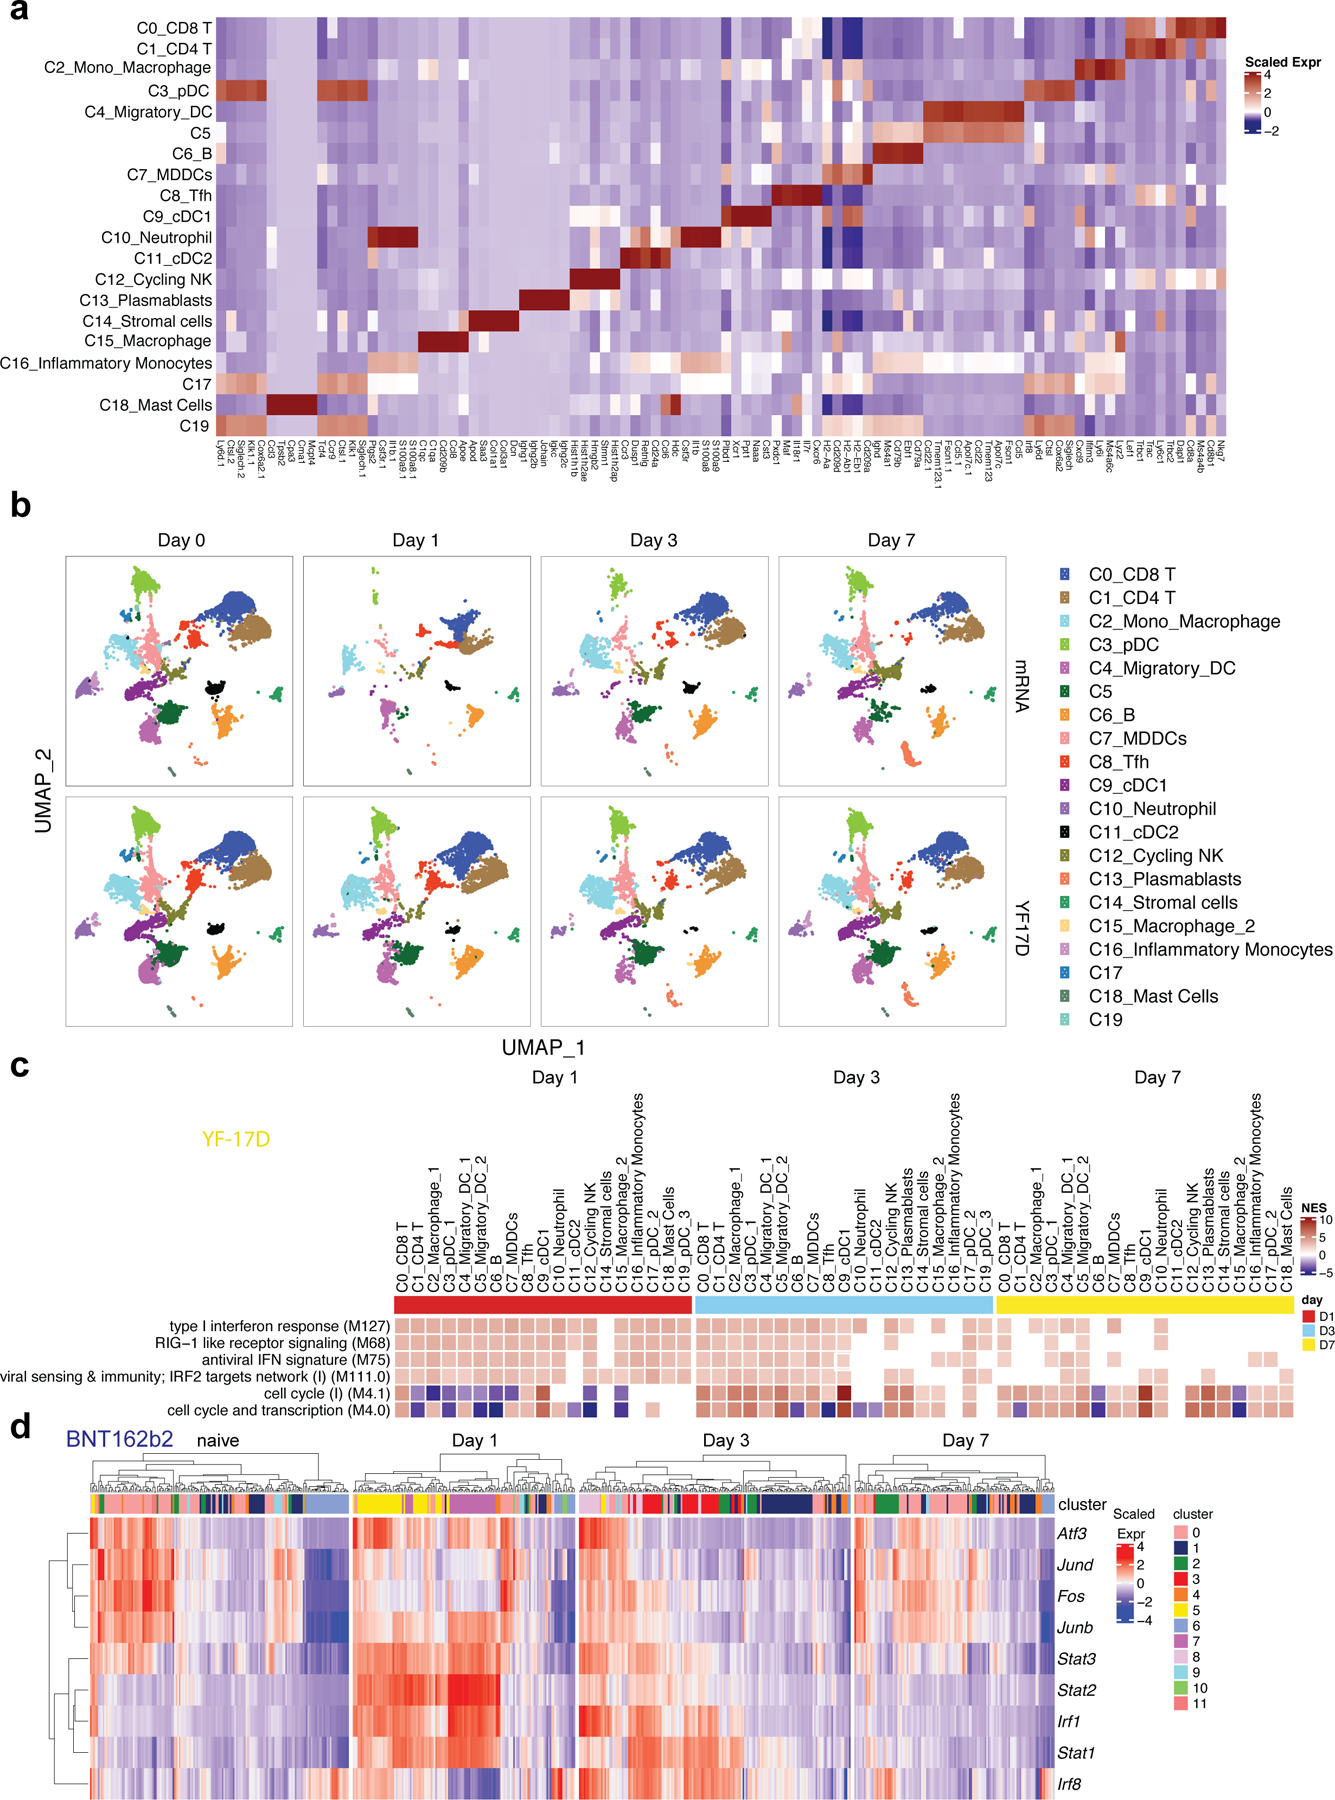
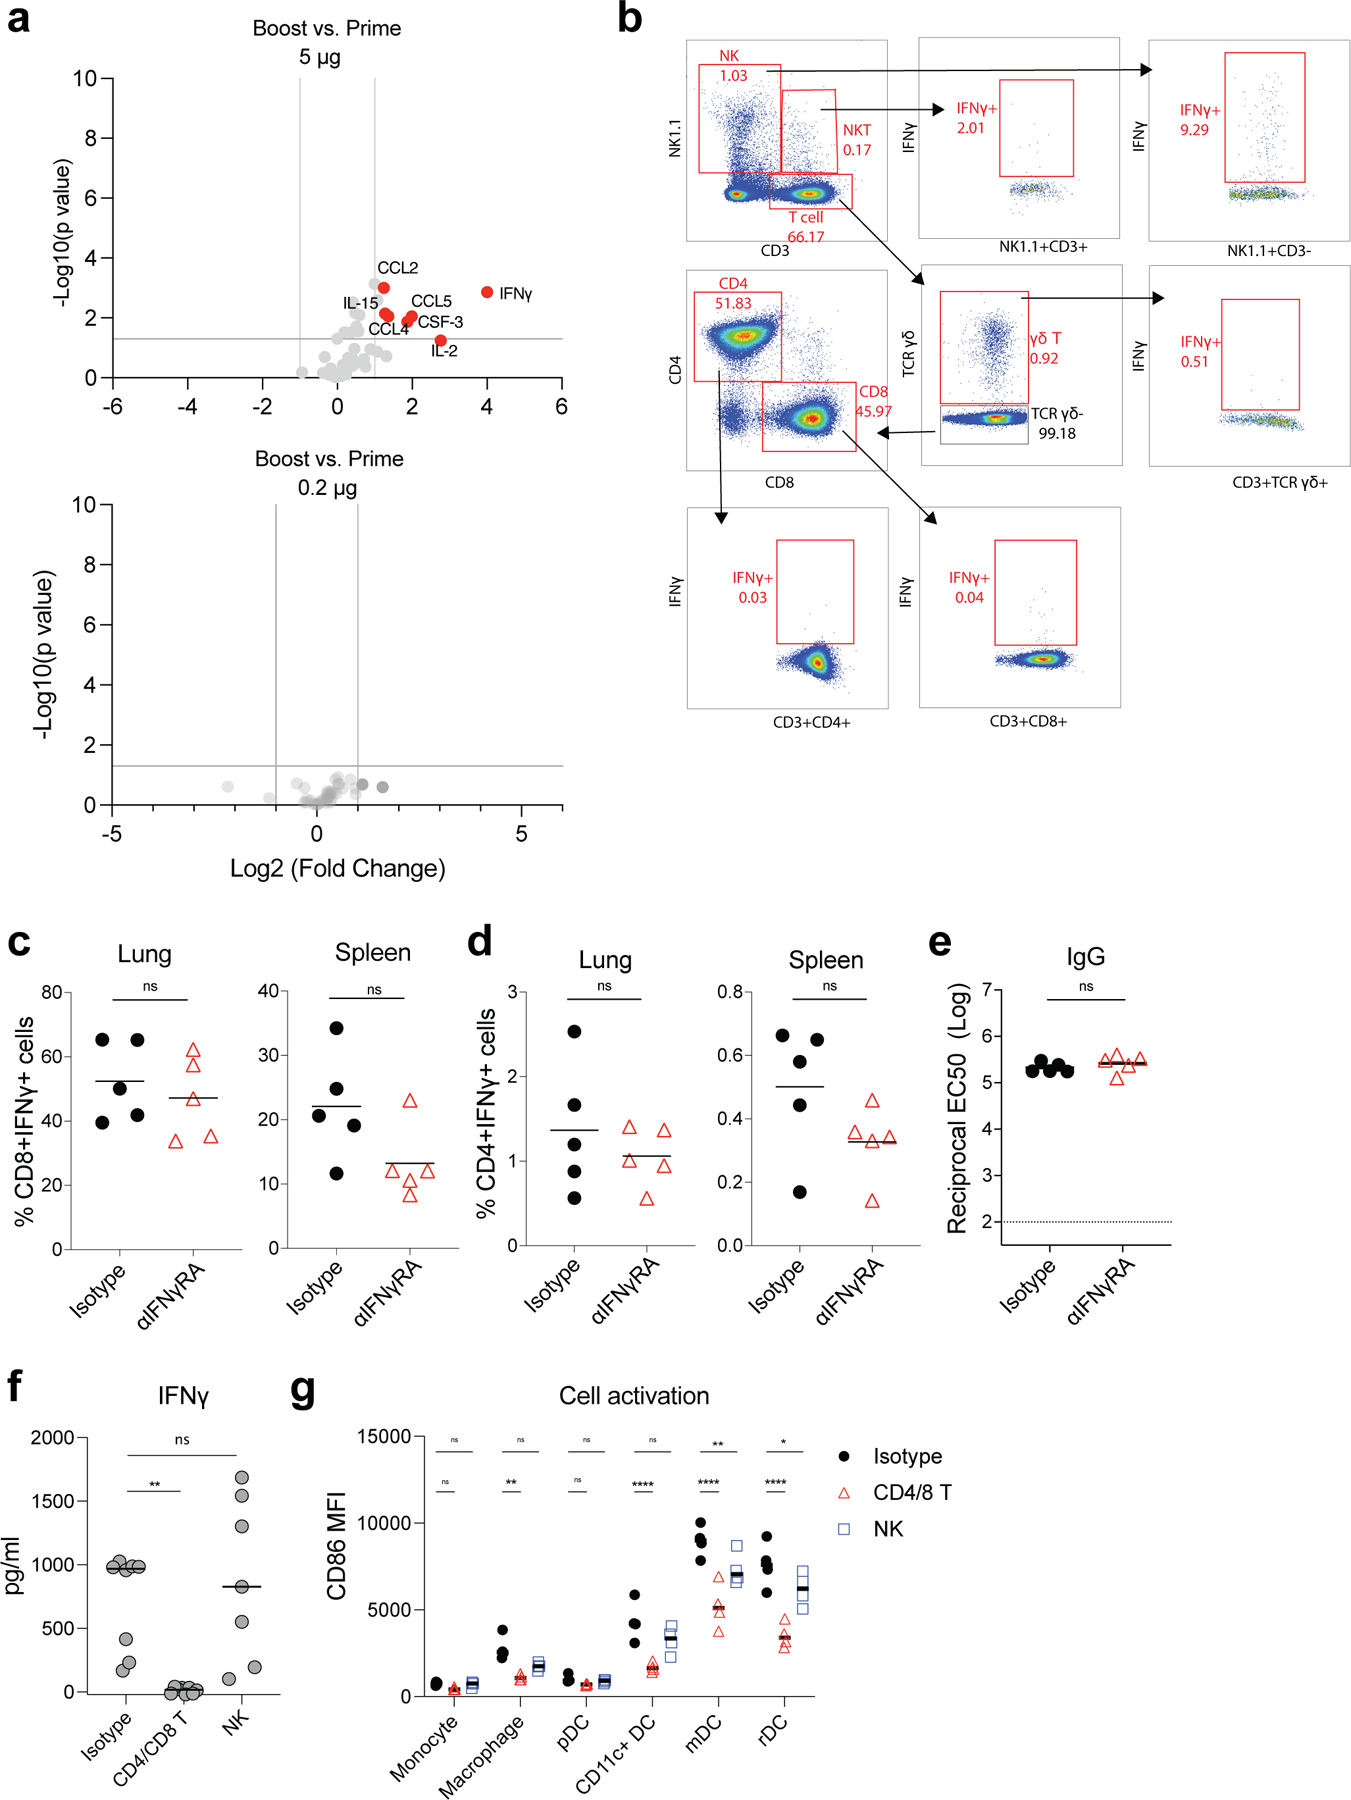
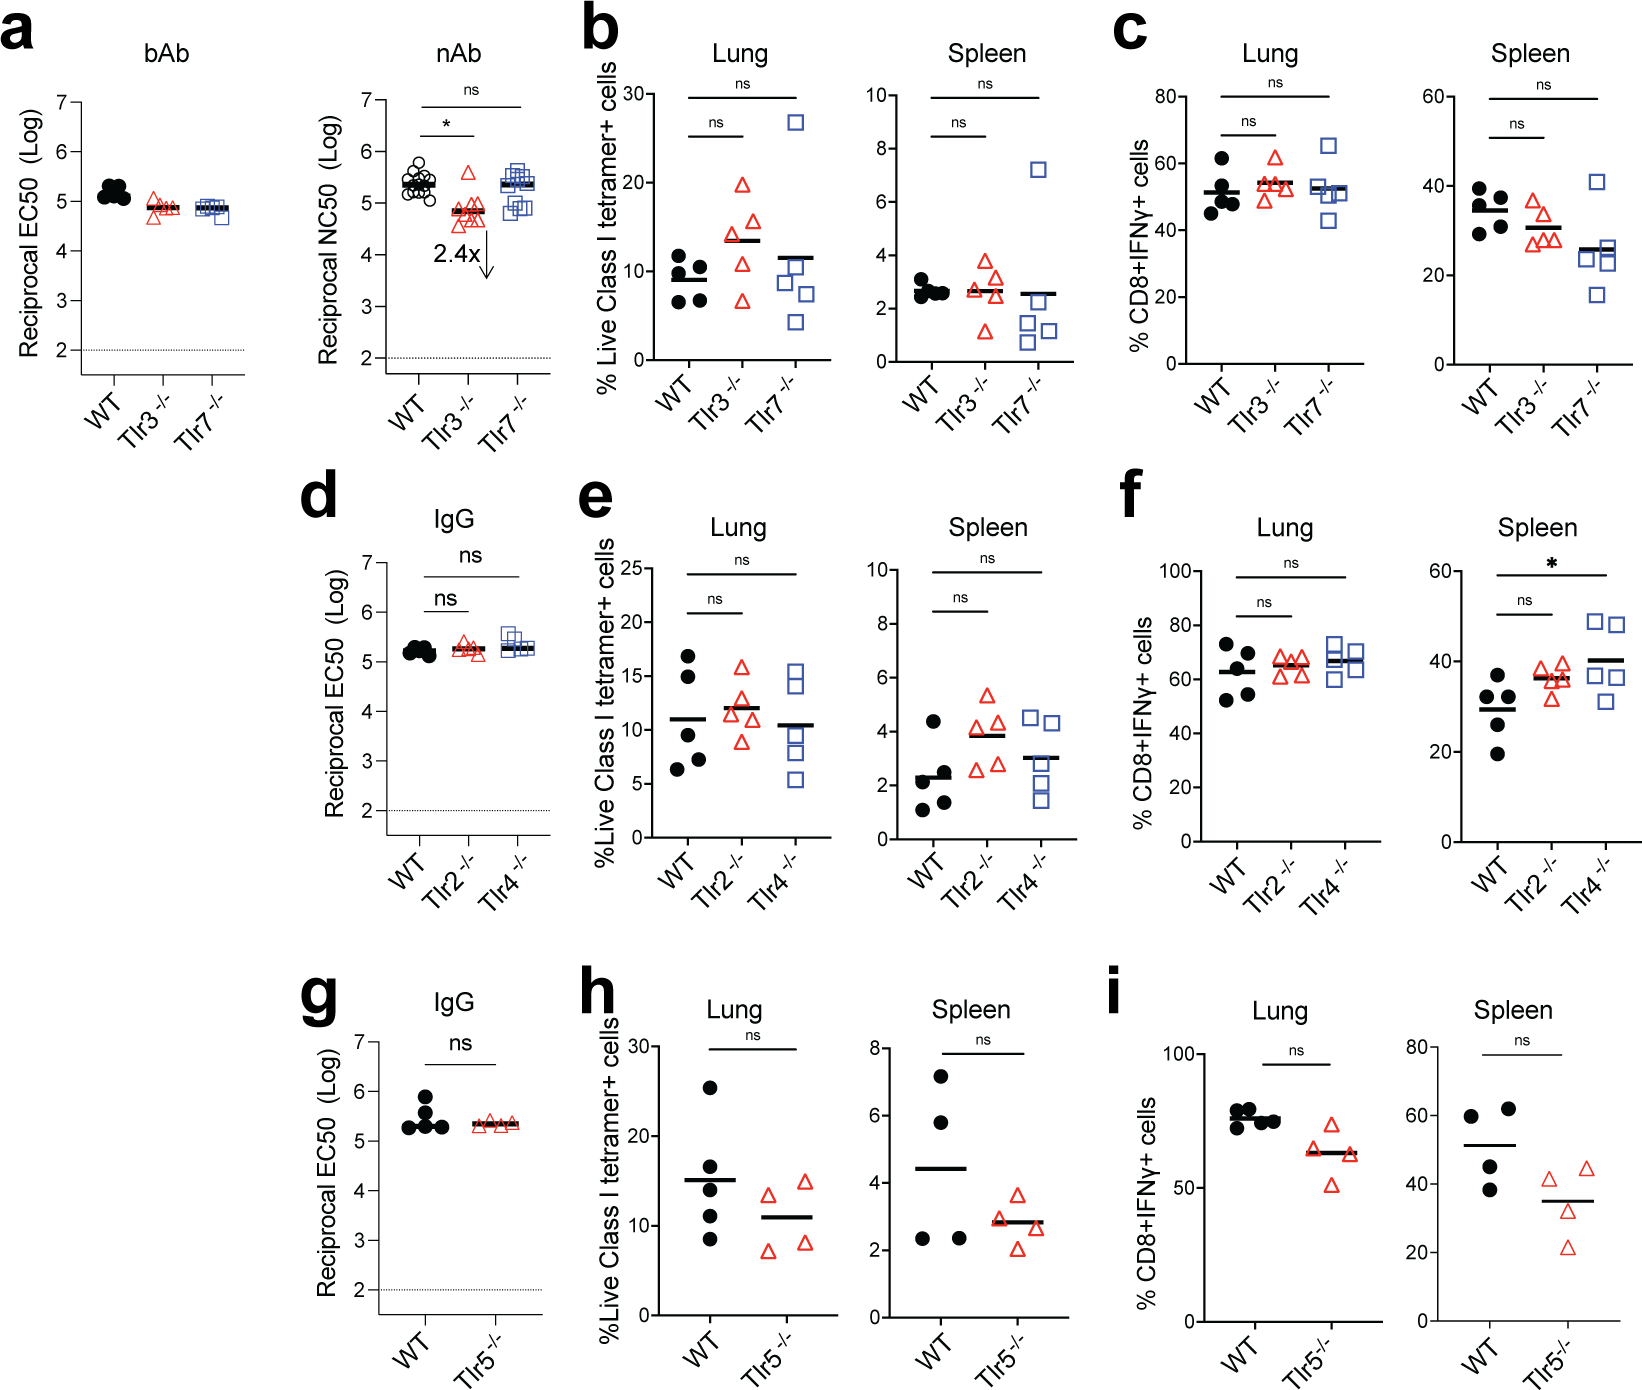
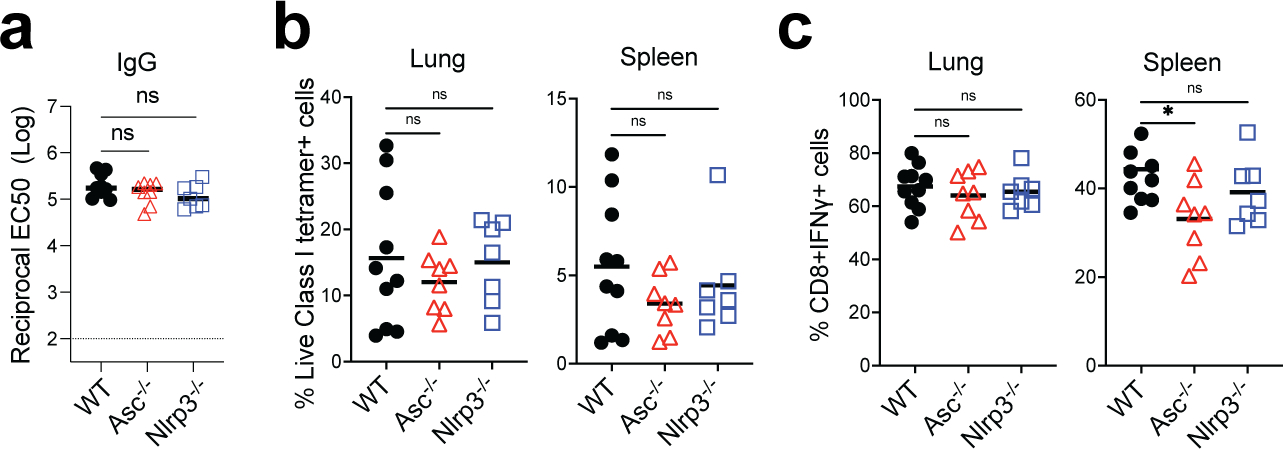
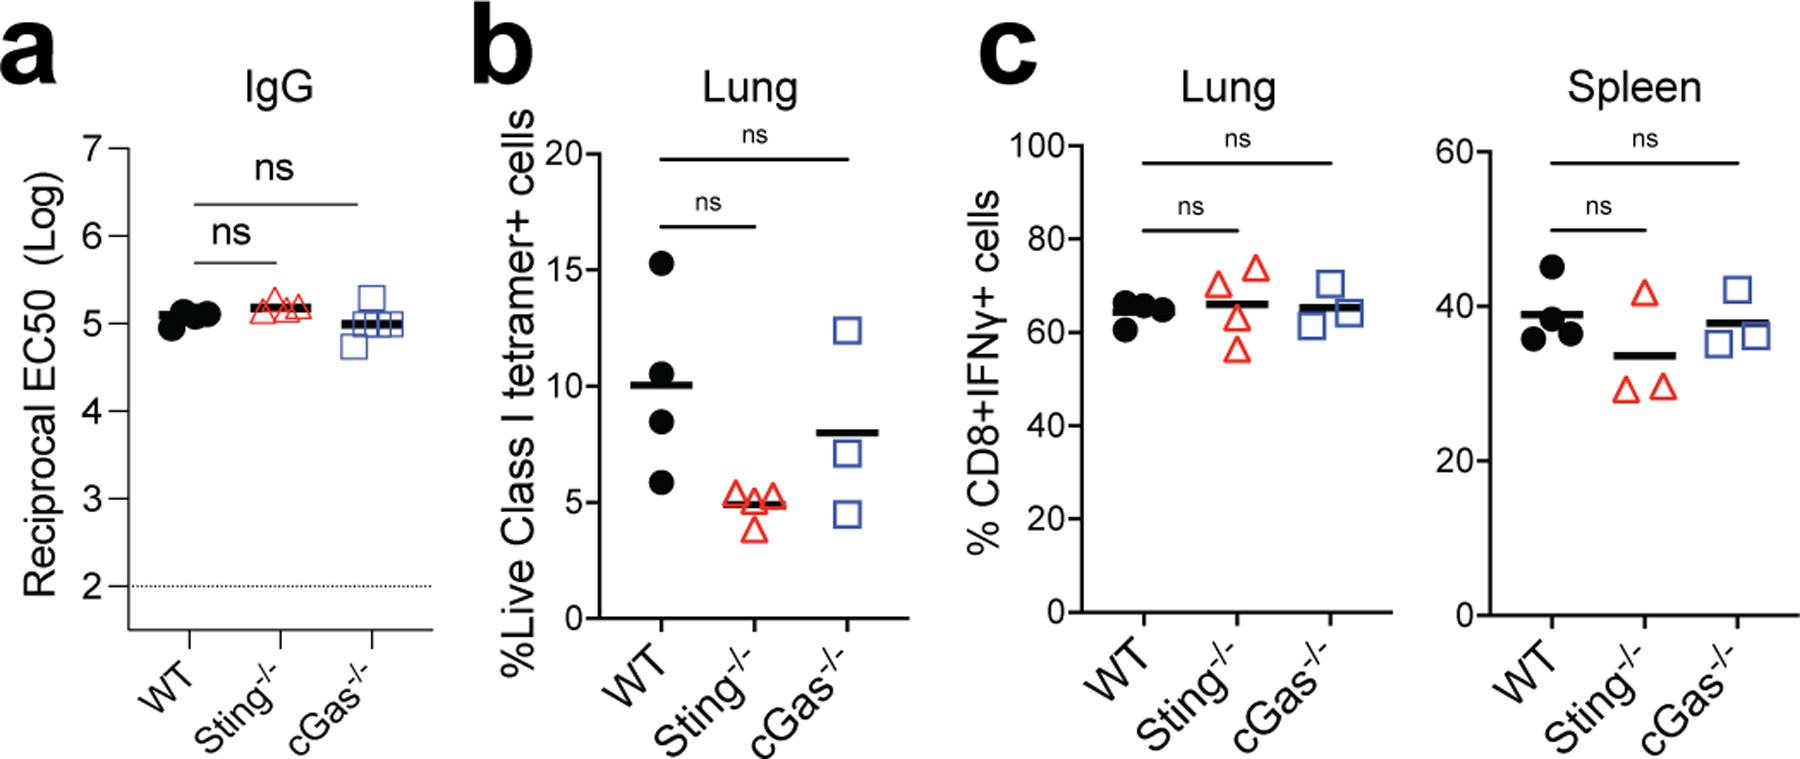
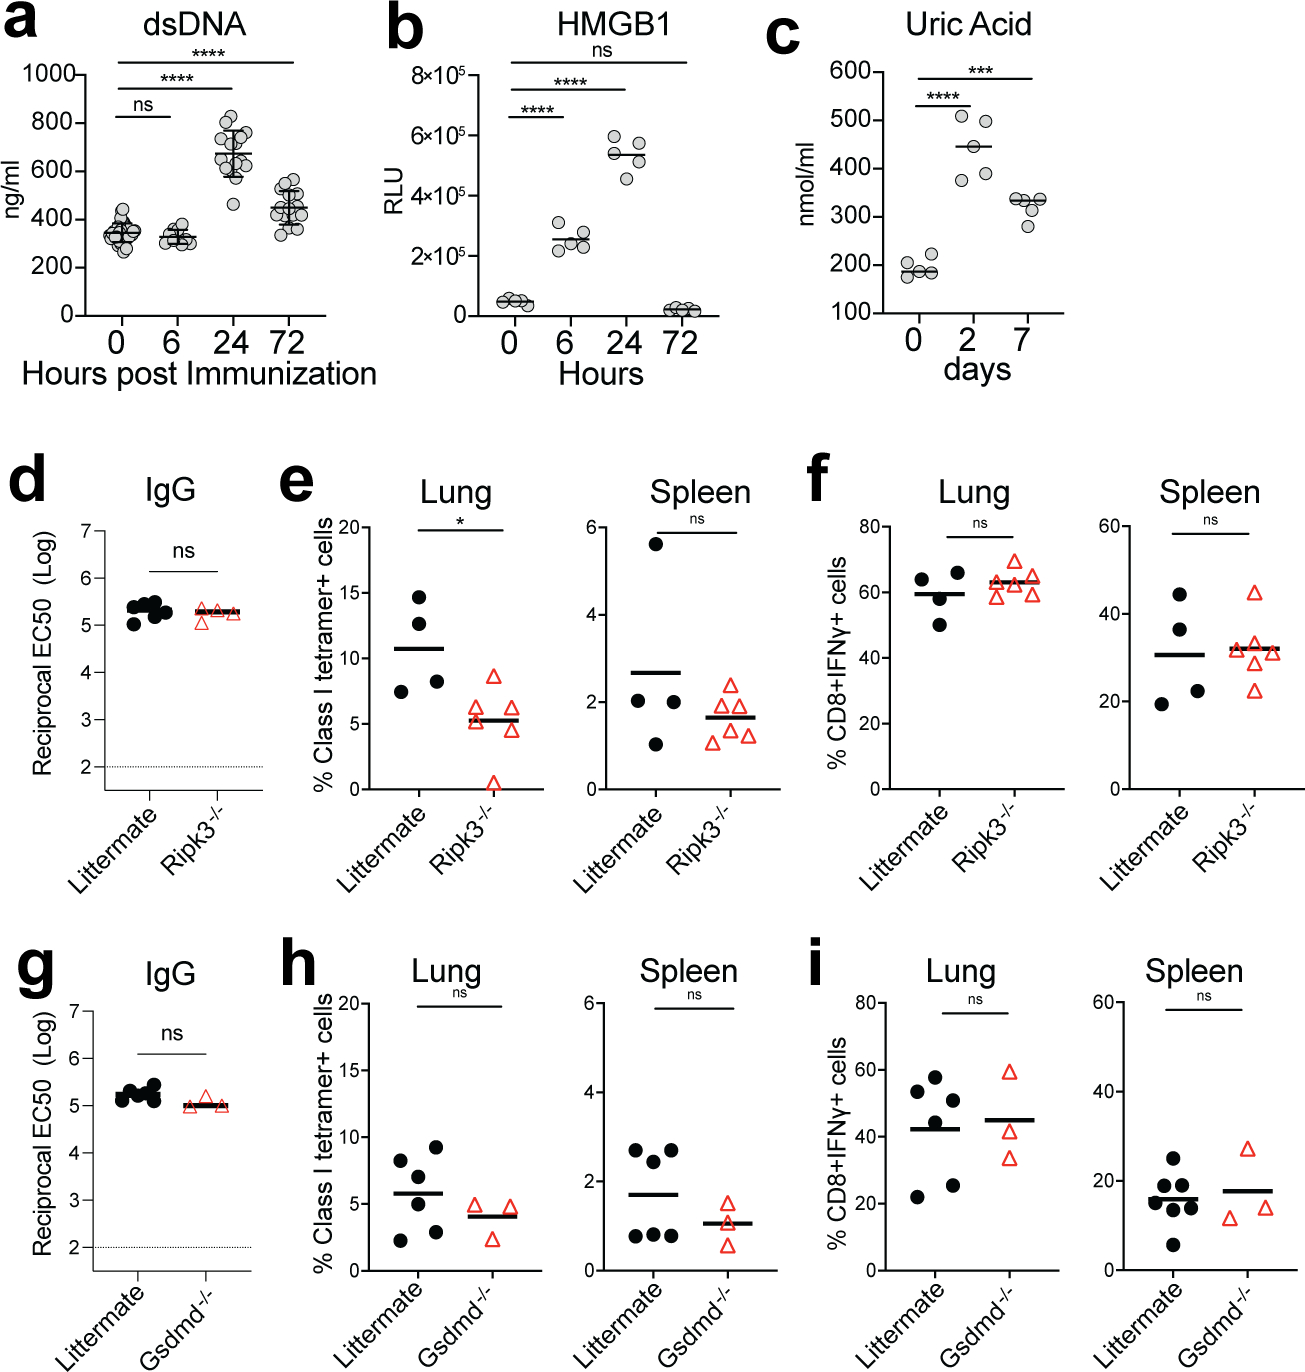
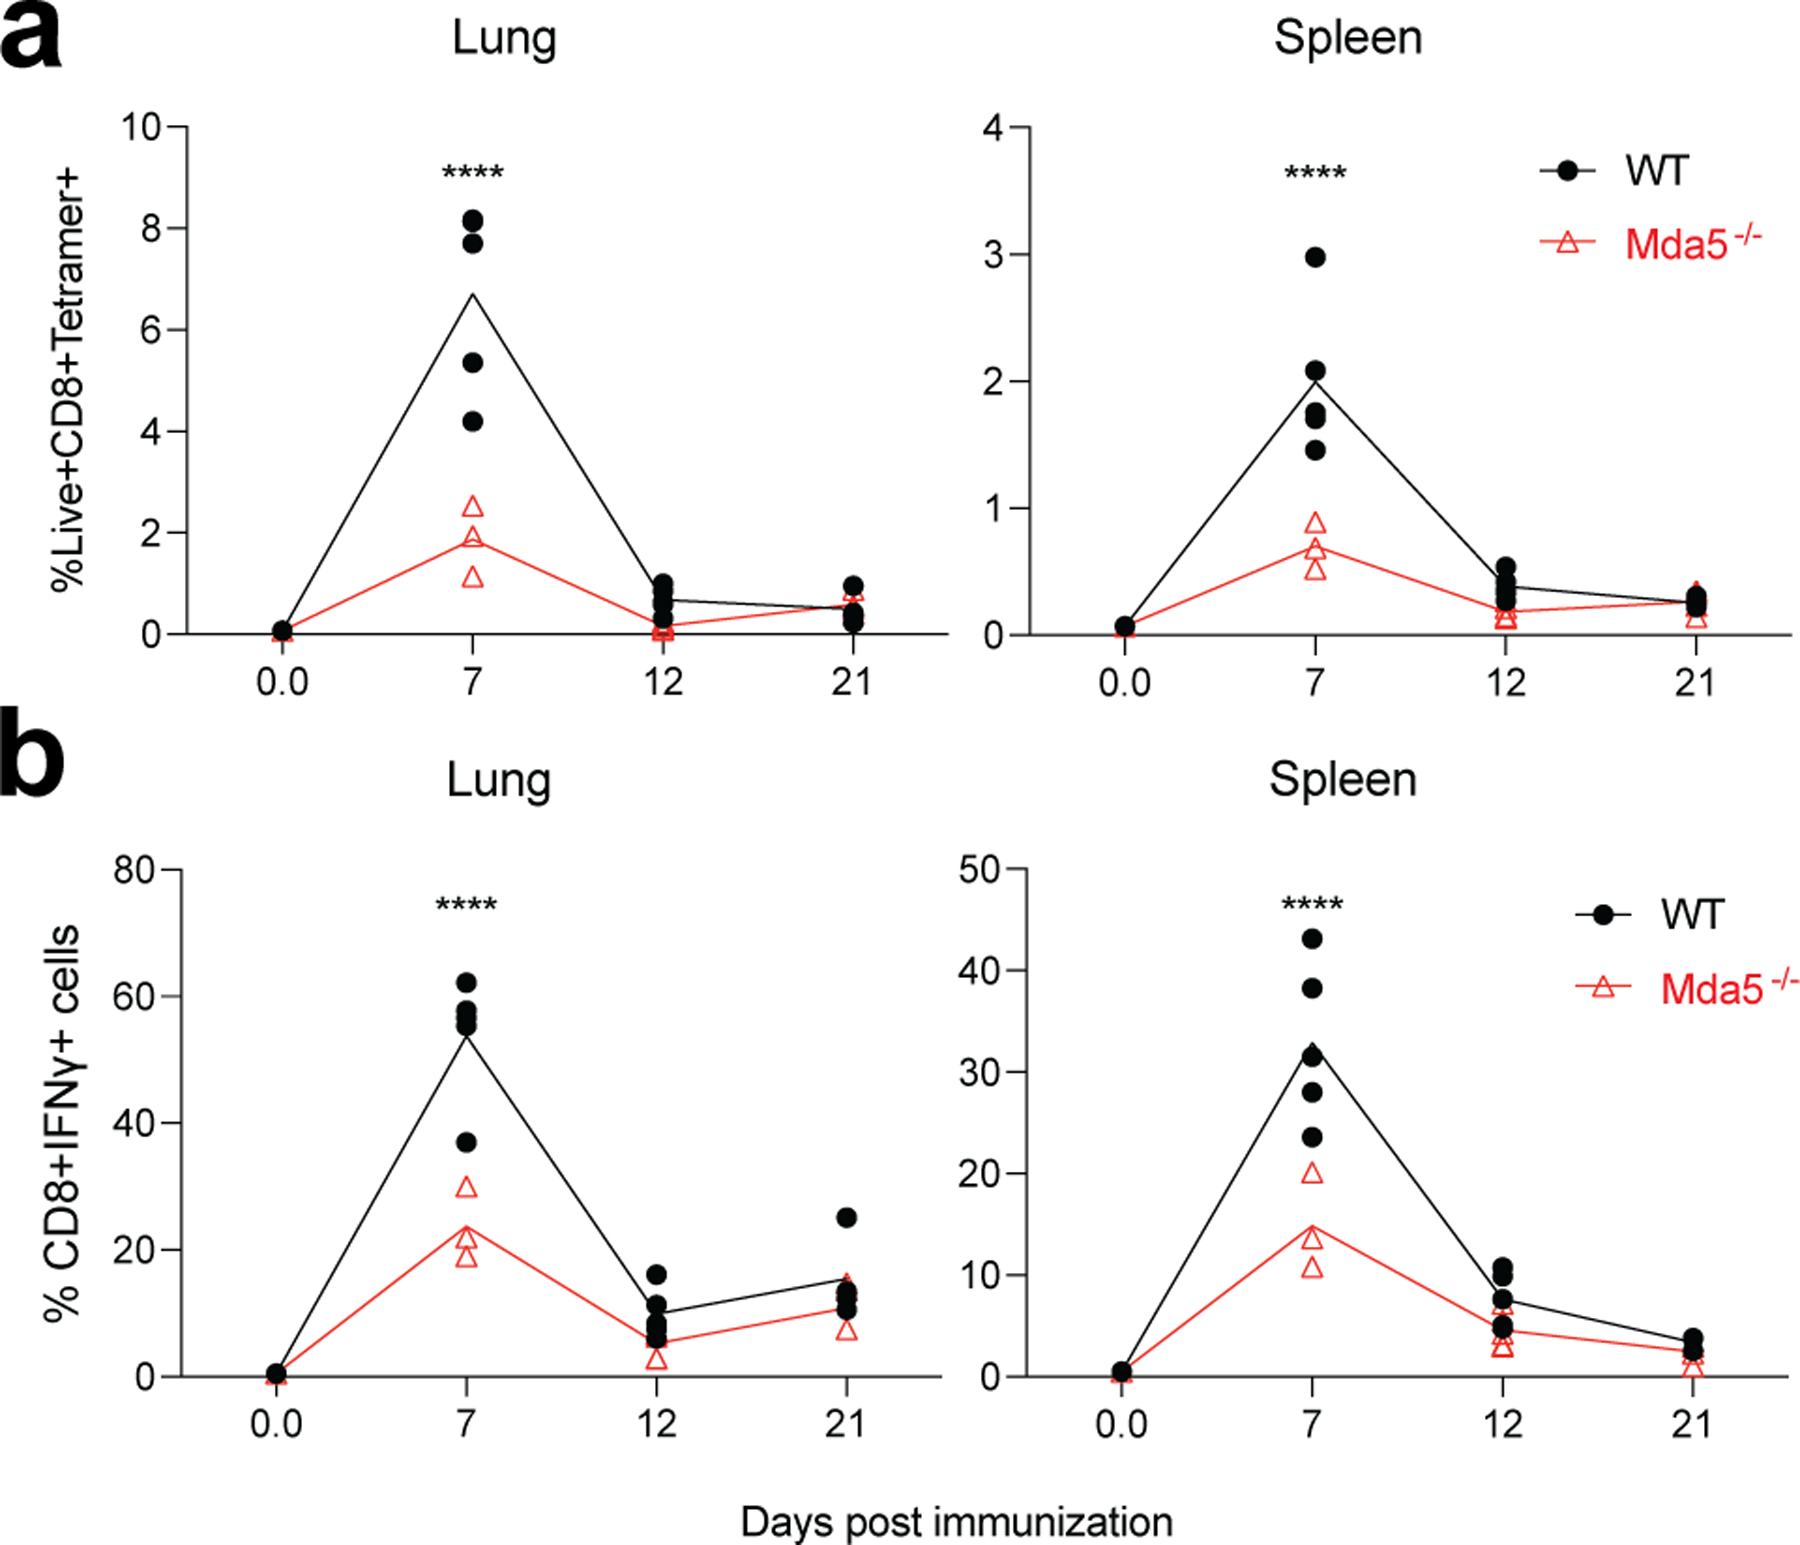
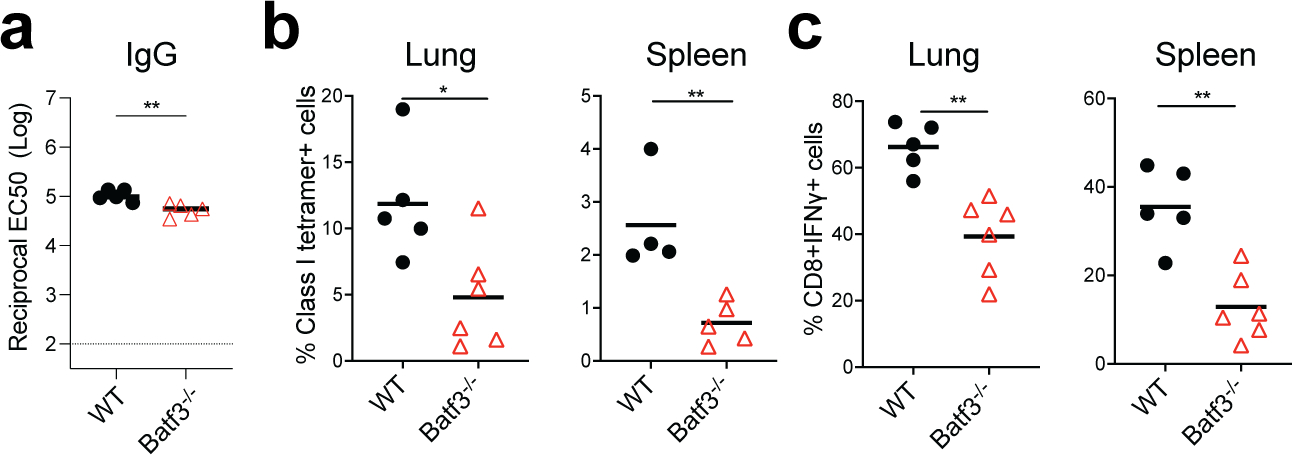
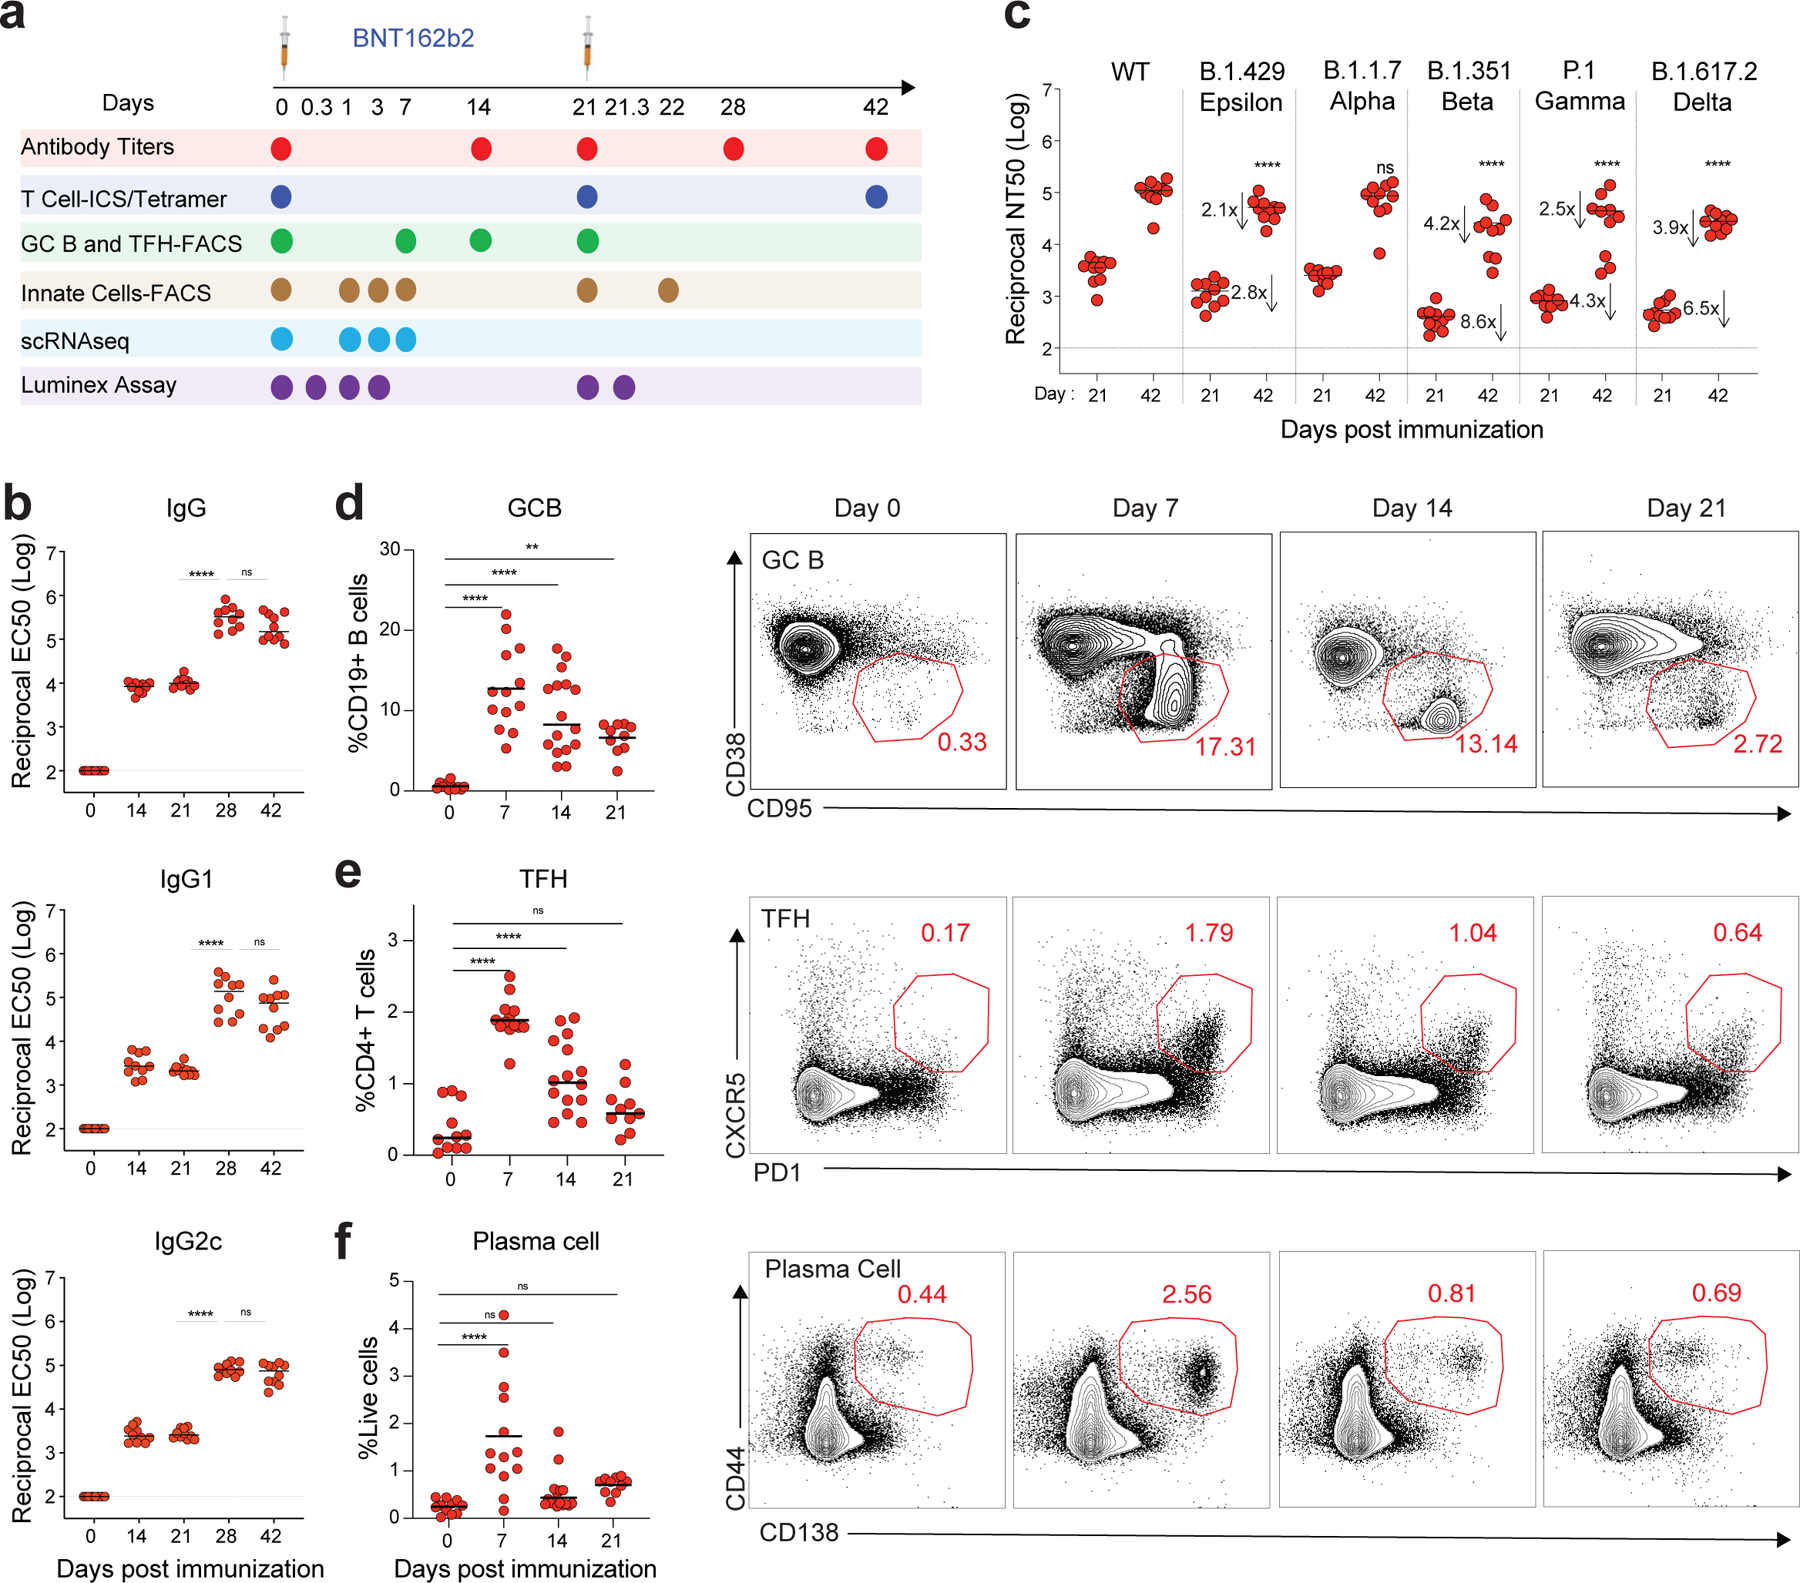
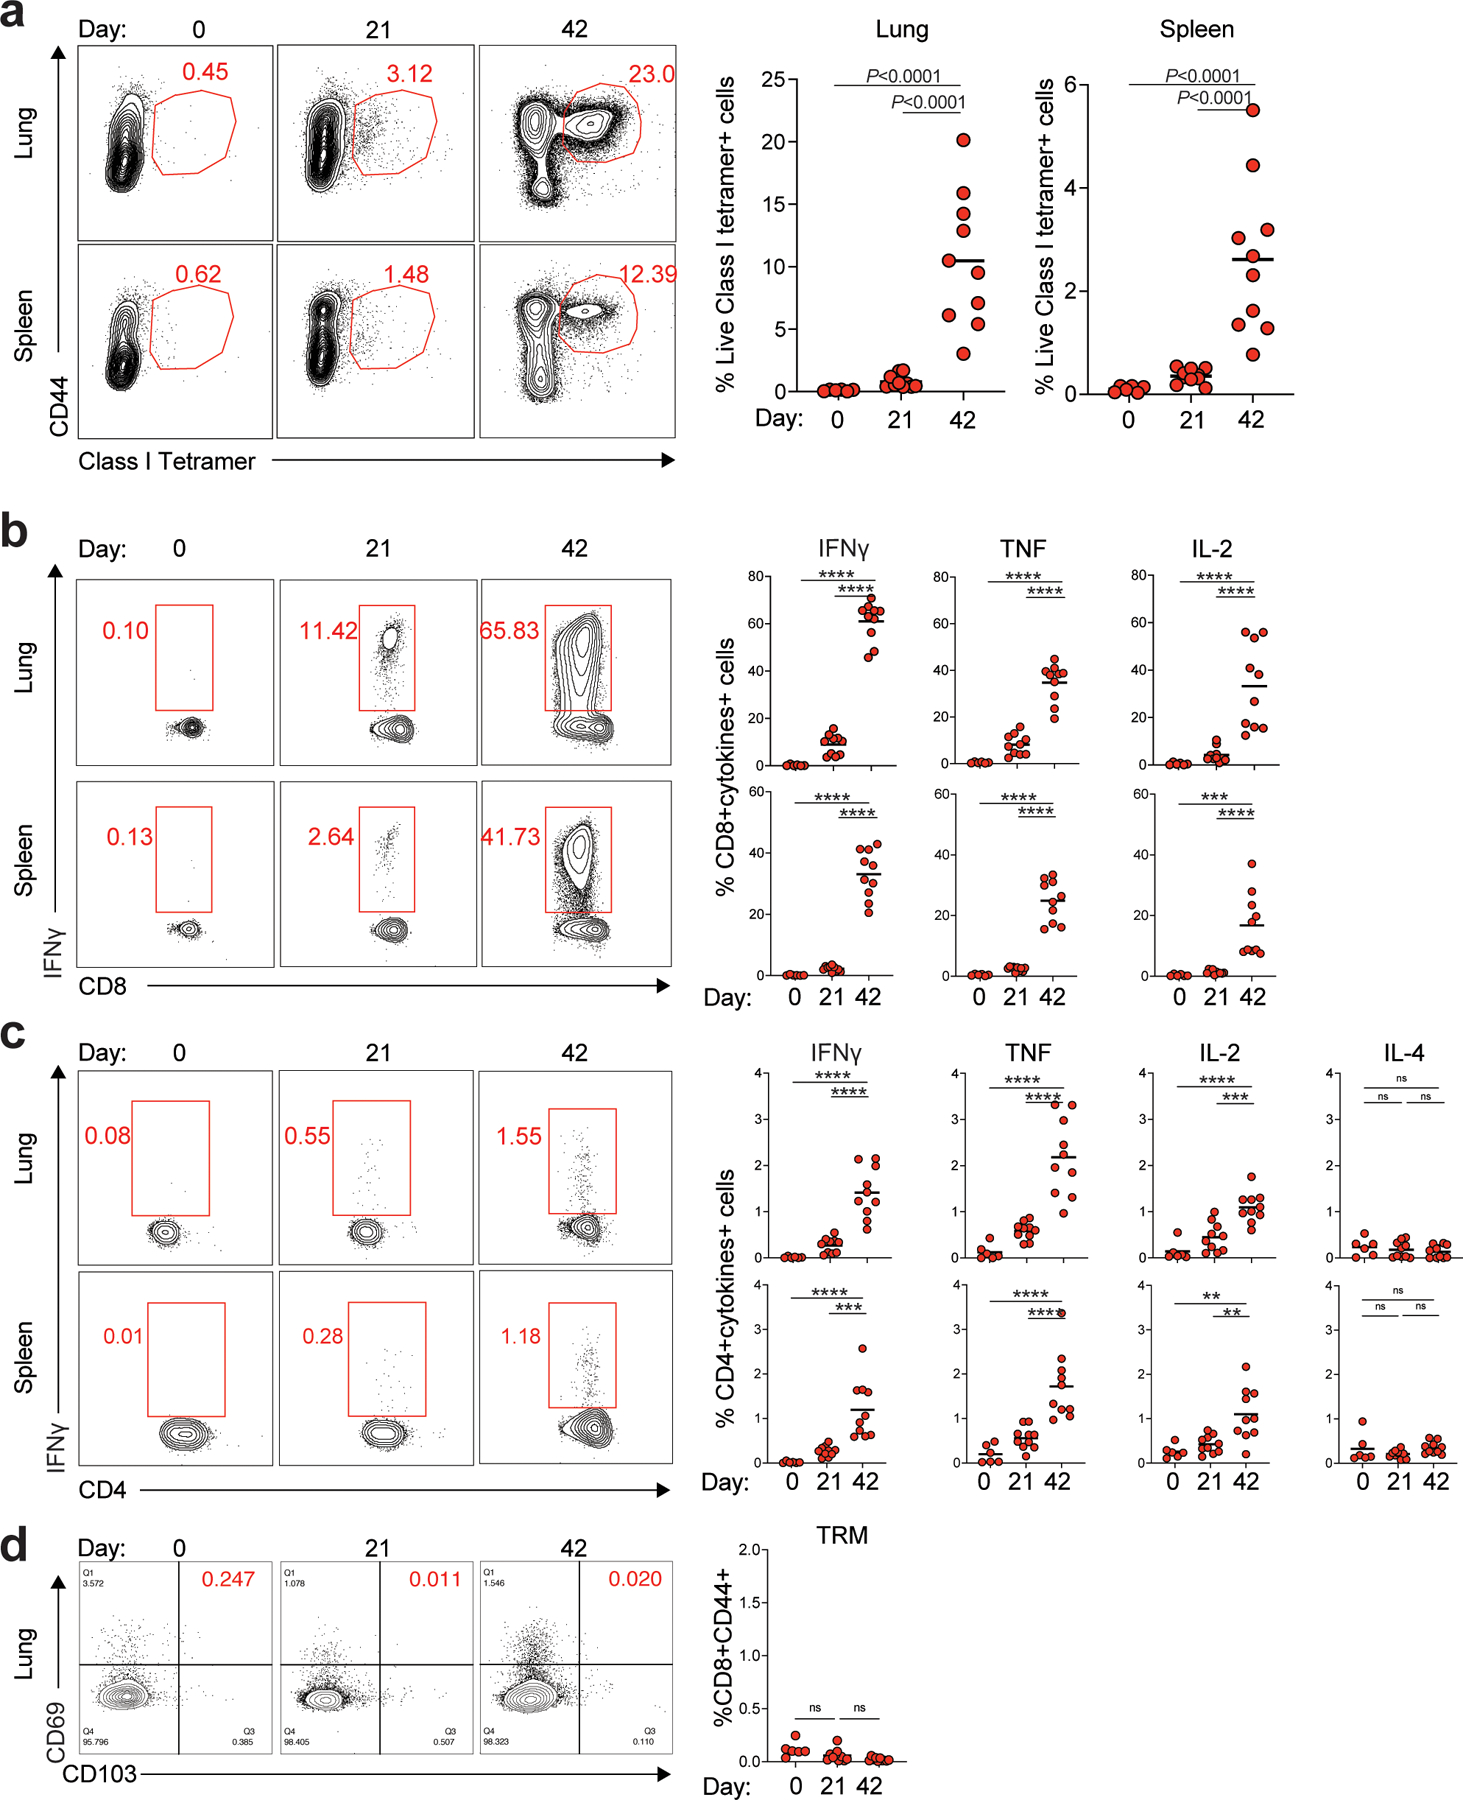
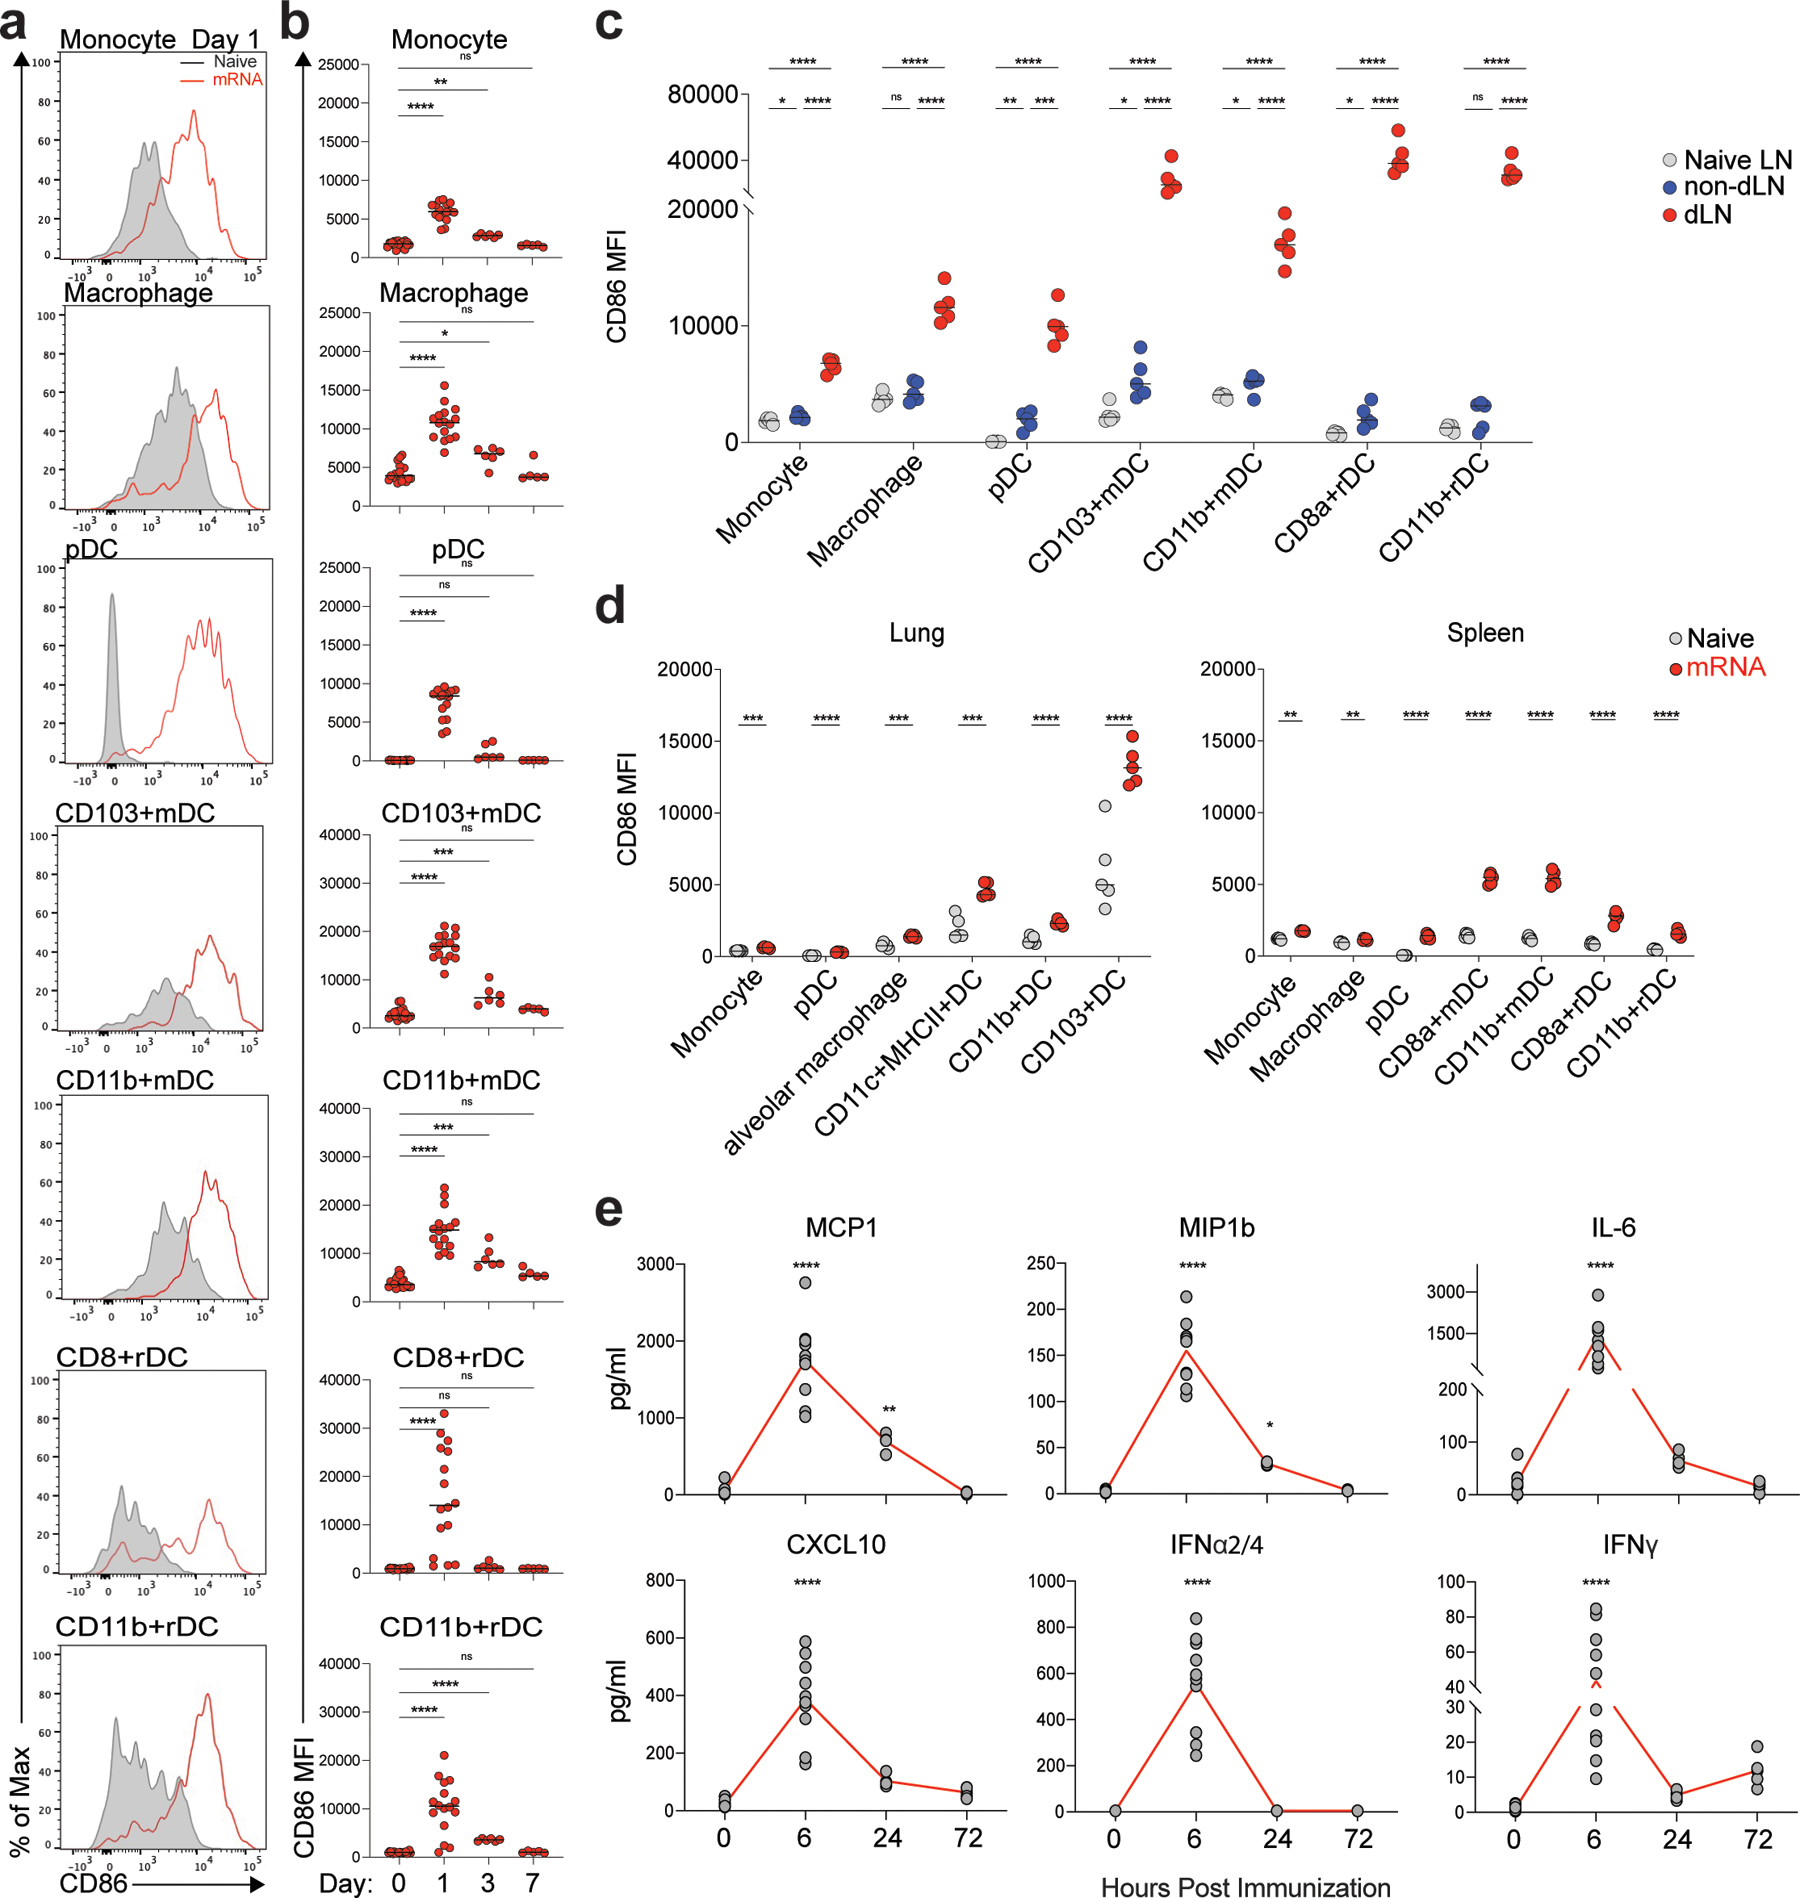
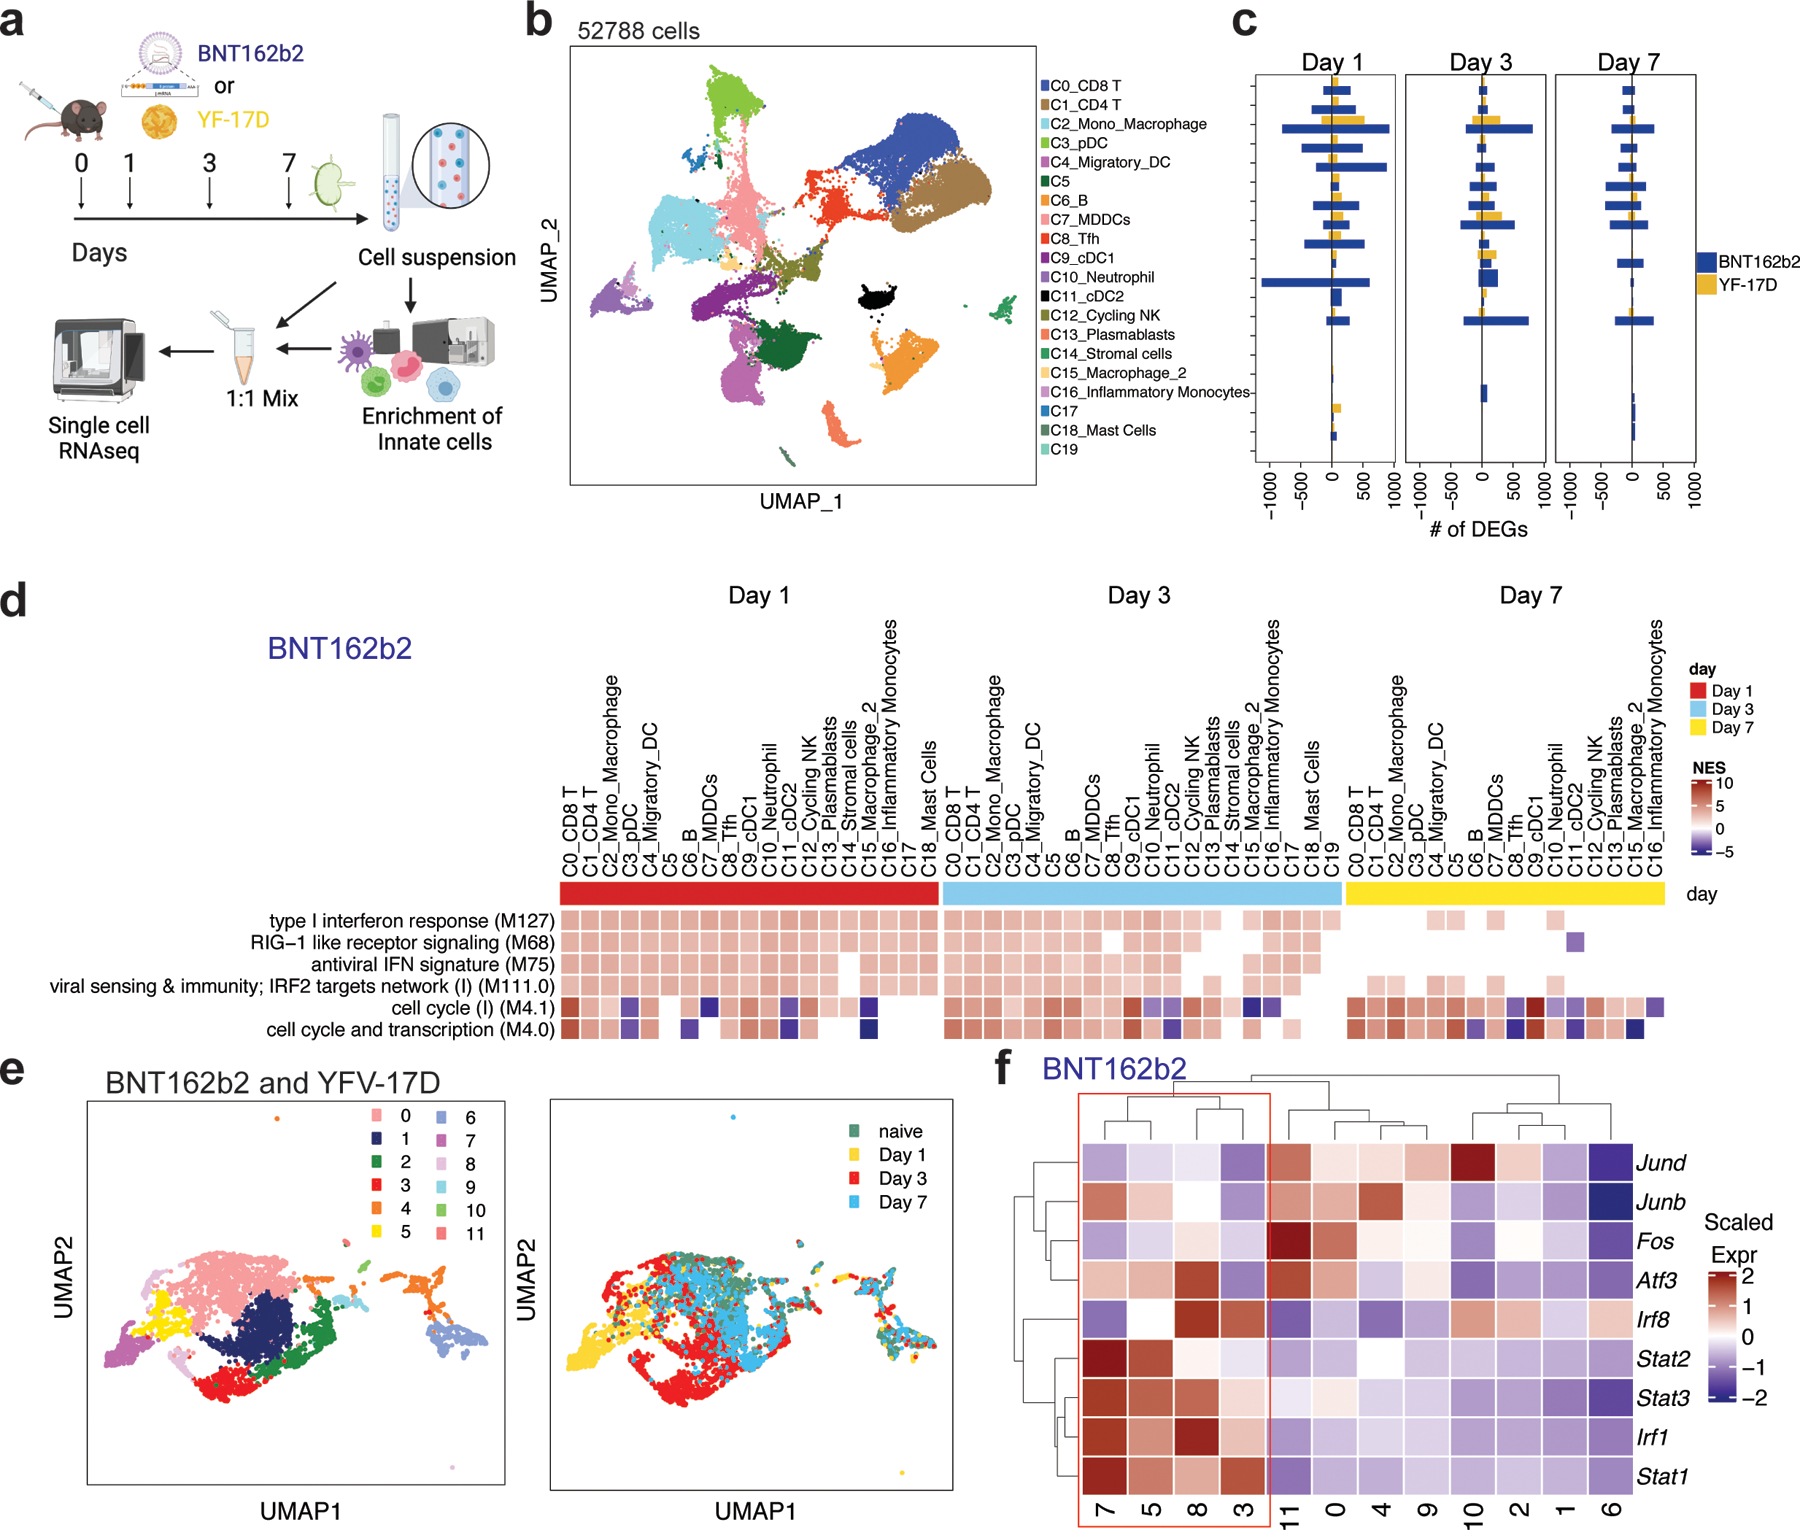
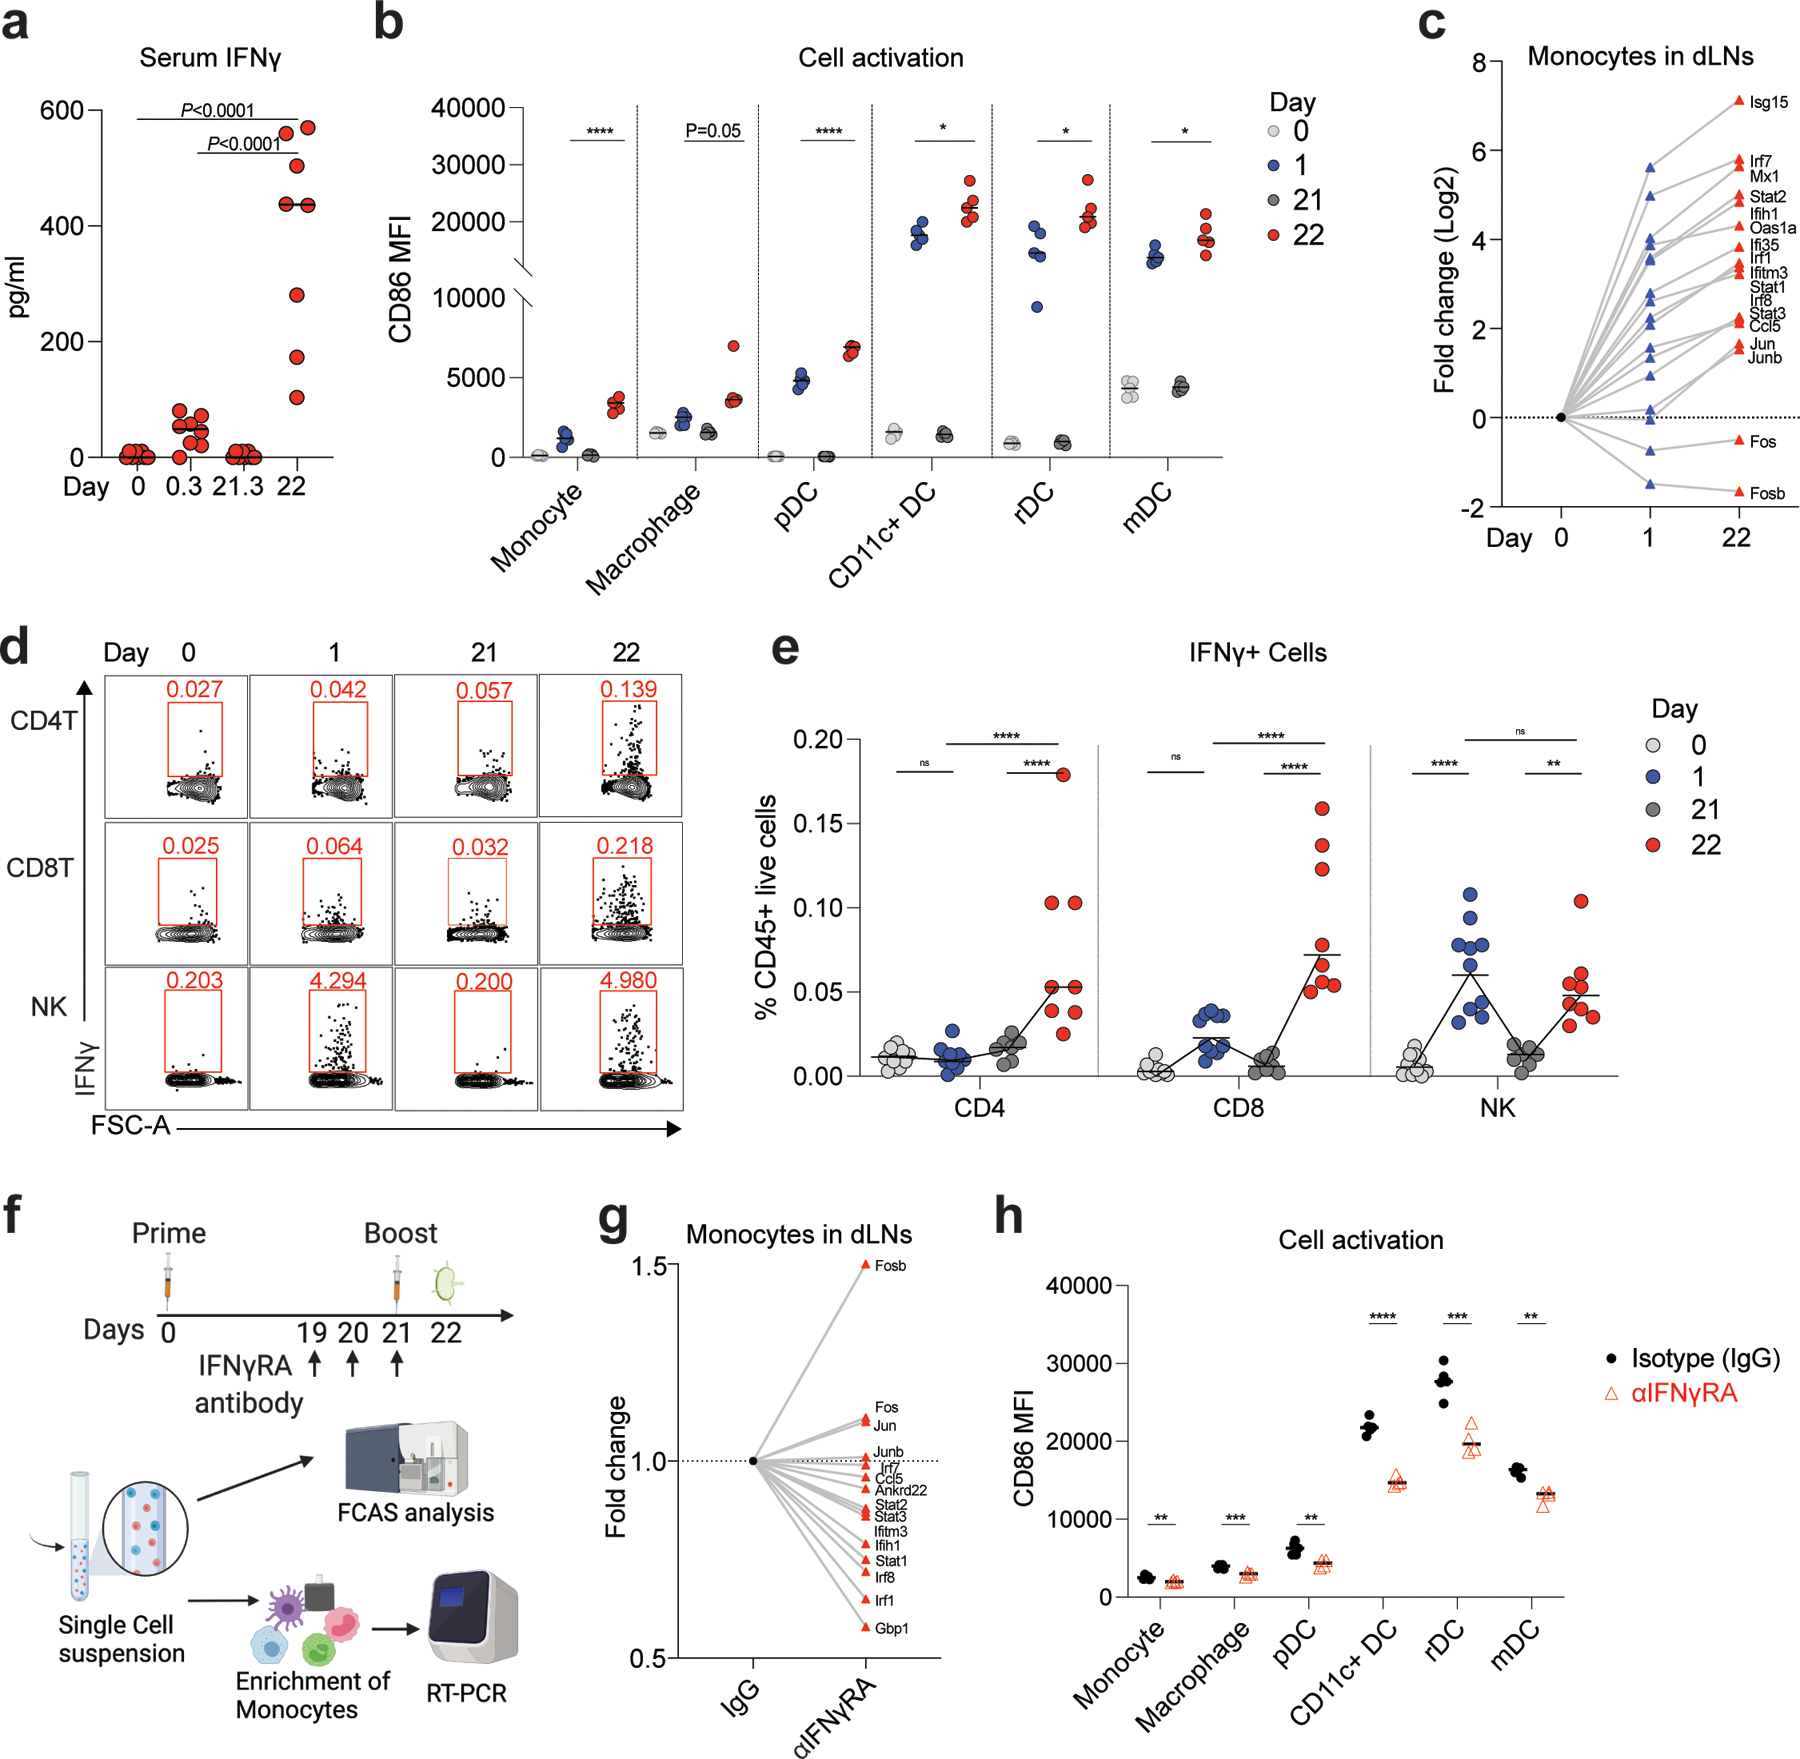
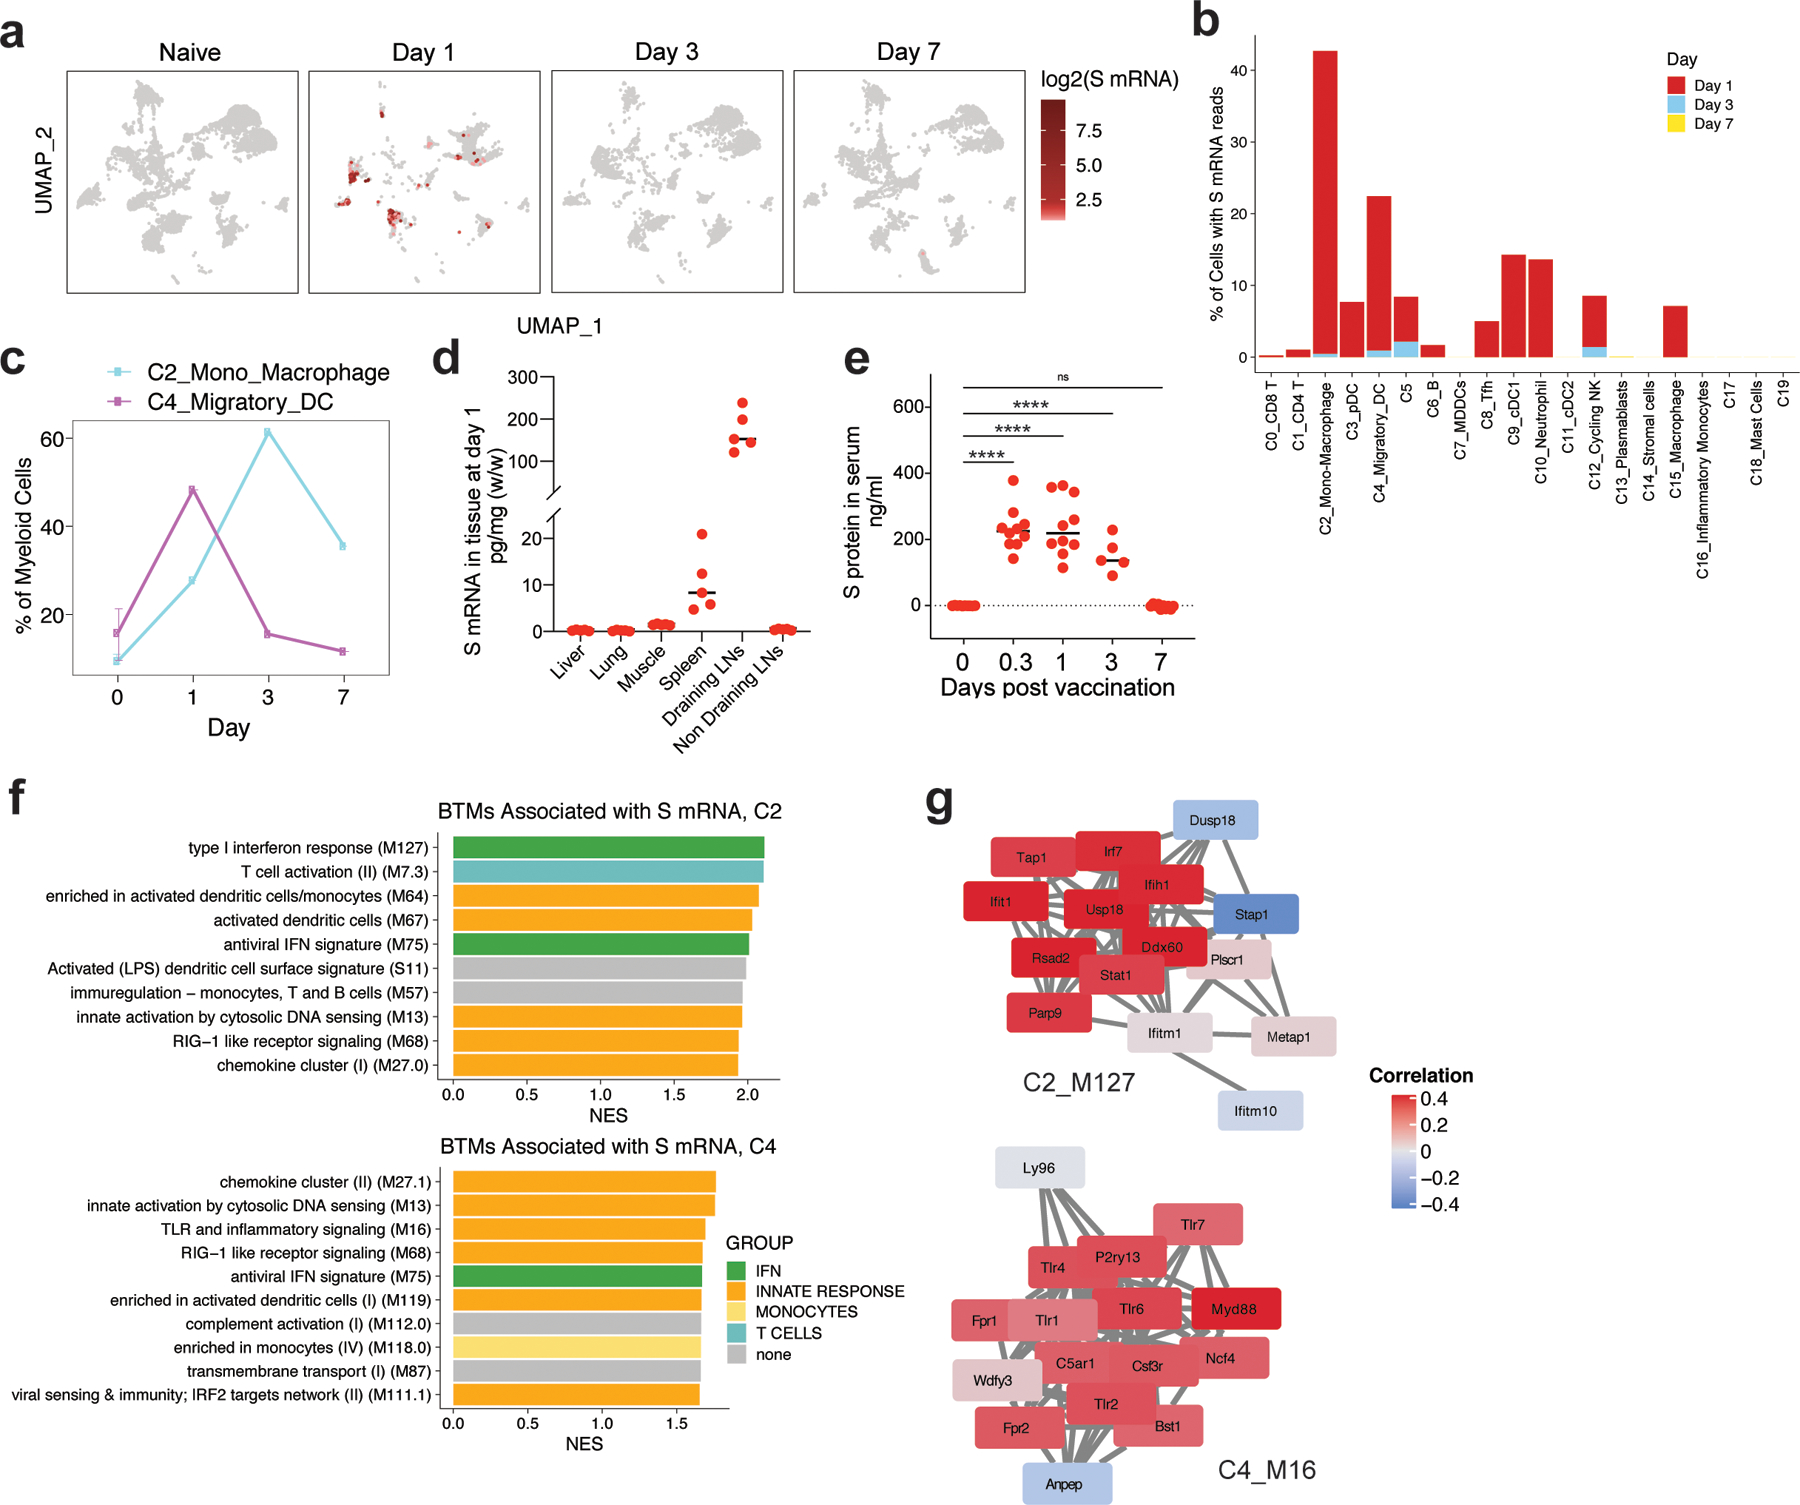
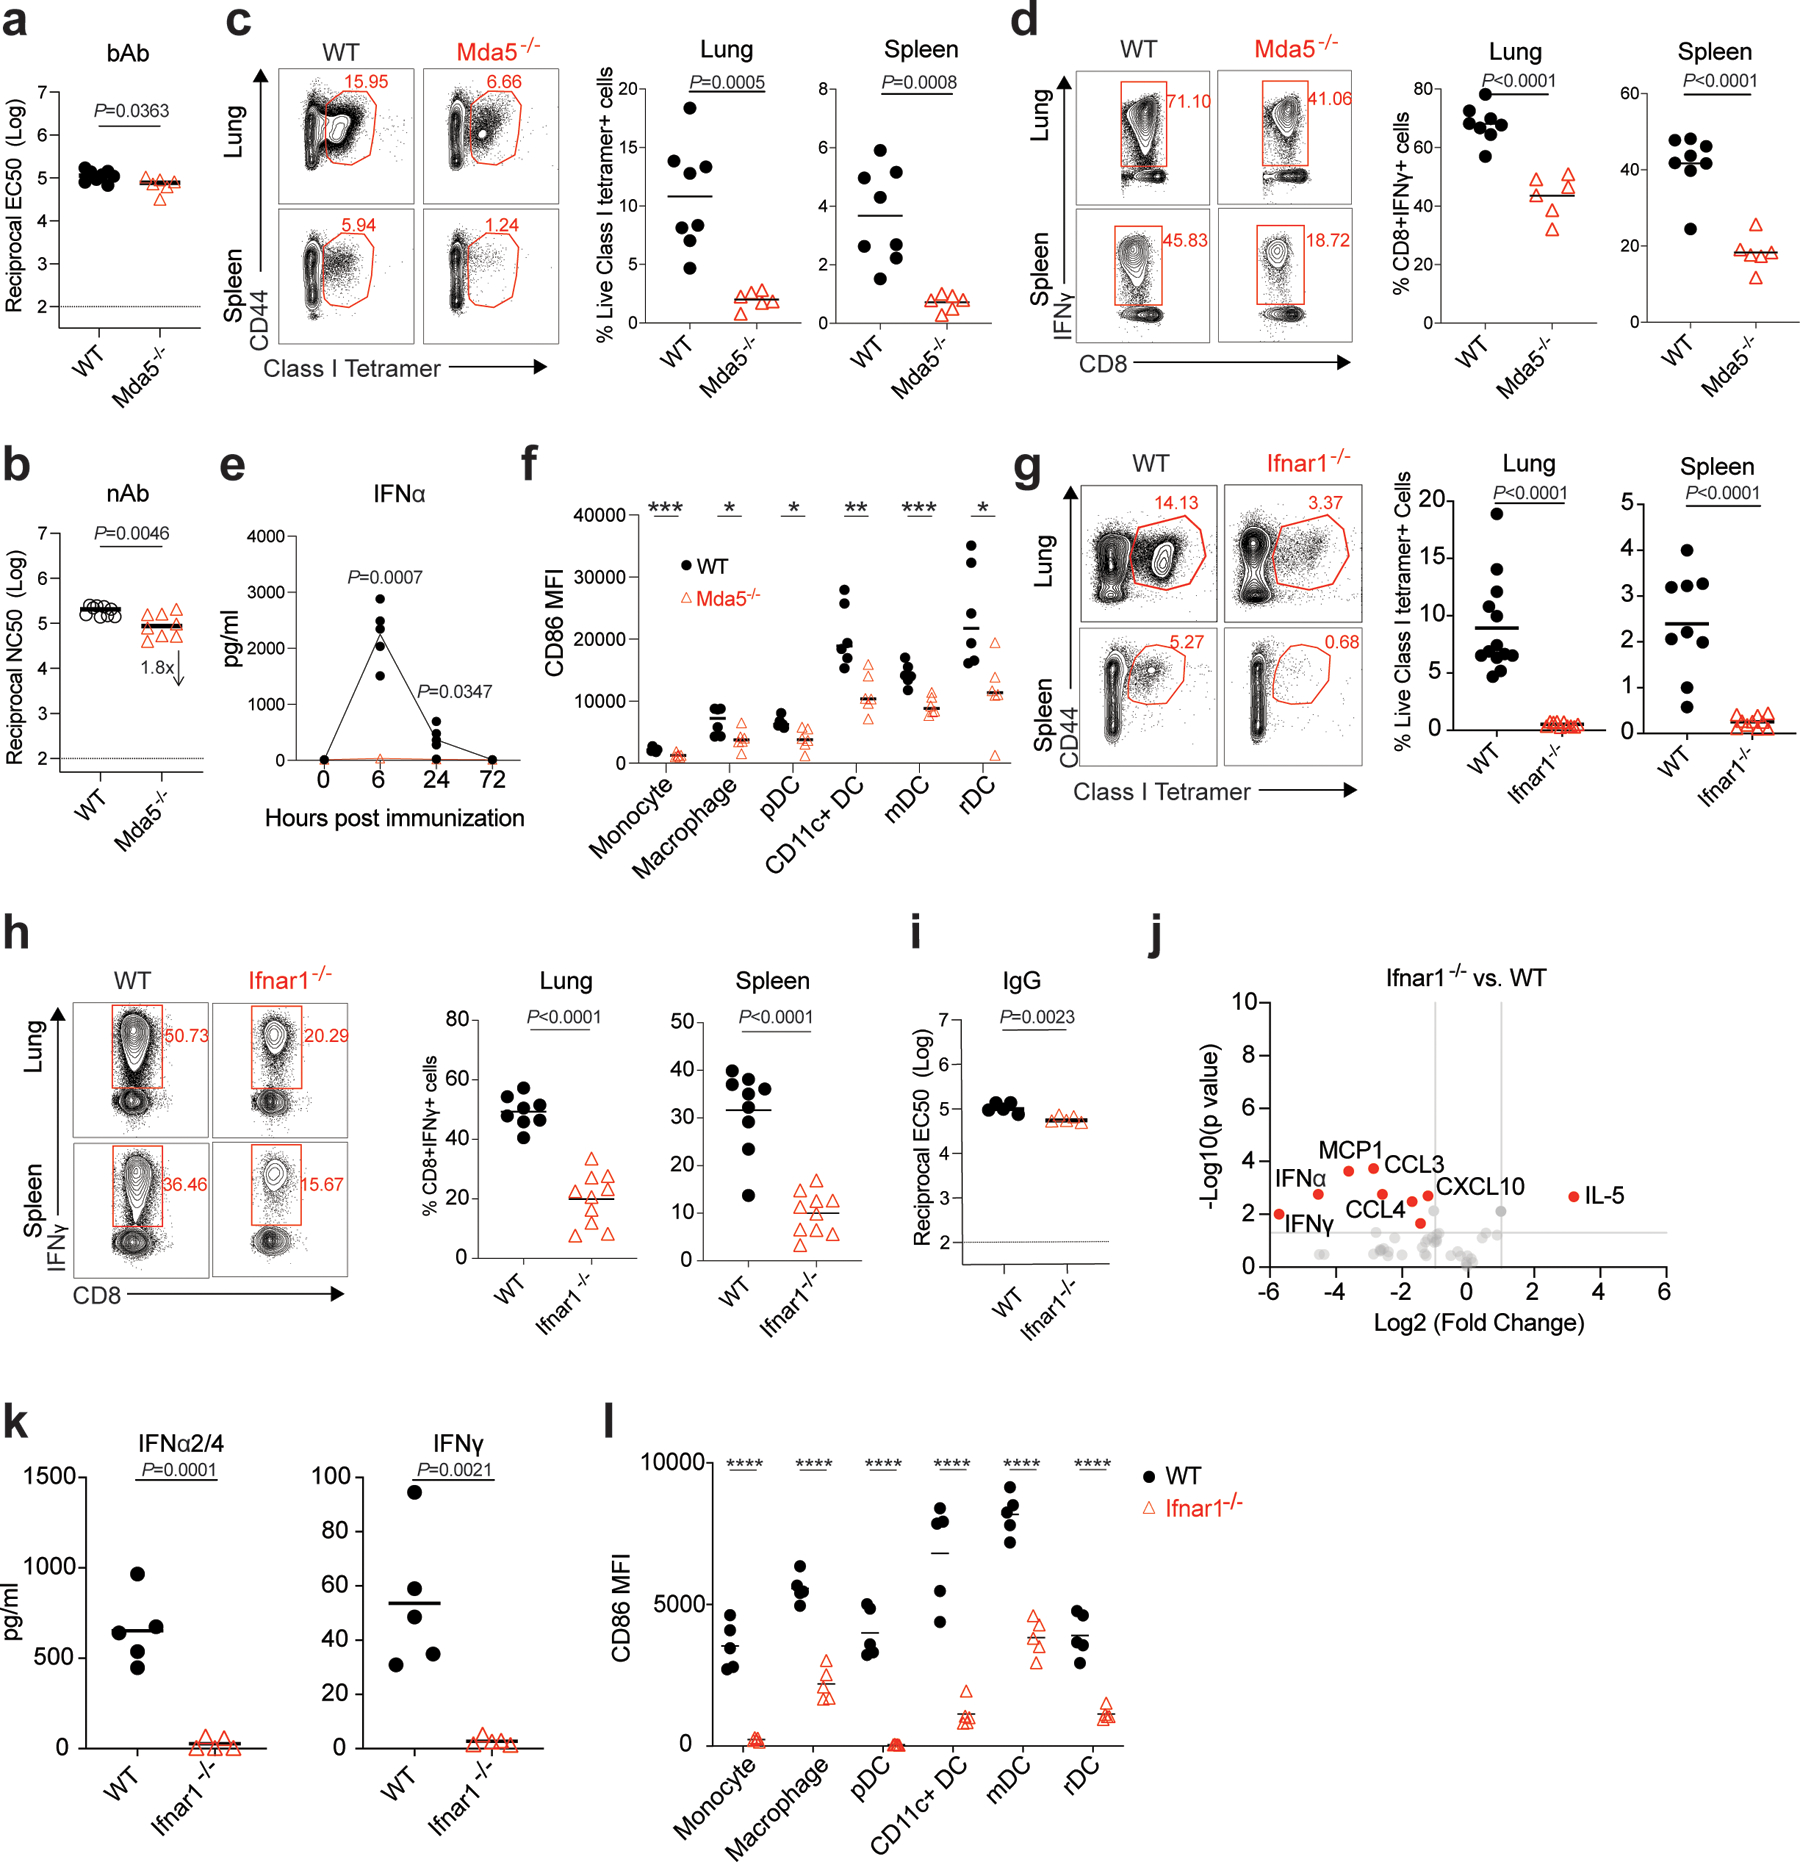
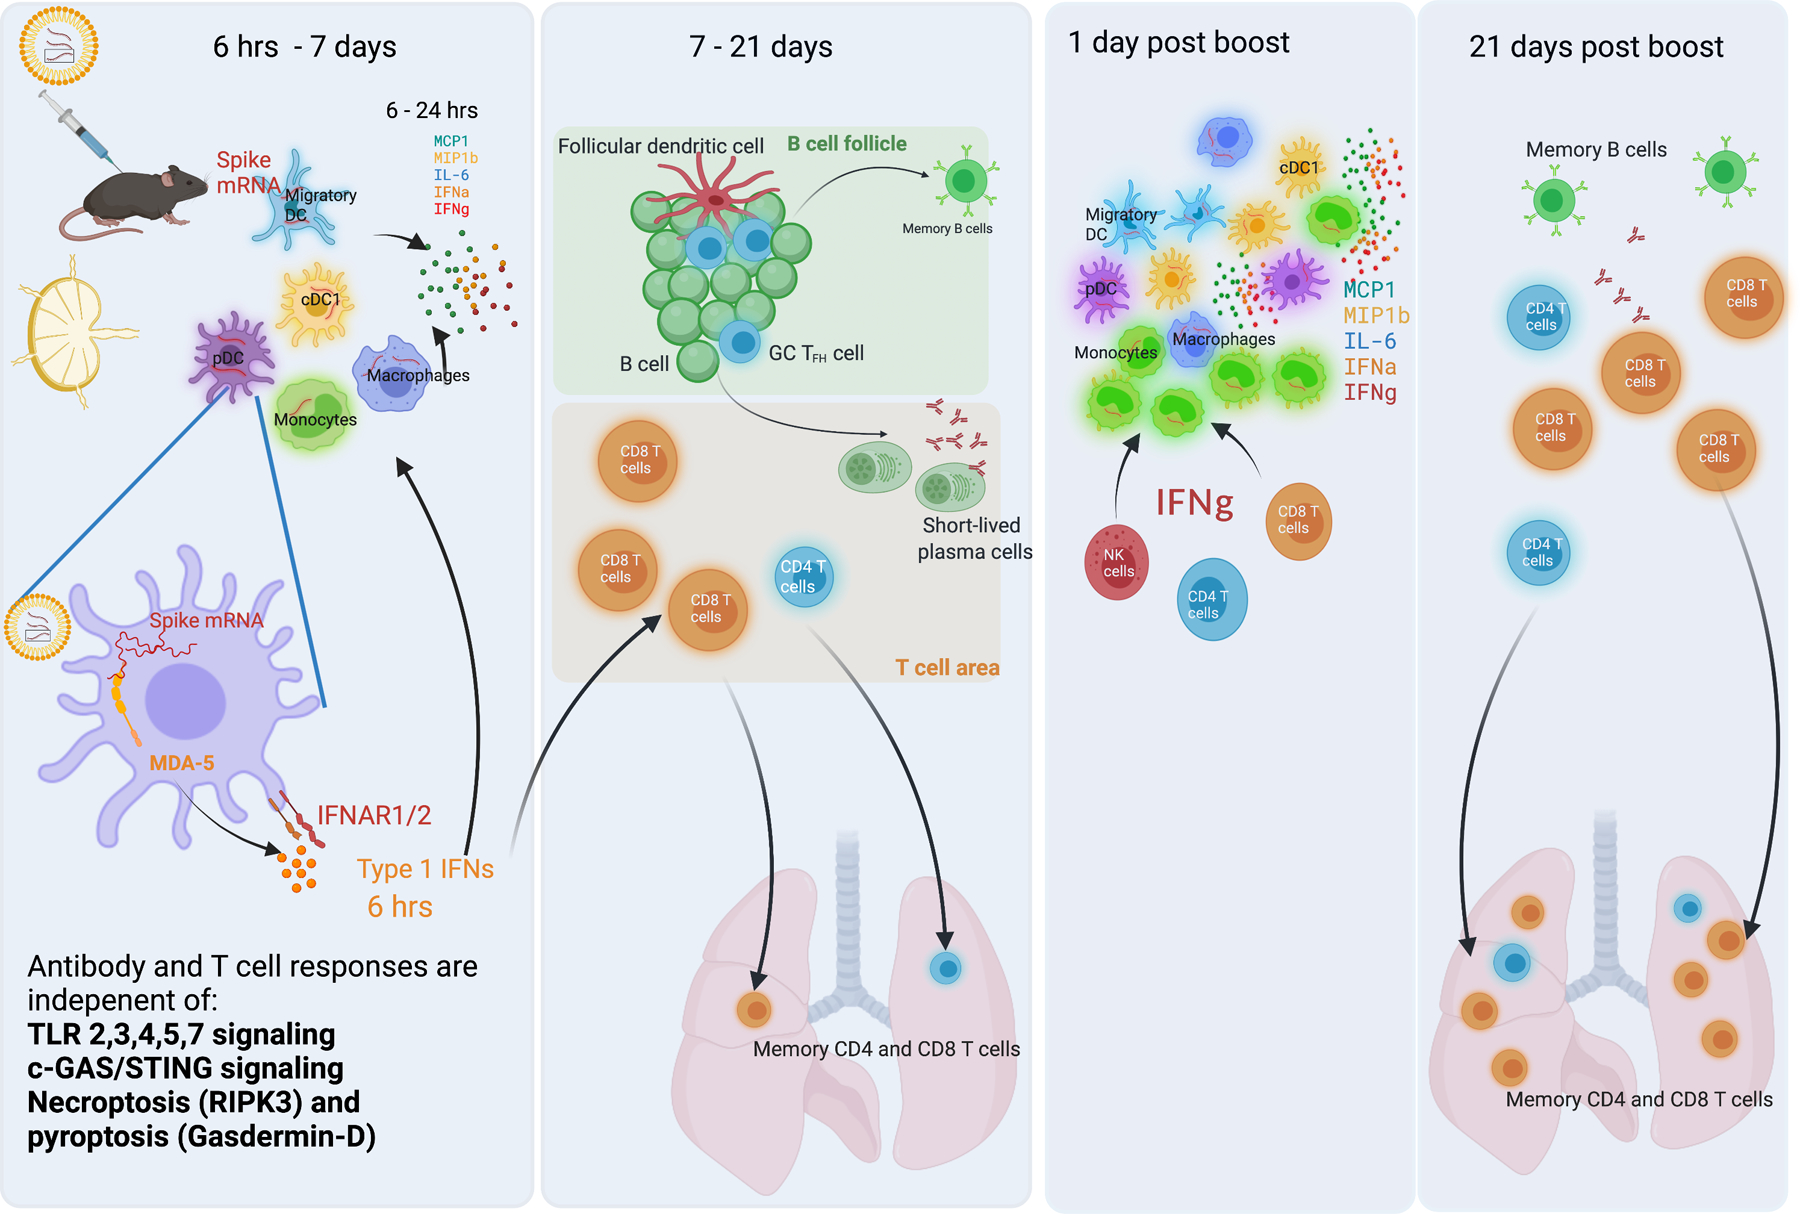
Despite the success of the BNT162b2 mRNA vaccine, the immunological mechanisms that underlie its efficacy are poorly understood. Here we analyzed the innate and adaptive responses to BNT162b2 in mice, and show that immunization stimulated potent antibody and antigen-specific T cell responses, as well as strikingly enhanced innate responses after secondary immunization, which was concurrent with enhanced serum interferon (IFN)-γ levels 1 d following secondary immunization. Notably, we found that natural killer cells and CD8+ T cells in the draining lymph nodes are the major producers of this circulating IFN-γ. Analysis of knockout mice revealed that induction of antibody and T cell responses to BNT162b2 was not dependent on signaling via Toll-like receptors 2, 3, 4, 5 and 7 nor inflammasome activation, nor the necroptosis or pyroptosis cell death pathways. Rather, the CD8+ T cell response induced by BNT162b2 was dependent on type I interferon-dependent MDA5 signaling. These results provide insights into the molecular mechanisms by which the BNT162b2 vaccine stimulates immune responses.


Conflict of interest statement

Competing Interests Statement

Bali Pulendran has served or is serving on the External Immunology Network of GSK, and on the scientific advisory board of Sanofi, Medicago, CircBio, Boehringer-Ingelheim. A.D.G. is a visiting scientist at Genentech, Inc. Other authors have declared no competing interests.

Figures

Extended Data Fig. 1
Extended Data Fig. 1. Immune response induced by low immunization dose in mice
a, S binding titers induced by low dose (0.2 μg/mouse) of BNT162b2 immunization measured by ELISA. b, Class I tetramer specific CD8 T cell response in lung and spleen tissue of mice measured at days 21 and 42 after BNT162b2 immunization (0.2 μg/mouse). c-d, Antigen specific CD8 (c) and CD4 (d) T cell response in lung and spleen tissue of mice detected at days 21 and 42 by intracellular cytokine staining (ICS) assay. e, Comparison between the activation of innate cells in dLNs induced by low (0.2 μg/mouse) and high immunization doses (5 μg/mouse). f, Cytokines/chemokines produced at 6 h post prime with low (0.2 μg/mouse) dose detected by Luminex assay. Data were combined from two independent experiments (a) or one representative experiment (b-f). One-Way ANOVA followed by Tukey’s test was applied (a-e). P-values were determined using Student’s t-tests (two-tailed) (f). *P<0.05, **P<0.01, ***P<0.001, ****P<0.0001.
Extended Data Fig. 2
Extended Data Fig. 2. Innate cells activated by BNT162b2
a, Gating strategy. b, Frequency of innate cells in live CD45+ cells after BNT162b2 immunization in dLNs. Data were combined from at least two independent experiments. One-Way ANOVA followed by Tukey’s test was applied in (b). *P<0.05, **P<0.01, ***P<0.001, ****P<0.0001.
Extended Data Fig. 3
Extended Data Fig. 3. scRNAseq analysis of immune response induced by BNT162b2 and YF-17D
a, Clusters and their associated cluster-specific genes. b, UMAP of cell types clustered by single-cell transcriptional analysis at indicated time. c, Significantly enriched interferon BTMs (false discovery rate [FDR]< 0.05, absolute normalized enrichment score [NES]> 2) across all clusters from days 1 to 7 after YF-17D immunization. Only clusters with a significantly modulated pathway are shown. d, Heatmap of key interferon response and AP-1 transcription factors after BNT162b2 immunization over time. Samples used for scRNAseq were pooled from three independent experiments containing 8–10 mice.
Extended Data Fig. 4
Extended Data Fig. 4. IFNγ production after prime and boost
a, Luminex assay of serum cytokines/chemokines at 6 h post-prime and boost with 5 μg/mouse and 0.2 μg/mouse, respectively. Data were combined from five mice for each group. b, Gating strategy to analyze IFNγ producing cells in dLNs. c-e, CD8+ and CD4+ T cell responses, and IgG titer at day 42 after blocking of IFNγ receptor. Mice were treated with IFNγ receptor neutralizing antibody or isotype control before boost at day 21. f, Serum IFNγ level at day 22 (1 day after boost) after T cells (CD4 and CD8 T cells) or NK cells depletion at day 21. g, Innate cell activation in spleen at 1 day post boost after T or NK cell depletion. P-values were determined using Student’s t-tests (two-tailed) (a, c-e), One-Way ANOVA (f), or Two-way ANOVA (g). *P<0.05, **P<0.01, ***P<0.001, ****P<0.0001.
Extended Data Fig. 5
Extended Data Fig. 5. Roles of TLRs for BNT162b2-induced antibody and T cell response
bAb and nAb titers of WT and Tlr3−/−, Tlr7−/− (a), bAb (IgG) titers of WT and Tlr2−/, Tlr4−/− (d), Tlr5−/− (g) mice at day 42. CD8+ T cell response in WT and Tlr3−/, Tlr7−/− (b-c), Tlr2−/−, Tlr4−/− (e-f), and Tlr5−/− (h-i) mice. Data were combined from two independent experiments. One-Way ANOVA followed by Tukey’s test was applied in (a-f). P-values in (g-i) were determined using Student’s t-tests (two-tailed). *P<0.05, **P<0.01.
Extended Data Fig. 6
Extended Data Fig. 6. Roles of inflammasome for BNT162b2-induced antibody and T cell response
a, IgG titers of WT, Asc−/−, and Nlrp3−/− mice at day 42. (b-c), CD8+ T cell response in WT, Asc−/−, and Nlrp3−/ mice. Data were combined from two independent experiments. One-Way ANOVA followed by Tukey’s test was applied. *P<0.05.
Extended Data Fig. 7
Extended Data Fig. 7. Role of cGAS and STING for BNT162b2-induced antibody and T cell response
a, IgG titers of WT, cGas−/−, and Sting−/− mice at day 42. (b-c), CD8+ T cell response in WT, cGas−/−, and Sting−/− mice. Data are one representative of two independent experiments. One-Way ANOVA followed by Tukey’s test was applied.
Extended Data Fig. 8
Extended Data Fig. 8. Role of cell death in BNT162b2-induced antibody and T cell response
a-c, DAMP signals including dsDNA (a), HMGB1 (b), and uric acid (c) induced by BNT162b2 immunization at the indicated time. d, IgG titers of littermate and Ripk3−/− mice at day 42. e-f, CD8+ T cell response in littermate and Ripk3−/− mice. g, IgG titers of littermate and Gsdmd−/− mice at day 42. h-i, CD8+ T cell response in littermate and Gsdmd−/− mice. Data were one representative of at least two independent experiments (a), or one representative experiment (b-i). One-Way ANOVA followed by Tukey’s test was applied in (a-c). P-values in (d-i) were determined using Student’s t-tests (two-tailed). *P<0.05, ***P<0.001, ****P<0.0001.
Extended Data Fig. 9
Extended Data Fig. 9. Role of MDA5 in BNT162b2-induced T cell response after prime
a-b, CD8+ T cell response in WT and Mda5−/− mice at indicated time post prime. P-values were determined using two-way ANOVA. ****P<0.0001.
Extended Data Fig. 10
Extended Data Fig. 10. Role of Batf3 in BNT162b2-induced antibody and T cell response
a, IgG titers of WT and Batf3−/− mice at day 42. b, CD8+ T cell response in WT and Batf3−/− mice. Data were one representative of three independent experiments. P-values were determined using Student’s t-tests (two-tailed). *P<0.05, **P<0.01.
Figure 1.
Figure 1.. BNT162b2 vaccine induces robust germinal center B cell and TFH response in mice.
a, Experimental timeline and tests. b, Serum anti-S IgG, IgG1a, and IgG2c binding titers detected by ELISA. c, Pseudo-typed lentivirus neutralization antibody titers against SARS-CoV-2 WT and variants of concern (B.1.429, B.1.1.7, B.1.351, P.1 and B.1.617.2) measured at days 21 and 42. n=10 mice per time point in b-c. d-f, Germinal center B cell (d), T follicular helper cell (e), and plasma cell (f) response after BNT162b2 immunization. n=11, 13, 16, 10 for day 0, 7, 14, 21, respectively. Data were combined from two or more independent experiments. One-Way ANOVA followed by Tukey’s test was applied in (b-f). *P<0.05, **P<0.01, ***P<0.001, ****P<0.0001. Differences between groups were considered significant for P-values < 0.05.
Figure 2.
Figure 2.. T cell response induced by BNT162b2 vaccination in mice.
a, Class I tetramer specific CD8 T cell responses in lung and spleen at days 21 and 42 after BNT162b2 immunization. b-c, Antigen-specific CD8+ T (b) and CD4+ T (c) cell response in lung and spleen at days 21 and 42 measured by FACS intracellular cytokine staining assay. d, Tissue-resident memory T cells in lung at days 21 and 42. Data were combined from two independent experiments. One-Way ANOVA followed by Tukey’s test was applied in (a-d). n=6 for day 0, n=10 for day 21 and day 42, respectively. *P<0.05, **P<0.01, ***P<0.001, ****P<0.0001.
Figure 3.
Figure 3.. BNT162b2 induces robust innate immune response in draining lymph nodes.
a, Activation of innate cells at day 1 after BNT162b2 immunization in dLNs indicated by activation marker CD86. b, Dynamics of innate cell activation at days 1, 3, and 7 after BNT162b2 immunization. n=20, 16, 7, 5 for day 0, 1, 3, and 7, respectively. c-d, Innate cell activation in contralateral lymph nodes (non-dLN) compared to that in dLNs (c), and in lung and spleen (d) at day 1 post-prime. n=5 for each group. e, Dynamics of cytokines in serum at 0, 6, 24 and 72 h after BNT162b2 immunization. n=10 for 0 and 6h, n=5 for 24h and 72h. Data were combined from at least two independent experiments (a, b, e) or one representative of two independent experiments (c, d). One-Way ANOVA followed by Tukey’s test was applied in (b-e). *P<0.05, **P<0.01, ***P<0.001, ****P<0.0001.
Figure 4.
Figure 4.. Single-cell transcriptional response induced by BNT162b2 and YF-17D immunization in dLNs.
a, Experimental design and timeline. b, UMAP of cell types clustered by single-cell transcriptional analysis of 52,788 cells after quality control. c, DEGs induced by BNT162b2 and YF-17D immunization at days 1, 3, and 7. d, Significantly enriched interferon and cell cycle BTMs (false discovery rate [FDR]< 0.05, absolute normalized enrichment score [NES]> 2) across all clusters from days 1 to 7 after BNT162b2 immunization. Only clusters with a significantly modulated pathway are shown. e, UMAP of subclusters in C2 (Mono_Macrophage) and C15 (Macrophage) after BNT162b2 and YF-17D immunization, respectively. f, Heatmap of key interferon response and AP-1 transcription factors after BNT162b2 immunization. Samples used for scRNAseq were pooled from three independent experiments containing 8–10 mice.
Figure 5.
Figure 5.. Enhanced innate immune response after boost is mediated by IFNγ production.
a, Serum IFNγ measured by ELISA at days 0, 0.3 (6 h post-prime), 21, and 21.3 (6 h post-boost). n=8 for each time point. b, Innate cell activation at days 0, 1, 21, and 22 after BNT162b2 immunization. n=5. c, Fold change of key interferon response genes and AP-1 transcription factors in monocytes at days 0, 1, and 22 after BNT162b2 immunization. d-e, Flow cytometry of cells producing IFNγ in dLNs at the indicated time. n=10 for day 0 and 1, n=7, 8 for day 21 and 22, respectively. f, Experimental design and timeline. g, Fold change of key interferon response genes and AP-1 transcription factors in IFNγRA neutralized group (αIFNγRA) against isotype (IgG) control. h, Innate cell activation at day 22 after IFNγRA neutralization. n=5 for IgG group, n=4 for αIFNγRA treated group. Data were combined from two independent experiments (a, e) or one representative of two independent experiments (b, c, g, h). One-Way ANOVA followed by Tukey’s test was applied in (a). P-values in (b, h) were determined using Student’s t-tests (two-tailed). Two-Way ANOVA followed by Tukey’s test was applied in (e). *P<0.05, **P<0.01, ***P<0.001, ****P<0.0001.
Figure 6.
Figure 6.. Uptake of BNT162b2 by DCs and macrophages in dLNs.
A, Distribution of S mRNA at the single-cell level (read >1/cell) from days 1 to 7 after BNT162b2 immunization. Cell clusters of UMAP are as shown in Fig. 4b. b, Percentage of cells with S mRNA reads in each cluster over time. c, Percentage of C2 and C4 in myeloid cells over time. d, Distribution of S mRNA in tissues at day 1 after BNT162b2 immunization measured by TaqMan based RT-PCR. n=5 for each tissue. e, S protein in mouse serum detected by ELISA. n=10 f, The BTMs associated with S mRNA signal in C2_Mono_Macrophage and C4_Migratory DC. g, The correlation between S mRNA signal and gene expression in BTM module M127 (Type I interferon response) in C2_Mono_Macrophage, and M16 (TLR and inflammatory signaling) in C4_Migratory DC, respectively. Samples used for scRNAseq were pooled from three independent experiments containing 8–10 mice. Data were one representative of two independent experiments (d) or combined from two independent experiments (e). One-Way ANOVA followed by Tukey’s test was applied in (e). ****P<0.0001.
Figure 7.
Figure 7.. MDA5-IFNAR1 axis is important for BNT162b2 induced CD8 T cell response.
a-b, bAb (a) and nAb (b) titers of WT and Mda5−/− mice at day 42. In (a), n=8 for WT, n=6 for Mda5−/−. In (b), n=9 for WT, n=8 for Mda5−/−. c, Class I tetramer specific CD8 T cell response in the lung and spleen of WT and Mda5−/− mice measured at Day 42 after BNT162b2 immunization as shown in Fig. 1a. d, Antigen-specific CD8 T cell response in lung and spleen of WT and Mda5−/ mice detected at day 42 by intracellular cytokine staining (ICS) assay. In (c-d), n=8 for WT, n=6 for Mda5−/−. e, Serum total IFNα levels in WT (n=5) and Mda5−/− (n=4) mice at 0, 6, 24, and 72 h measured by ELISA. f, Activation of innate cells in WT and Mda5−/− mice at day 1 post-prime. n=6 for each group. g, Class I tetramer specific CD8 T cell response in lung and spleen tissue of WT and Ifnar1−/− mice measured at day 42. For Lung, n=13 for WT, n=10 for Ifnar1−/−; for spleen, n=9 for WT, n=10 for Ifnar1−/−. h, Antigen-specific CD8 T cell response in lung and spleen of WT and Ifnar1−/− mice detected at day 42 by ICS assay. For Lung, n=8 for WT, n=10 for Ifnar1−/−; for spleen, n=9 for WT, n=10 for Ifnar1−/−. i, IgG titers of WT and Ifnar1−/− mice at day 42. N=5 for each group. j, Cytokines/chemokines in serum of WT and Ifnar1−/− mice measured by Luminex at 6 h measured by Luminex. k, Serum IFNα2/4 (IFNα2 and IFNα4) and IFNγ levels in WT and Ifnar1−/− mice at 6 h. n=5 for each group. l, Activation of innate cells in WT and Ifnar1−/− mice at day 1 post-prime. n=5 for each group. Data were combined from at least two independent experiments (b-d, g-h) or one representative experiment (a, e-f, i-l). P-values were determined using Student’s t-tests (two-tailed). *P<0.05, **P<0.01, ***P<0.001, ****P<0.0001.
Figure 8.
Figure 8.. Cartoon of mode of action of BNT162b2 in vivo.
a. At 6 hrs-7 days post-BNT162b2 prime, DCs and macrophages in dLNs take up the vaccine and express spike proteins. These innate cells are highly activated and produce cytokines, including IL-6, IFNα, IFNγ, MCP1, and MIP1b. In this process, the MDA5-IFNAR1 signaling pathway is essential for IFNα production and innate cell activation. b, At days 7 to 21, strong GC B and TFH responses are induced in B cell follicle. CD8 T cell response is increased mildly in both spleen and lung tissue. c, At days 1 to 3 days post-boost, much more IFNγ is produced by NK, CD4, and CD8 T cells, contributing to the enhanced innate cell activation after boost. d, At 21 days post-boost, the antibody response, CD4, and CD8 T cell responses increase significantly. The MDA5-IFNAR1 signaling pathway is essential for CD8 T cell response in both spleen and lung tissue.

Comment in

References

    1. Polack FP et al. Safety and Efficacy of the BNT162b2 mRNA Covid-19 Vaccine. N Engl J Med 383, 2603–2615 (2020). - PMC - PubMed
    1. Walsh EE et al. Safety and Immunogenicity of Two RNA-Based Covid-19 Vaccine Candidates. N Engl J Med 383, 2439–2450 (2020). - PMC - PubMed
    1. Kariko K et al. Incorporation of pseudouridine into mRNA yields superior nonimmunogenic vector with increased translational capacity and biological stability. Mol Ther 16, 1833–1840 (2008). - PMC - PubMed
    1. Kariko K, Buckstein M, Ni H & Weissman D Suppression of RNA recognition by Toll-like receptors: the impact of nucleoside modification and the evolutionary origin of RNA. Immunity 23, 165–175 (2005). - PubMed
    1. Turner JS et al. SARS-CoV-2 mRNA vaccines induce persistent human germinal centre responses. Nature 596, 109–113 (2021). - PMC - PubMed

Publication types