. 2022 May;9(14):e2103241.
doi: 10.1002/advs.202103241. Epub 2022 Mar 14.

Ectopic Lymphoid Follicle Formation and Human Seasonal Influenza Vaccination Responses Recapitulated in an Organ-on-a-Chip

Affiliations

Ectopic Lymphoid Follicle Formation and Human Seasonal Influenza Vaccination Responses Recapitulated in an Organ-on-a-Chip

Girija Goyal et al. Adv Sci (Weinh). 2022 May.

Abstract

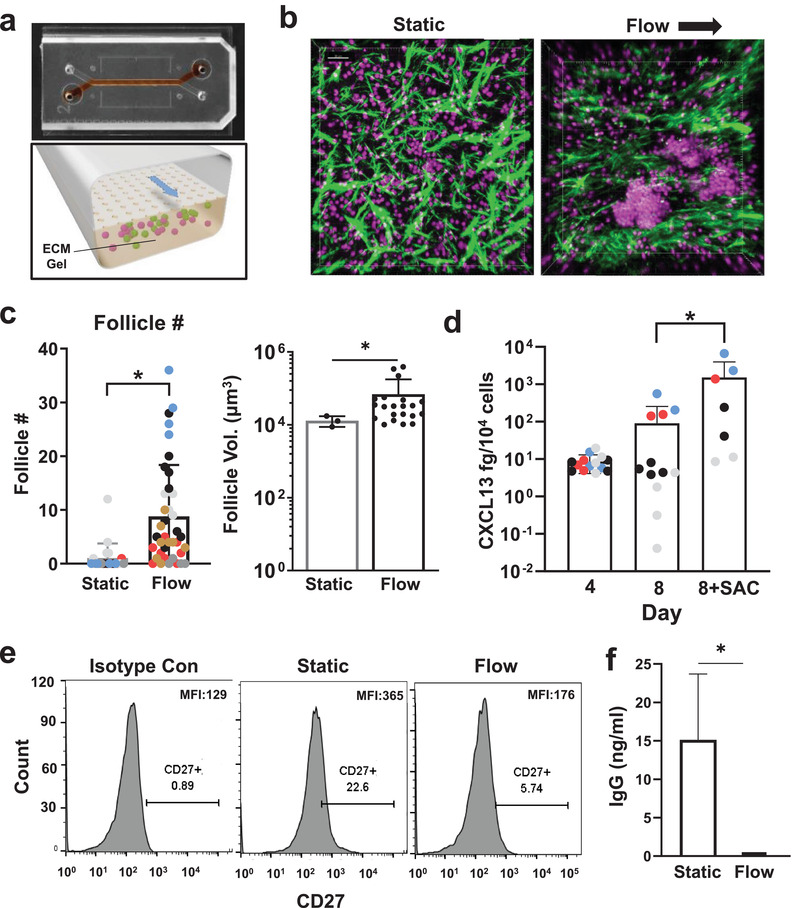
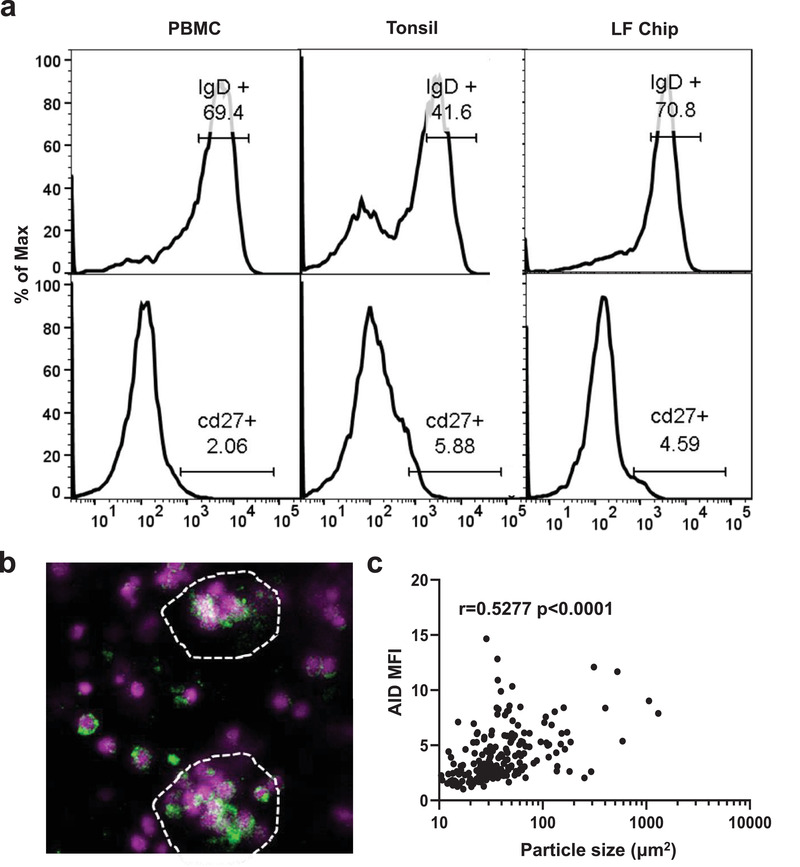
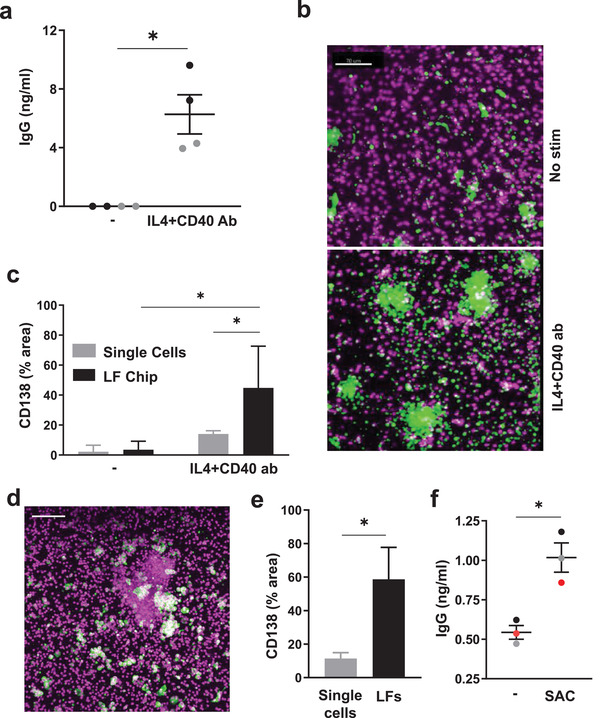
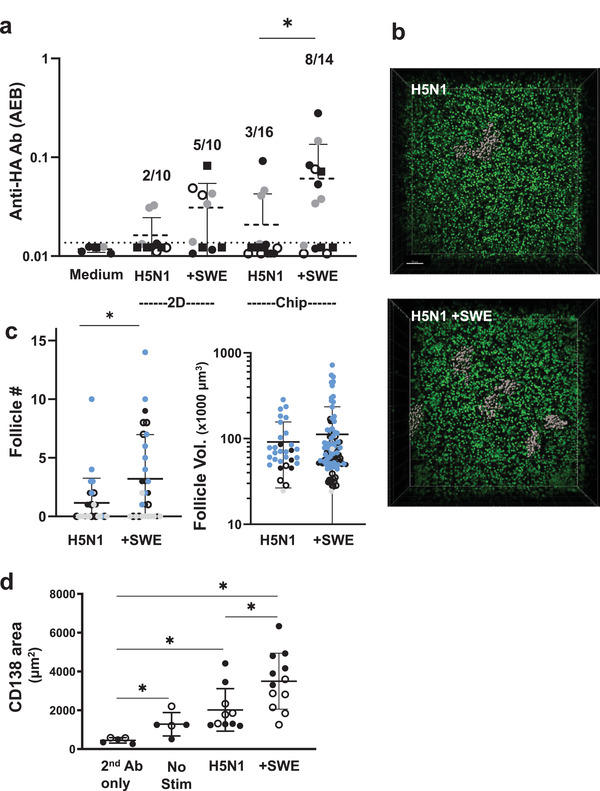
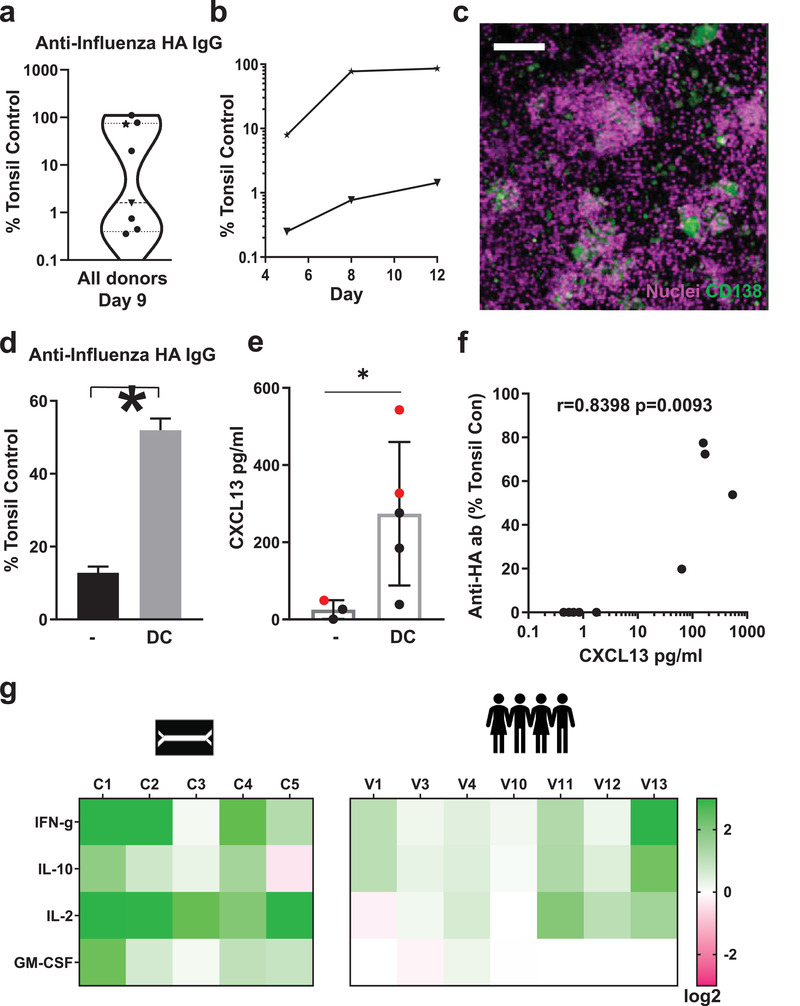
Lymphoid follicles (LFs) are responsible for generation of adaptive immune responses in secondary lymphoid organs and form ectopically during chronic inflammation. A human model of ectopic LF formation will provide a tool to understand LF development and an alternative to non-human primates for preclinical evaluation of vaccines. Here, it is shown that primary human blood B- and T-lymphocytes autonomously assemble into ectopic LFs when cultured in a 3D extracellular matrix gel within one channel of a two-channel organ-on-a-chip microfluidic device. Superfusion via a parallel channel separated by a microporous membrane is required for LF formation and prevents lymphocyte autoactivation. These germinal center-like LFs contain B cells expressing Activation-Induced Cytidine Deaminase and exhibit plasma cell differentiation upon activation. To explore their utility for seasonal vaccine testing, autologous monocyte-derived dendritic cells are integrated into LF Chips. The human LF chips demonstrate improved antibody responses to split virion influenza vaccination compared to 2D cultures, which are enhanced by a squalene-in-water emulsion adjuvant, and this is accompanied by increases in LF size and number. When inoculated with commercial influenza vaccine, plasma cell formation and production of anti-hemagglutinin IgG are observed, as well as secretion of cytokines similar to vaccinated humans over clinically relevant timescales.

Keywords: antibody; germinal center; lymph node; organ chip; vaccine.


Conflict of interest statement

D.E.I. is a founder, board member, scientific advisory board chair, and equity holder in Emulate, Inc.; G.G. and D.E.I. are co‐inventors on relevant patent applications. D.R.W. is a founder and has a financial interest in Quanterix Corporation and serves on its Board of Directors.

Figures

Figure 1
Figure 1
Perfusion induces follicle formation in the human LF chip. a) Photograph (top) of the 2‐channel Organ Chip device used to create the human LF Chip with red dye filling the lower microchannel and a schematic of a cross‐section of the device (bottom) showing how the lower channel is filled with an ECM gel containing human lymphocytes, which are fed through the porous membrane separating the channels by medium that is flowed through the upper channel. b) Second harmonic images of ECM fibrils (green) combined with fluorescence images of Hoechst stained nuclei (magenta) of human lymphocytes growing at high density within ECM gels maintained within the lower channel of the LF Chip either under static conditions (Static) or with dynamical perfusion (Flow; arrow indicates direction) (bar, 30 µm). c) Quantification of LF number (Follicle #) and volume (Follicle Vol.) in 3D ECM gels that are cultured statically (Static) or with active perfusion (Flow) in Organ Chips for 4 days. Different colored data points indicate different donors (n = 6) and each point represents follicle numbers (left) per field of view from >2 chips. The volume for each follicle observed under Static or Flow is reported for one representative donor (right). Similar differences in follicle size are observed in two additional donors. Error bars indicate standard deviation (SD); *, p < 0.05 using an unpaired Student's t‐test with Welch's correction. d) Secreted CXCL13 protein detected within the effluent of the LF Chip cultured for 4 or 8 days in the presence or absence of SAC antigen using a Simoa assay. Different colored data points indicate different donors (n = 4) and each point represents an individual chip. Error bars indicate SD; *, p < 0.05 using one way ANOVA is conducted to identify any significant differences followed by the Fisher's LSD test. e) CD27 expression on B cells assessed by flow cytometry in isotype controls (left), static culture (middle), and the perfused LF chip (right). Representative results displayed 1 chip from one donor, and similar results are obtained with 2 chips using cells from two different donors; the percentage of cells in the positive peak is indicated below CD27+ in each graph. MFI is shown at the top left of the histograms. f) IgG levels determined by ELISA (limit of detection = 49 pg mL−1) and normalized for culture volume in static culture (Static) versus perfused LF chips (Flow) in 2 chips each from 2 donors (n = 4). Error bars indicate SD; *p < 0.05 using an unpaired Student's t‐test with Welch's correction.
Figure 2
Figure 2
B cells remain quiescent yet express AID in LFs formed on‐chip. a) Representative flow cytometric characterization of B cells stained for IgD and CD27 in the initial PBMC sample (PBMC; n = 3) compared with cells from explanted tonsils (Tonsil; n = 2), or cells cultured in the LF chip for 4 days (LF Chip; n = 3). The percentage of cells in the positive peak is indicated above the gate drawn on the histogram. b) Representative confocal immunofluorescence micrograph showing AID expression (green) in B cells cultured in the LF chip for 4 days (similar results are obtained with 4 donors); Hoechst stained nuclei in the lymphocytes are shown in blue. c) Quantification of AID expression levels in 183 particles ranging from single cell sized regions‐of‐interest to large follicles from 4 independent fields of view measured as MFI plotted as a function of particle size (Particle area) in perfused Organ Chips cultured for 4 days. Each data point represents 1 particle and particles from 4 images from the LF chips created from one representative donor shown. Similar results obtained in 3 additional donors. Non‐parametric Spearman correlation shown.
Figure 3
Figure 3
B cells exhibit class switching and undergo plasma cell formation in the LF chip. a) Total IgG production measured in the effluents of LF chips when engineered with naïve B cells and bulk T cells after 6 days culture in the presence or absence (‐) of IL4 and anti‐CD40 Ab Each dot indicates results from an individual chip (n = 2) created with cells from two donors (black and gray); *, p < 0.05 using an unpaired Student's t‐test with Welch's correction. b) Immunofluorescence micrographs showing cells in unstimulated LF chips (No stim.) or chips treated with IL4 and anti‐CD40 Ab stained for CD138 (green) and nuclei (magenta); similar results are obtained with cells from 3 different donors. c) Quantification of CD138 expression in single cells (gray bars) versus cells located within LFs (black bars) in the same LF chips. Error bars indicate SD based on analysis of 5 randomly selected fields from 1 donor, and similar results are obtained with LF Chips containing cells from 3 different donors. *, p < 0.05 using a two way ANOVA to identify any significant differences followed by the Fisher's LSD test. d) Immunostaining for CD138 (green) and nuclei (magenta) in SAC‐treated LF Chips (similar results obtained with 3 donors; bar 100 µm). e) CD138 levels measured as a % of projected area labeled for CD138 in lone cells (Single Cells) versus cells in follicles (LFs) within ECM gels in perfused Organ Chips. Results shown are from 5 randomly selected fields from 1 LF Chip created with cells from one donor, and similar results are obtained with cells from 3 different donors. Error bars indicate SD; * p < 0.05 using an unpaired Student's t‐test with Welch's correction. f) Total IgG levels measured in the effluent of LF Chips 3 days after treatment with SAC. Each colored dot indicates results from one chip from each of 3 different donors. Error bars indicate standard error of mean (SEM); p < 0.05 using an unpaired Student's t‐test.
Figure 4
Figure 4
Vaccine and adjuvant‐induced Ab production and follicle formation in the human LF chip. a) Anti‐HA Ab signal detected in the effluents of the LF Chips (Chip) or in the medium of cells maintained in 2D culture (2D) for 9 days using the Simoa digital ELISA when unstimulated (Medium) or stimulated with H5N1 antigen alone (H5N1) or with SWE (+SWE). Each data point indicates one well or chip; different colored points indicate chips or wells from 4 independent donors. The fraction of total samples that exhibited anti‐HA Ab signal >LOD is indicated in the text above the points. Simoa values are presented as average enzyme per bead (AEB) and error bars indicate SD. Statistical differences are tested using the Kruskal‐Wallis test followed by pair‐wise testing using the uncorrected Dunn's test); p < 0.05. b) A 3D confocal microscopic stack view showing pseudocolored follicles (grey) and cell nuclei (green) present within ECM gels cultured for 3 days within a perfused LF Chip when vaccinated with split H5N1 influenza antigen (H5N1) in the absence or presence of SWE adjuvant (H5N1 + SWE); bar, 50 µm. c) Graph showing quantification of the number (left) and size (right) of follicles observed in LF Chips generated with cells from 4 different donors indicated by different colored symbols. Each data point indicates one field of view (follicle #, n > 26) or one individual follicle (follicle vol., n > 30); error bars indicate SD; *, p < 0.05 using an unpaired Student's t‐test with Welch's correction. d) Graph showing quantification of the CD138+ area observed in LF Chips generated with cells from two different donors (open and filled squares); Each data point indicates one field of view; * p < 0.05, using a Brown‐Forsythe one way ANOVA followed by unpaired t‐test with Welch's correction for unequal variances.
Figure 5
Figure 5
Influenza vaccination in vitro in the human LF chip. a) Violin plot of anti‐HA IgG levels that are specific to the Brisbane 59 H1N1 strain (Anti‐HA IgG) in the effluent of LF Chips 9 days after vaccination with Fluzone presented relative to levels measured in a vaccinated culture of tonsillar cells (Tonsillar Control), as detected using a digital ELISA. Each data point represents average of 2–6 chips created with cells from one donor (total 8 donors tested). b) Time course of anti‐HA IgG secretion measured in chip effluents over 5 to 12 days of culture using LF Chips containing cells from representative donors from the high (★) and low (▼) Ab producer groups shown in a. c) Immunofluorescence micrograph showing CD138 staining (green) in a Fluzone‐stimulated LF Chip containing cells (nuclei, magenta) from a high anti‐HA Ab producer (similar results are obtained with 3 different high Ab producer donors; bar, 100 µm). d) Anti‐HA Ab levels that are specific to the Brisbane 59 H1N1 strain in the effluent of LF Chips with or without DCs, 9 days after vaccination, as detected by a digital ELISA, presented relative to levels measured in a culture of tonsillar cells. Mean levels from 3 replicate measurements from one chip generated from one donor are shown, and similar results are obtained in LF Chips created with cells from two different donors. Error bars indicate SD; *, p < 0.05 using an unpaired Student's t‐test with Welch's correction. e) CXCL13 levels in the effluent of the LF chip with or without DCs, 5 days after vaccination, as detected by a digital ELISA. Each colored dot represents one chip with cells from two different donors (black and red dots, n ≥ 3). Error bars indicate SD; *, p < 0.05 using an unpaired Student's t‐test with Welch's correction. f) Levels of anti‐HA Ab specific to the Brisbane 59 H1N1 strain in the effluent of LF chips at day 9 plotted relative to CXCL13 levels 5 days after vaccination. Results from 5 donors are shown with each dot representing an individual chip (n = 9); an analysis of the non‐parametric Spearman correlation between CXCL13 and IgG levels are in Graphpad Prism is shown. g) Heat map of the fold change (Log2) in the levels of cytokines (IFN‐γ, IL‐10, IL‐2, GM‐CSF) measured using a digital ELISA in effluents of LF chips generated with cells from 5 different donors, 3 days after vaccination (C1‐5) compared to unvaccinated chips, and to levels measured in peripheral blood from 7 individuals (V1, 3, 4, 10–13) 1 day after vaccination as compared to their prevaccination levels.

References

    1. Seok J., Warren H. S., Cuenca A. G., Mindrinos M. N., Baker H. V., Xu W., Richards D. R., McDonald‐Smith G. P., Gao H., Hennessy L., Finnerty C. C., López C. M., Honari S., Moore E. E., Minei J. P., Cuschieri J., Bankey P. E., Johnson J. L., Sperry J., Nathens A. B., Billiar T. R., West M. A., Jeschke M. G., Klein M. B., Gamelli R. L., Gibran N. S., Brownstein B. H., Miller‐Graziano C., Calvano S. E., Mason P. H., et al., Proc. Natl. Acad. Sci. USA 2013, 110, 3507. - PMC - PubMed
    1. Eastwood D., Findlay L., Poole S., Bird C., Wadhwa M., Moore M., Burns C., Thorpe R., Stebbings R., Br. J. Pharmacol. 2010, 161, 512. - PMC - PubMed
    1. Tameris M. D., Hatherill M., Landry B. S., Scriba T. J., Snowden M. A., Lockhart S., Shea J. E., Mcclain J. B., Hussey G. D., Hanekom W. A., Mahomed H., Mcshane H., Lancet 2013, 381, 1021. - PMC - PubMed
    1. Cabrita R., Lauss M., Sanna A., Donia M., Skaarup Larsen M., Mitra S., Johansson I., Phung B., Harbst K., Vallon‐Christersson J., Van Schoiack A., Lövgren K., Warren S., Jirström K., Olsson H., Pietras K., Ingvar C., Isaksson K., Schadendorf D., Schmidt H., Bastholt L., Carneiro A., Wargo J. A., Svane I. M., Jönsson G., Nature 2020, 577, 561. - PubMed
    1. Muramatsu M., Kinoshita K., Fagarasan S., Yamada S., Shinkai Y., Honjo T., Cell 2000, 102, 553. - PubMed

Publication types

LinkOut - more resources