. 2022 Mar 15;132(6):e154074.
doi: 10.1172/JCI154074.

A CGA/EGFR/GATA2 positive feedback circuit confers chemoresistance in gastric cancer

Affiliations

A CGA/EGFR/GATA2 positive feedback circuit confers chemoresistance in gastric cancer

Tianyu Cao et al. J Clin Invest. .

Abstract

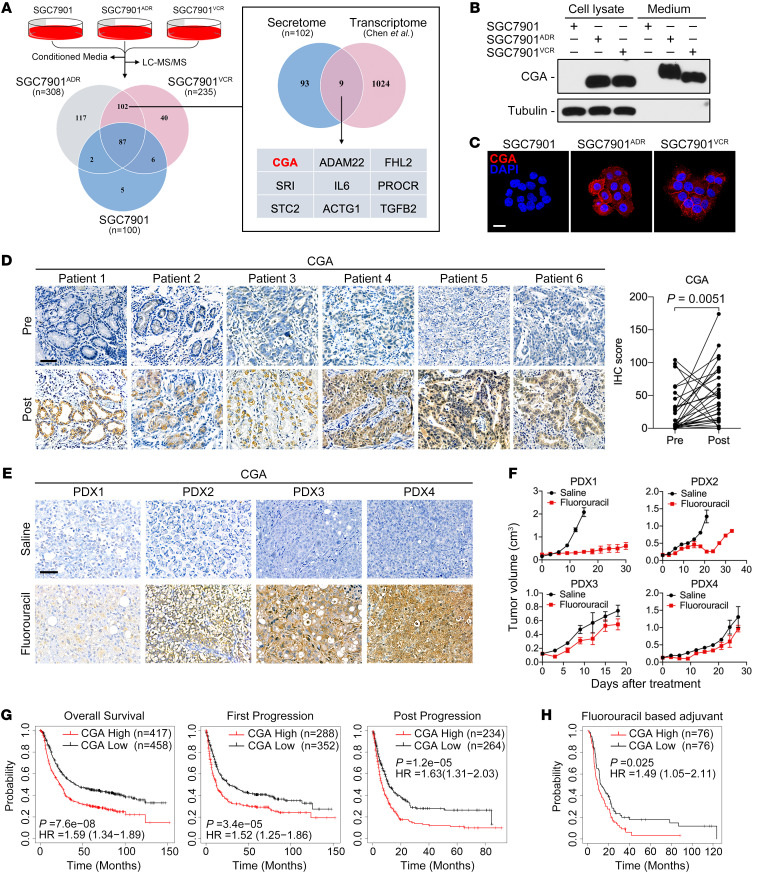
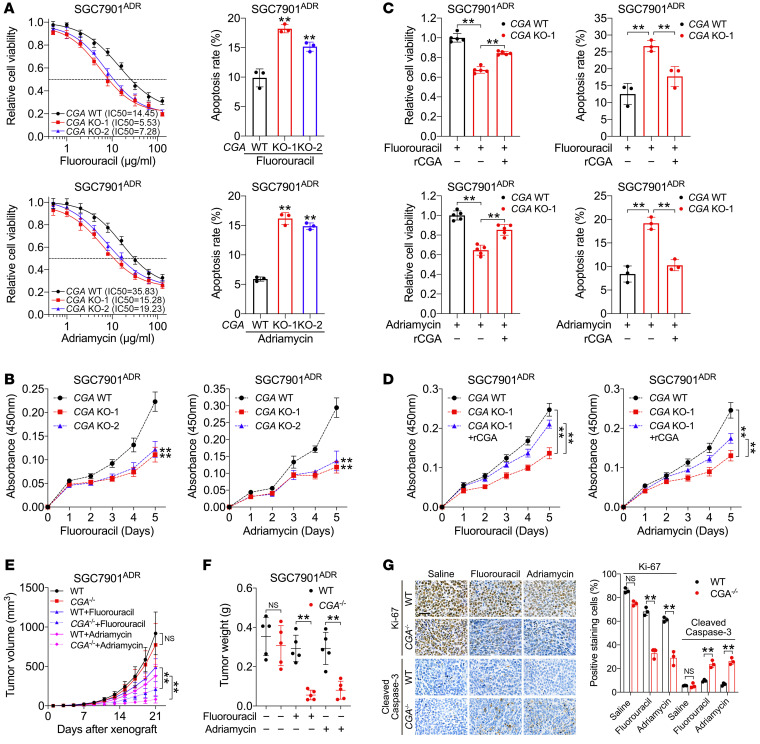
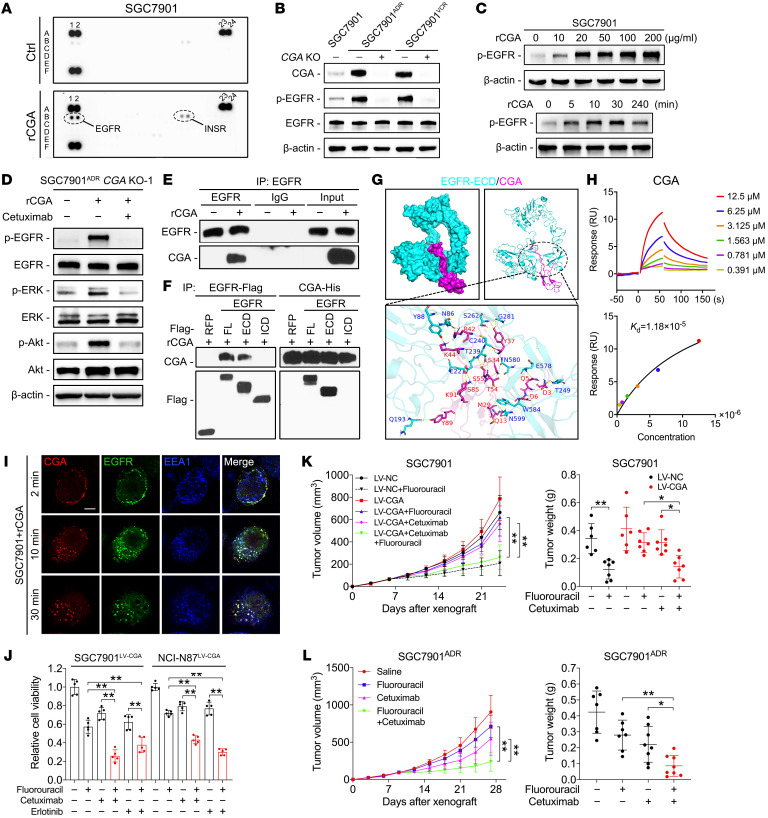
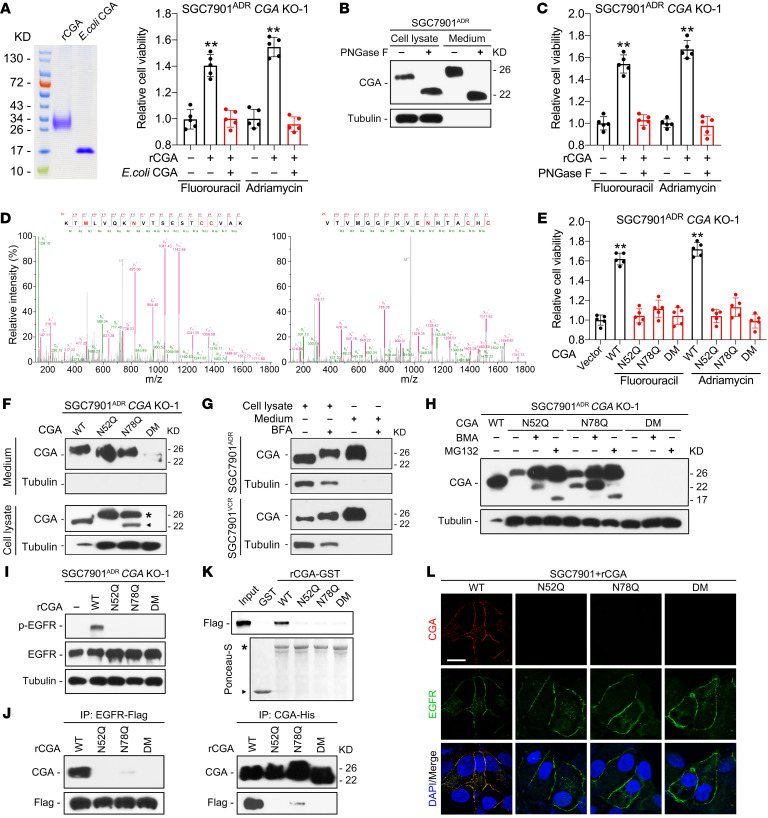
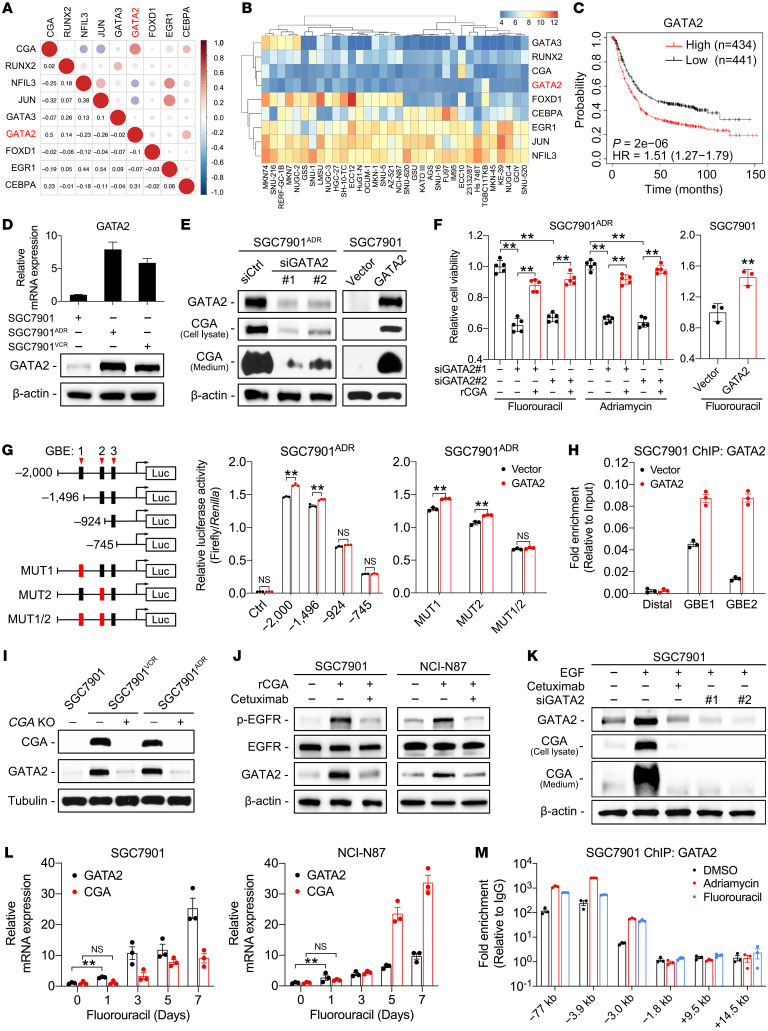
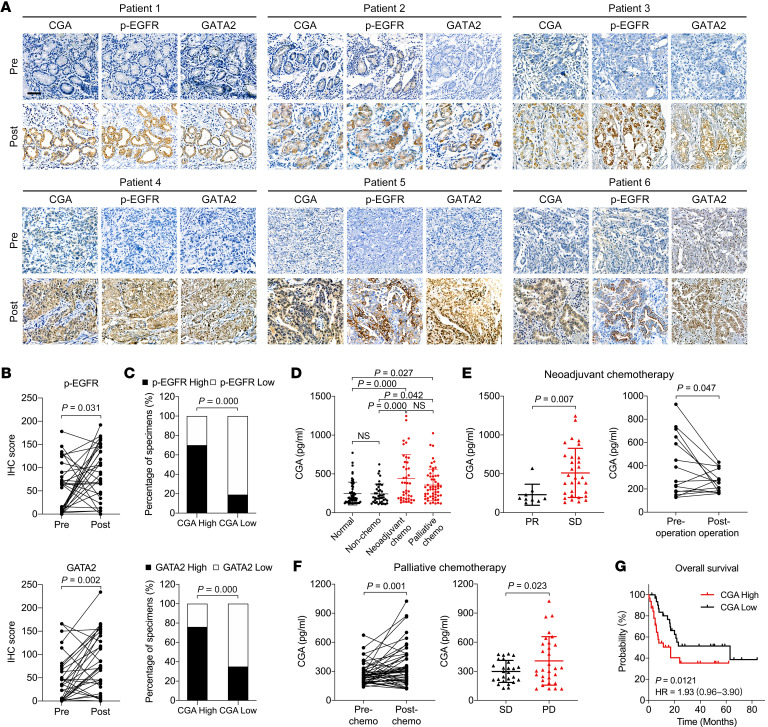
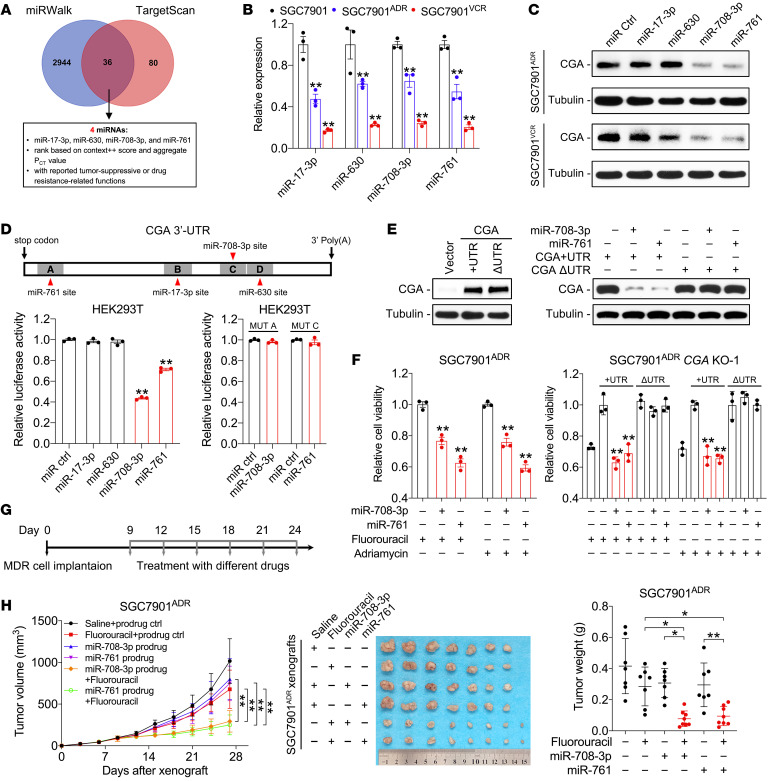
De novo and acquired resistance are major impediments to the efficacy of conventional and targeted cancer therapy. In unselected gastric cancer (GC) patients with advanced disease, trials combining chemotherapy and an anti-EGFR monoclonal antibody have been largely unsuccessful. In an effort to identify biomarkers of resistance so as to better select patients for such trials, we screened the secretome of chemotherapy-treated human GC cell lines. We found that levels of CGA, the α-subunit of glycoprotein hormones, were markedly increased in the conditioned media of chemoresistant GC cells, and CGA immunoreactivity was enhanced in GC tissues that progressed on chemotherapy. CGA levels in plasma increased in GC patients who received chemotherapy, and this increase was correlated with reduced responsiveness to chemotherapy and poor survival. Mechanistically, secreted CGA was found to bind to EGFR and activate EGFR signaling, thereby conferring a survival advantage to GC cells. N-glycosylation of CGA at Asn52 and Asn78 is required for its stability, secretion, and interaction with EGFR. GATA2 was found to activate CGA transcription, whose increase, in turn, induced the expression and phosphorylation of GATA2 in an EGFR-dependent manner, forming a positive feedback circuit that was initiated by GATA2 autoregulation upon sublethal exposure to chemotherapy. Based on this circuit, combination strategies involving anti-EGFR therapies or targeting CGA with microRNAs (miR-708-3p and miR-761) restored chemotherapy sensitivity. These findings identify a clinically actionable CGA/EGFR/GATA2 circuit and highlight CGA as a predictive biomarker and therapeutic target in chemoresistant GC.

Keywords: Gastric cancer; Gastroenterology; Oncogenes; Oncology.


Conflict of interest statement

Conflict of interest: The authors have declared that no conflict of interest exists.

Figures

Figure 1
Figure 1. CGA is upregulated in chemoresistant GC cells and tissues.
(A) Quantitative analysis comparing secretomes of SGC7901 and MDR cells. Venn diagram of the secreted proteins identified in indicated cells (left) and the overlap between upregulated genes in the secretome and transcriptome of MDR cells (right). (B and C) Immunoblotting (B) and representative IF images (C) of CGA in SGC7901 and MDR cells. Scale bar: 20 μm. (D) IHC staining of CGA in 6 representative nonresponsive human GC specimens (n = 31) obtained before and after chemotherapy. Scale bar: 50 μm. The IHC scores of CGA are shown. P value was calculated by Wilcoxon’s matched-pairs signed-rank test. (E and F) Mice with subcutaneous GC PDXs (n = 3–5) received indicated treatment every 3 days (fluorouracil, 60 mg/kg, i.p. injection). IHC staining of CGA in PDXs was performed (E) and corresponding tumor growth curves are shown (F). Data are presented as mean ± SEM. (G and H) Kaplan-Meier analyses of correlations between CGA expression and overall survival, first-progression or post-progression survival of GC patients (G) and between CGA expression and overall survival of GC patients who received fluorouracil-based adjuvant therapy (H) in the KM plotter database.
Figure 2
Figure 2. CGA is important to maintain chemoresistance in GC cells.
(A) IC50 values and apoptosis of CGA-WT and -KO SGC7901ADR cells treated with fluorouracil (10 μg/mL) or Adriamycin (10 μg/mL). (B) Growth curves of CGA-WT and -KO SGC7901ADR cells treated with chemotherapy. (C and D) Viability, apoptosis (C), and growth curves (D) of CGA-WT and -KO SGC7901ADR cells treated with or without rCGA (20 μg/mL) and chemotherapy. (EG) CGA-WT and -KO SGC7901ADR cells were injected subcutaneously into nude mice (n = 5). After tumors were palpable, mice received indicated treatment every 3 days (fluorouracil, 20 mg/kg, i.p. injection; Adriamycin, 8 mg/kg, i.p. injection). Tumor volume (E) and tumor weight (F) were measured. Ki-67 and cleaved caspase-3 staining and percentage in tumors is shown (G). Scale bar: 50 μm. Data are presented as mean ± SEM. **P < 0.01 by 1-way ANOVA with Dunnett’s multiple-comparison test (AD), repeated-measures ANOVA test (E), or by Student’s t test (F and G).
Figure 3
Figure 3. CGA functions by binding to EGFR and activating EGFR downstream signaling in GC cells.
(A) Human phosphorylated RTK antibody array in SGC7901 cells serum starved for 12 hours and then treated with rCGA for 30 minutes. (B) Immunoblotting of CGA, EGFR, and p-EGFR in indicated serum-starved cells. (C) Immunoblotting of p-EGFR in serum-starved SGC7901 cells treated with indicated concentrations of rCGA (top) or treated with rCGA (20 μg/mL) at different time points (bottom). (D) Immunoblotting with indicated antibodies of lysates from CGA–/– SGC7901ADR cells that were pretreated with cetuximab (10 μg/mL) followed by rCGA treatment. (E) Immunoblotting of lysates from SGC7901 cells that were incubated with rCGA and immunoprecipitated with anti-EGFR antibody or normal IgG. (F) Immunoblotting of lysates from SGC7901 cells transfected with Flag-tagged RFP or EGFR containing FL, ECD, or ICD plasmids, treated with purified His-tagged rCGA, and subjected to anti-Flag and anti-His immunoprecipitation. (G) Molecular docking analysis of CGA to the ECD of EGFR. (H) SPR analysis of the interaction between CGA and the ECD of EGFR. Raw response (RU) curves (top) from a representative experiment were fitted to a 1-site-specific kinetic model (bottom) to derive on and off rates and a Kd value for the interaction. (I) IF staining of CGA, EGFR, and early endosome marker EEA1 in SGC7901 cells treated with rCGA at 37°C for a 30-minute time course. Scale bar: 10 μm. (J) Viability of SGC7901 and NCI-N87 cells stably expressing CGA, treated with fluorouracil, cetuximab, erlotinib (20 nM), or their combination. (K and L) SGC7901 cells stably expressing CGA and control SGC7901 cells (K) or SGC7901ADR cells (L) were injected subcutaneously into nude mice (n = 6–8). When the tumor size reached 100 mm3, mice received indicated treatment every 3 days (fluorouracil, 20 mg/kg, i.p. injection; cetuximab, 1 mg/mouse, i.p. injection). Tumor volume and tumor weight were measured. Data are presented as mean ± SEM. *P < 0.05; **P < 0.01 by 1-way ANOVA with Bonferroni’s post hoc test (JL) or by repeated-measures ANOVA with Bonferroni’s post hoc test (K and L).
Figure 4
Figure 4. N-glycosylation is required for CGA-induced chemoresistance.
(A) Left: SDS-PAGE of purified CGA from HEK293FT cells (rCGA) and E. coli (E. coli CGA). Right: Viability of CGA–/– SGC7901ADR cells treated with rCGA or E. coli CGA and chemotherapy. (B and C) Immunoblotting of lysate and conditioned medium from PNGase F–treated SGC7901ADR cells (B), with viability measured in indicated cells treated with chemotherapy (C). (D) MS/MS spectra of CGA secreted by SGC7901ADR cells shows 2 N-glycosylation sites, Asn52 (left) and Asn78 (right), in CGA. N in red indicates the glycosylation sites. (E) Viability of CGA–/– SGC7901ADR cells transfected with WT, N52Q, N78Q, or N52Q/N78Q double mutant (DM) CGA and treated with chemotherapy. (F) Immunoblotting of lysates and conditioned medium CGA from CGA–/– SGC7901ADR cells transfected with WT, N52Q, N78Q, or DM CGA. Asterisk and arrowhead indicate CGA band shifts. (G) Immunoblotting of lysate and conditioned medium CGA from MDR cells treated with BFA (5 nM). (H) Immunoblotting of CGA from CGA–/– SGC7901ADR cells transfected with WT, N52Q, N78Q, or DM CGA and treated with BMA (1 μM) or MG132 (10 μM). (I) Immunoblotting of p-EGFR and EGFR in CGA–/– SGC7901ADR cells treated with purified WT, N52Q, N78Q, or DM rCGA. (J) Immunoblotting of lysates from SGC7901 cells transfected with Flag-tagged EGFR were incubated with purified His-tagged CGA after immunoprecipitation with anti-Flag and anti-His antibodies. (K) Top: Immunoblotting for Flag of bound proteins after GST or GST fusion proteins were incubated with equal amounts of lysates from Flag-tagged EGFR-ECD–expressing HEK293T cells. Bottom: Ponceau-S staining to detect bait proteins. Arrowhead and asterisk indicate GST and GST fusion proteins, respectively. (L) IF staining of CGA, EGFR, and DAPI staining in SGC7901 cells treated with WT, N52Q, N78Q, or DM rCGA for 10 minutes at 4°C. Scale bar: 10 μm. Data are presented as mean ± SEM. **P < 0.01 by 1-way ANOVA with Dunnett’s multiple-comparison test (A, C, and E).
Figure 5
Figure 5. Reciprocal positive regulation between GATA2 and CGA/EGFR signaling.
(A and B) Correlations between CGA and TFs in KM plotter (A) and CCLE (B) databases. Data evaluated using Pearson’s correlation coefficient. (C) Kaplan-Meier analysis of correlation between GATA2 expression and overall survival of GC patients using the KM plotter database. (D) RT-qPCR and immunoblotting of GATA2 in MDR and SGC7901 cells. (E and F) Immunoblotting of GATA2 and CGA in MDR cells transfected with 2 independent siRNAs against GATA2 (siGATA2) or a control siRNA (siCtrl) and in SGC7901 cells transfected with a GATA2 expression vector or empty vector (E). Viability was measured in the indicated cells treated with chemotherapy (F). (G) Left: Diagram of consecutive deletion and mutation constructs spanning the CGA promoter. GBE mutations shown in red boxes. Right: Luciferase reporter driven by the WT, deletion, or mutant (MUT) promoter was transfected into SGC7901ADR cells. Luciferase activity was measured with or without GATA2 cotransfection. (H) ChIP with anti-GATA2 antibody in SGC7901 cells with or without GATA2 transfection. (IK) Immunoblotting of CGA, GATA2, EGFR, and p-EGFR in indicated cells. (L) GATA2 and CGA expression in SGC7901 and NCI-N87 cells treated with low concentrations of fluorouracil (1 μg/mL) for the indicated times. (M) ChIP with anti-GATA2 antibody in SGC7901 cells treated with low-concentration chemotherapy. Data are presented as mean ± SEM. **P < 0.01 by 1-way ANOVA with Bonferroni’s post hoc test (F) or by Student’s t test (G and L).
Figure 6
Figure 6. Elevated CGA and GATA2 expression levels in GC patients after chemotherapy.
(A and B) IHC staining of CGA, p-EGFR, and GATA2 in 6 representative nonresponsive human GC specimens (n = 31) obtained before and after chemotherapy (A). Scale bar: 50 μm. IHC scores of p-EGFR and GATA2 are shown (B). The CGA images are the same as shown in Figure 1D. (C) Association between CGA and p-EGFR or GATA2 levels in nonresponsive GC specimens (n = 31) obtained after chemotherapy. (D) ELISA of CGA levels in plasma samples from healthy donors (normal, n = 57), newly diagnosed GC patients (non-chemo, n = 42), and neoadjuvant (n = 41) or palliative (n = 56) chemotherapy–treated GC patients. (E) Left: ELISA of plasma CGA from GC patients who received neoadjuvant chemotherapy with a partial response (PR, n = 9) or stable disease (SD, n = 31) status. Right: ELISA of plasma CGA from post- and preoperative samples of GC patients (n = 15) who received neoadjuvant chemotherapy. (F) Left: ELISA of plasma CGA from GC patients (n = 46) before and after palliative chemotherapy. Right: ELISA of plasma CGA from GC patients who received palliative chemotherapy and had progressive disease (PD, n = 30) or SD (n = 26) status. (G) Log-rank test for overall survival of GC patients (n = 64) with different CGA levels after neoadjuvant or palliative chemotherapy. Data are presented as mean ± SEM. P value was calculated by Wilcoxon’s matched-pairs signed-rank test (B), by χ2 test (C), by 1-way ANOVA with Bonferroni’s post hoc test (D), or by Student’s t test (E and F).
Figure 7
Figure 7. miR-708-3p and miR-761 sensitize chemoresistant GC cells by targeting CGA.
(A) Diagram of screening for CGA-targeting miRNAs. Details can be found in Supplemental Table 9. (B) Expression of CGA-targeting miRNAs in SGC7901 and MDR cells. (C) Immunoblotting of CGA in MDR cells transfected with indicated miRNA mimics. (D) Top: Diagram of the predicted binding sites between indicated miRNAs and CGA 3′-UTR. Bottom: Luciferase activity derived from the CGA 3′-UTR reporter construct after cotransfection with indicated miRNA mimics. (E) Immunoblotting of CGA in CGA–/– SGC7901ADR cells transfected with indicated constructs and/or miRNA mimics. (F) Viability of CGA-WT and -KO SGC7901ADR cells transfected with indicated constructs and/or miRNA mimics and treated with chemotherapy. (G and H) Nude mice (n = 7–8) were implanted subcutaneously with SGC7901ADR cells. When the tumor size reached 100 mm3, mice received indicated treatment every 3 days (G; fluorouracil, 20 mg/kg, i.p. injection; miRNA prodrugs, 1 nmol/mouse intratumoral injection). Tumor volume and tumor weight were measured (H). Data are presented as mean ± SEM. *P < 0.05; **P < 0.01 by 1-way ANOVA followed by Dunnett’s multiple-comparison test (B, D, and F) or by 1-way or repeated-measures ANOVA with Bonferroni’s post hoc test (H).

Similar articles

Cited by

References

    1. Bray F, et al. Global cancer statistics 2018: GLOBOCAN estimates of incidence and mortality worldwide for 36 cancers in 185 countries. CA Cancer J Clin. 2018;68(6):394–424. doi: 10.3322/caac.21492. - DOI - PubMed
    1. Catalano V, et al. Gastric cancer. Crit Rev Oncol Hematol. 2009;71(2):127–164. doi: 10.1016/j.critrevonc.2009.01.004. - DOI - PubMed
    1. Sastre J, et al. Chemotherapy for gastric cancer. World J Gastroenterol. 2006;12(2):204–213. doi: 10.3748/wjg.v12.i2.204. - DOI - PMC - PubMed
    1. Jim MA, et al. Stomach cancer survival in the United States by race and stage (2001–2009): Findings from the CONCORD-2 study. Cancer. 2017;123 suppl 24(suppl 24):4994–5013. - PMC - PubMed
    1. Madden EC, et al. Tumour cell secretome in chemoresistance and tumour recurrence. Trends Cancer. 2020;6(6):489–505. doi: 10.1016/j.trecan.2020.02.020. - DOI - PubMed

Publication types