

Hyperglycemia-triggered ATF6-CHOP pathway aggravates acute inflammatory liver injury by β-catenin signaling
- PMID: 35289326
- PMCID: PMC8921205
- DOI: 10.1038/s41420-022-00910-z
Hyperglycemia-triggered ATF6-CHOP pathway aggravates acute inflammatory liver injury by β-catenin signaling
Abstract
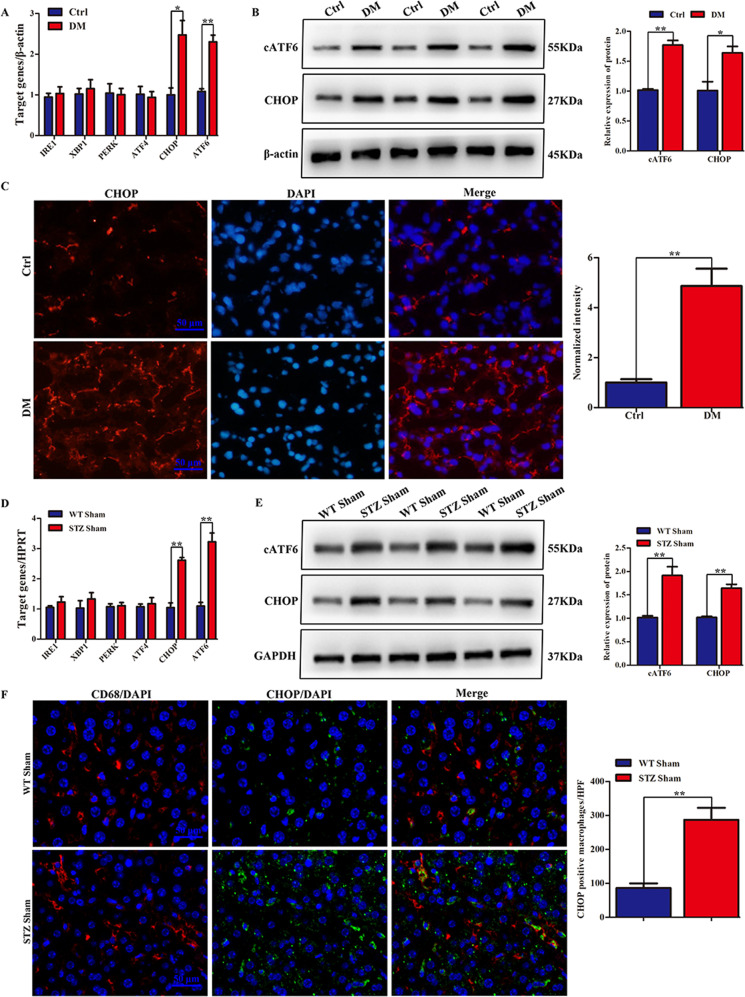
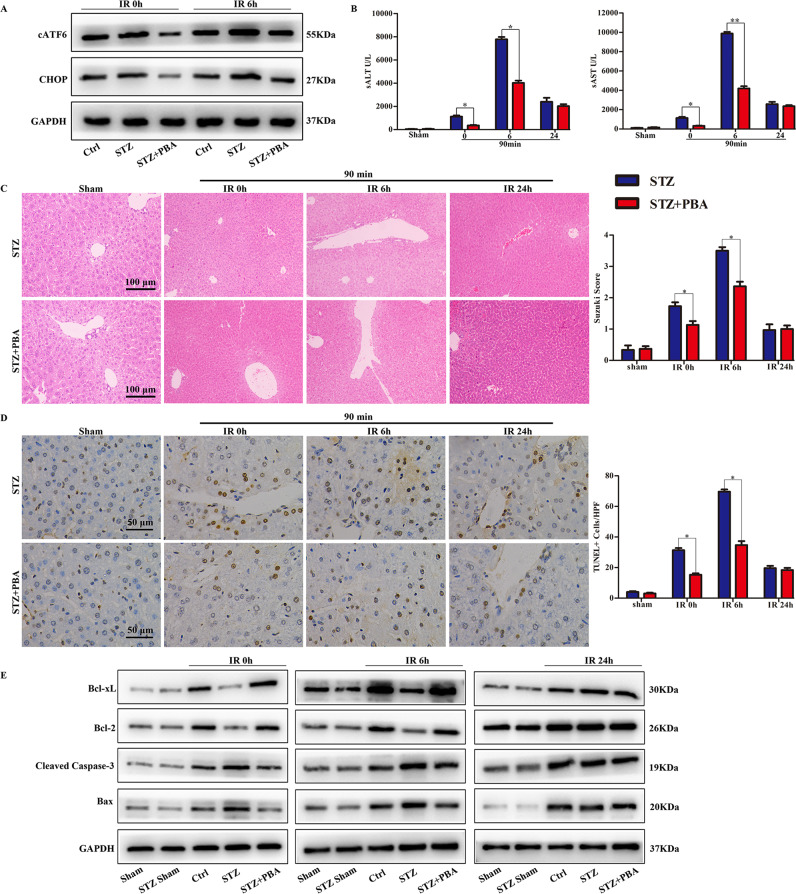
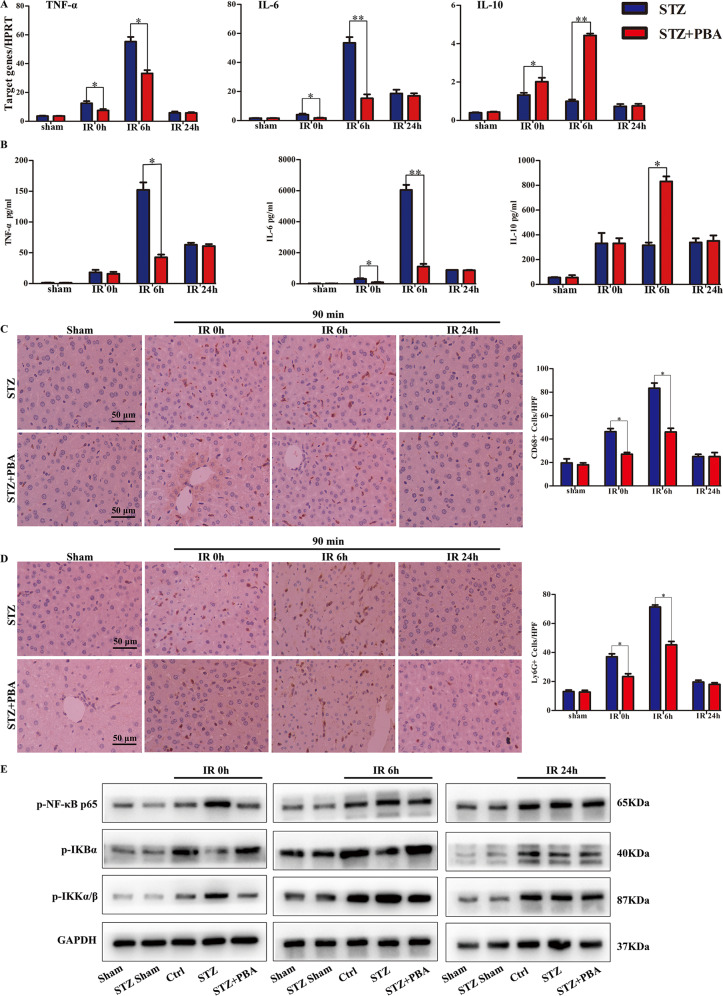
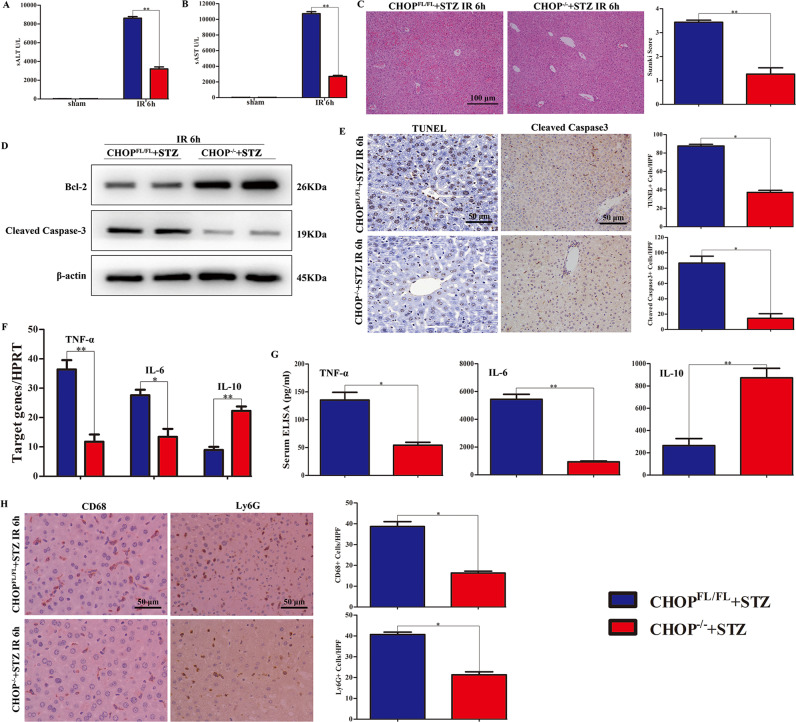
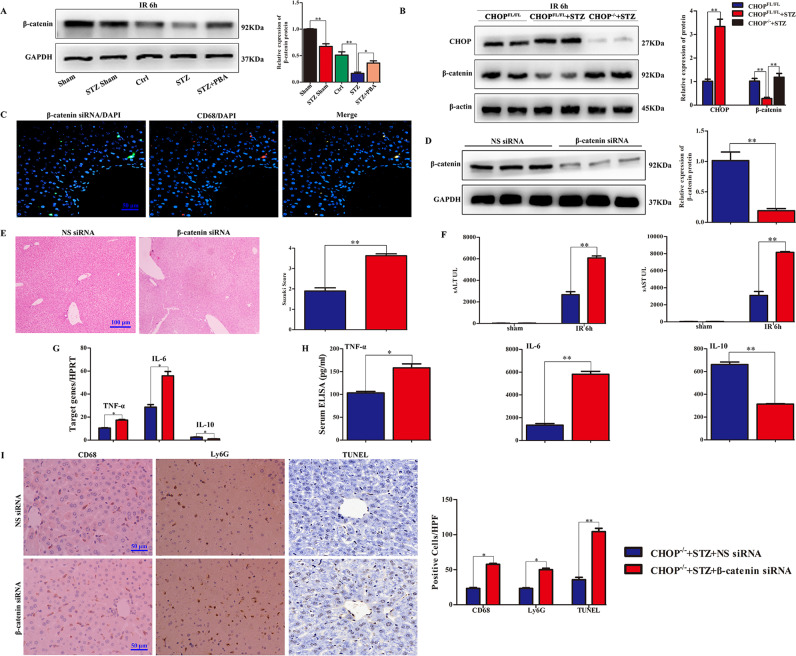
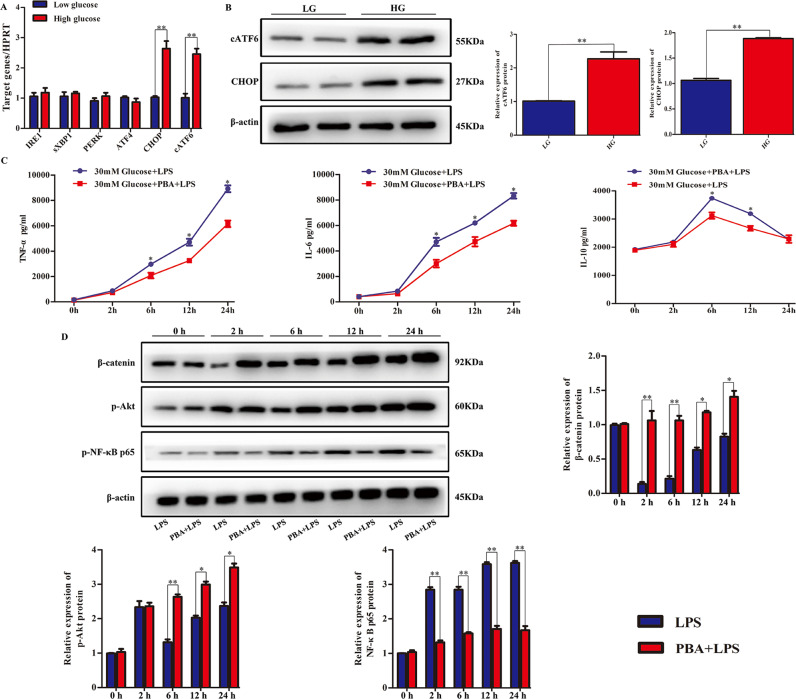
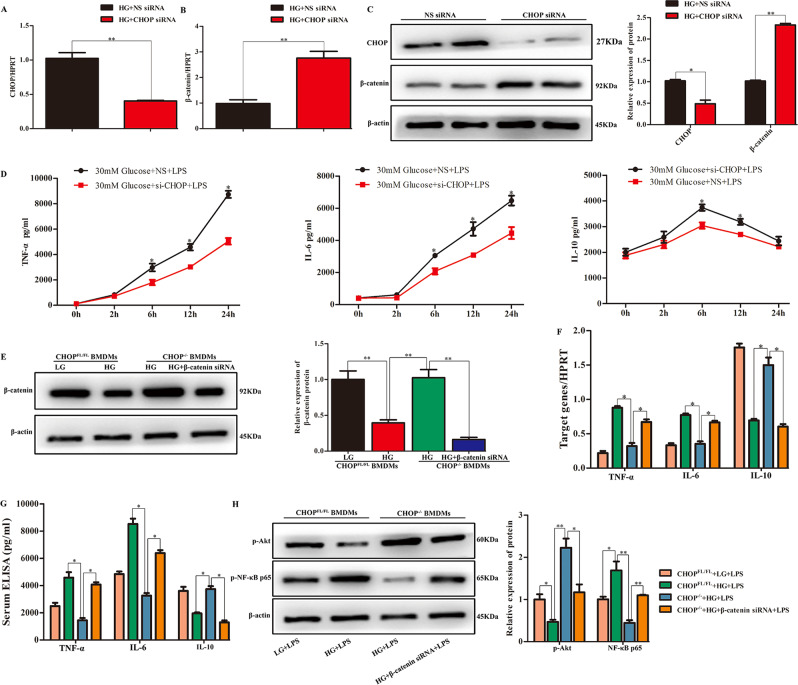
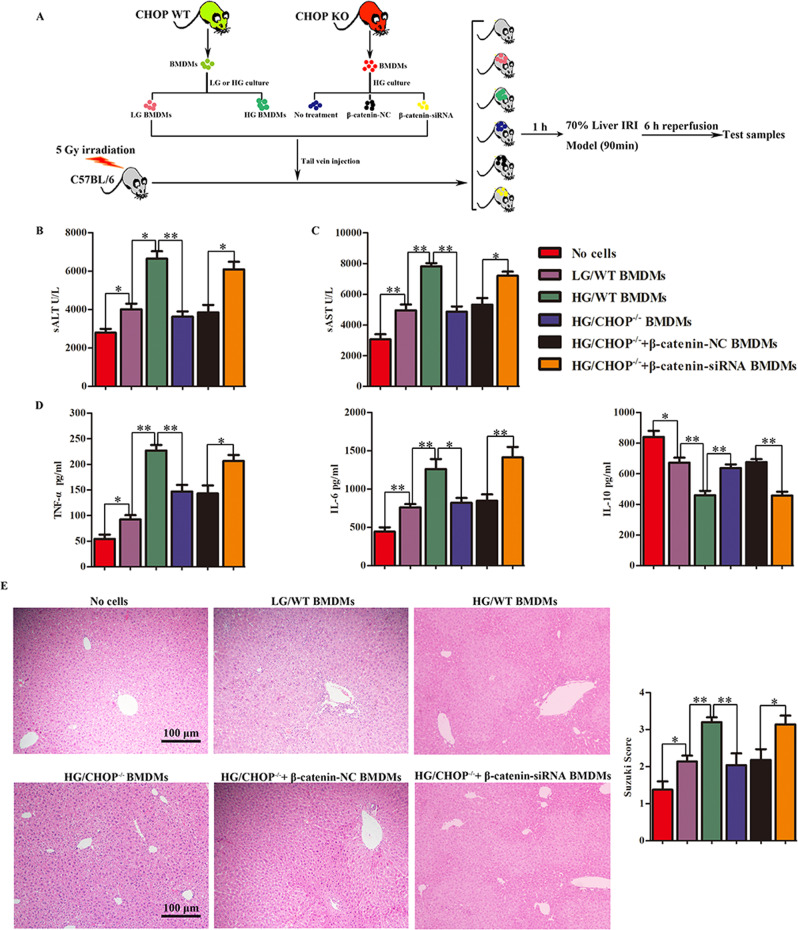
Although hyperglycemia has been documented as an unfavorable element that can further induce liver ischemia-reperfusion injury (IRI), the related molecular mechanisms remain to be clearly elaborated. This study investigated the effective manner of endoplasmic reticulum (ER) stress signaling in hyperglycemia-exacerbated liver IRI. Here we demonstrated that in the liver tissues and Kupffer cells (KCs) of DM patients and STZ-induced hyperglycemic mice, the ER stress-ATF6-CHOP signaling pathway is activated. TLR4-mediated pro-inflammatory activation was greatly attenuated by the addition of 4-phenylbutyrate (PBA), one common ER stress inhibitor. The liver IRI in hyperglycemic mice was also significantly reduced after PBA treatment. In addition, deficiency of CHOP (CHOP-/-) obviously alleviates the hepatic IRI, and pro-inflammatory effects deteriorated by hyperglycemia. In hyperglycemic mice, β-catenin expression was suppressed while the ATF6-CHOP signal was activated. In the liver tissues of PBA-treated or CHOP-/- hyperglycemic mice, the expression of β-catenin was restored. Furthermore, CHOP deficiency can induce protection against hyperglycemia-related liver IRI, which was disrupted by the knockdown of β-catenin will cause this protection to disappear. High glucose (HG) treatment stimulated ATF6-CHOP signaling, reduced cellular β-catenin accumulation, and promoted the TLR4-related inflammation of BMDMs. But the above effects were partially rescued in BMDMs with CHOP deficiency or by PBA treatment. In BMDMs cultured in HG conditions, the anti-inflammatory functions of CHOP-/- were destroyed by the knockdown of β-catenin. Finally, chimeric mice carrying WT or CHOP-/- BMDMs by bone marrow transplantation were adopted to verify the above conclusion. The current study suggested that hyperglycemia could trigger ER stress-ATF6-CHOP axis, inhibit β-catenin activation, accelerate inflammation, and deteriorate liver IRI, thus providing the treatment potential for management of sterile liver inflammation in DM patients.
© 2022. The Author(s).
Conflict of interest statement
The authors declare no competing interests.
Figures
Similar articles
-
Hyperglycemia Aggravates Hepatic Ischemia and Reperfusion Injury by Inhibiting Liver-Resident Macrophage M2 Polarization via C/EBP Homologous Protein-Mediated Endoplasmic Reticulum Stress.Front Immunol. 2017 Oct 13;8:1299. doi: 10.3389/fimmu.2017.01299. eCollection 2017. Front Immunol. 2017. PMID: 29081777 Free PMC article.
-
Hyperglycemia-Triggered Sphingosine-1-Phosphate and Sphingosine-1-Phosphate Receptor 3 Signaling Worsens Liver Ischemia/Reperfusion Injury by Regulating M1/M2 Polarization.Liver Transpl. 2019 Jul;25(7):1074-1090. doi: 10.1002/lt.25470. Epub 2019 Jun 3. Liver Transpl. 2019. PMID: 30972941 Free PMC article.
-
IRE1α aggravates ischemia reperfusion injury of fatty liver by regulating phenotypic transformation of kupffer cells.Free Radic Biol Med. 2018 Aug 20;124:395-407. doi: 10.1016/j.freeradbiomed.2018.06.043. Epub 2018 Jun 30. Free Radic Biol Med. 2018. PMID: 29969718
-
ATF6 mediates a pro-inflammatory synergy between ER stress and TLR activation in the pathogenesis of liver ischemia-reperfusion injury.Am J Transplant. 2014 Jul;14(7):1552-61. doi: 10.1111/ajt.12711. Epub 2014 Jun 5. Am J Transplant. 2014. PMID: 24903305 Free PMC article.
-
Decoding cell death signals in liver inflammation.J Hepatol. 2013 Sep;59(3):583-94. doi: 10.1016/j.jhep.2013.03.033. Epub 2013 Apr 6. J Hepatol. 2013. PMID: 23567086 Review.
Cited by
-
Amelioration of autophagy and inflammatory signaling pathways via α-lipoic acid, burdock and bee pollen versus lipopolysaccharide-induced insulin resistance in murine model.Heliyon. 2023 Apr 23;9(5):e15692. doi: 10.1016/j.heliyon.2023.e15692. eCollection 2023 May. Heliyon. 2023. PMID: 37139293 Free PMC article.
-
ATF6 Alleviates Endothelial Inflammation Following Extended Hepatectomy Through Inhibition of TRIM10/NF-κB Signaling.FASEB J. 2025 Aug 31;39(16):e70933. doi: 10.1096/fj.202402197RRR. FASEB J. 2025. PMID: 40801087 Free PMC article.
-
Unfolded Protein Response Signaling in Liver Disorders: A 2023 Updated Review.Int J Mol Sci. 2023 Sep 14;24(18):14066. doi: 10.3390/ijms241814066. Int J Mol Sci. 2023. PMID: 37762367 Free PMC article. Review.
-
Liver X Receptor Activation Alleviates Hepatic Ischemia-Reperfusion Injury in Diabetes by Inhibiting NF-κB-NLRP3 Activation.Immun Inflamm Dis. 2025 Aug;13(8):e70243. doi: 10.1002/iid3.70243. Immun Inflamm Dis. 2025. PMID: 40778489 Free PMC article.
-
Lactobacillus paracasei CCFM1223 Protects against Lipopolysaccharide-Induced Acute Liver Injury in Mice by Regulating the "Gut-Liver" Axis.Microorganisms. 2022 Jun 30;10(7):1321. doi: 10.3390/microorganisms10071321. Microorganisms. 2022. PMID: 35889040 Free PMC article.
References
-
- Ricci WM, Streubel PN, Morshed S, Collinge CA, Nork SE, Gardner MJ. Risk factors for failure of locked plate fixation of distal femur fractures: an analysis of 335 cases. J Orthop Trauma. 2014;28:83–9. - PubMed
-
- Ponce BA, Menendez ME, Oladeji LO, Soldado F. Diabetes as a risk factor for poorer early postoperative outcomes after shoulder arthroplasty. J Shoulder Elb Surg. 2014;23:671–8. - PubMed
-
- Evans JL, Goldfine ID, Maddux BA, Grodsky GM. Oxidative stress and stress-activated signaling pathways: a unifying hypothesis of type 2 diabetes. Endocr Rev. 2002;23:599–622. - PubMed
LinkOut - more resources
Full Text Sources
Research Materials
