. 2022 May;18(5):511-519.
doi: 10.1038/s41589-022-00981-0. Epub 2022 Mar 14.

Symmetric and asymmetric receptor conformation continuum induced by a new insulin

Affiliations

Symmetric and asymmetric receptor conformation continuum induced by a new insulin

Xiaochun Xiong et al. Nat Chem Biol. 2022 May.

Abstract

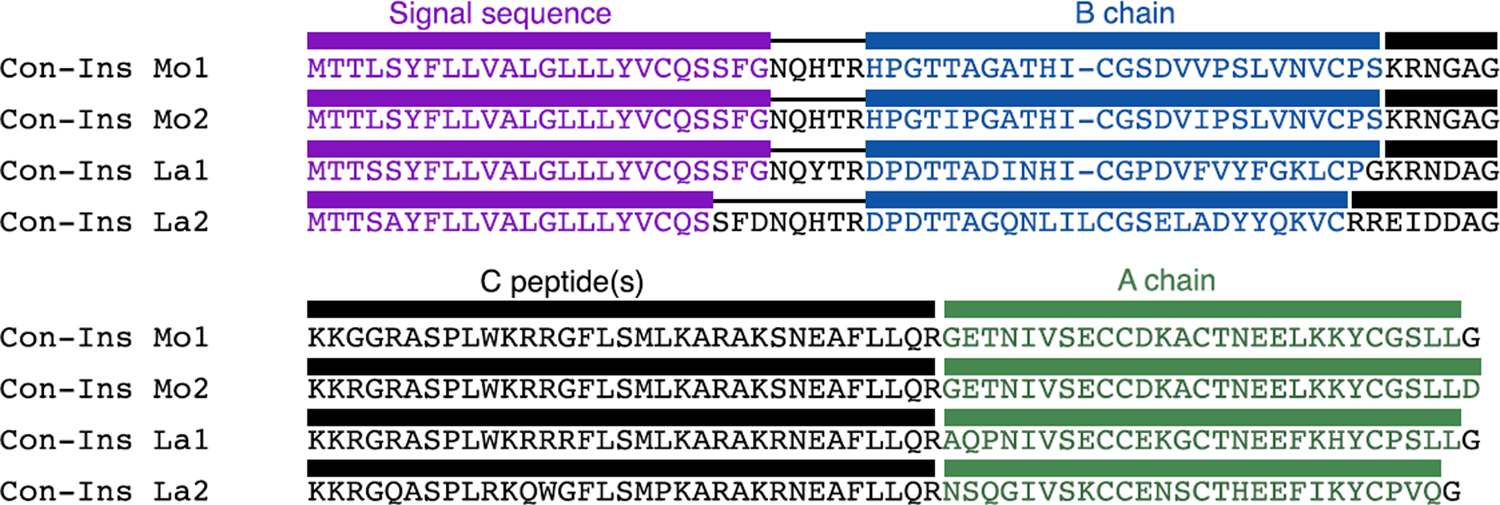
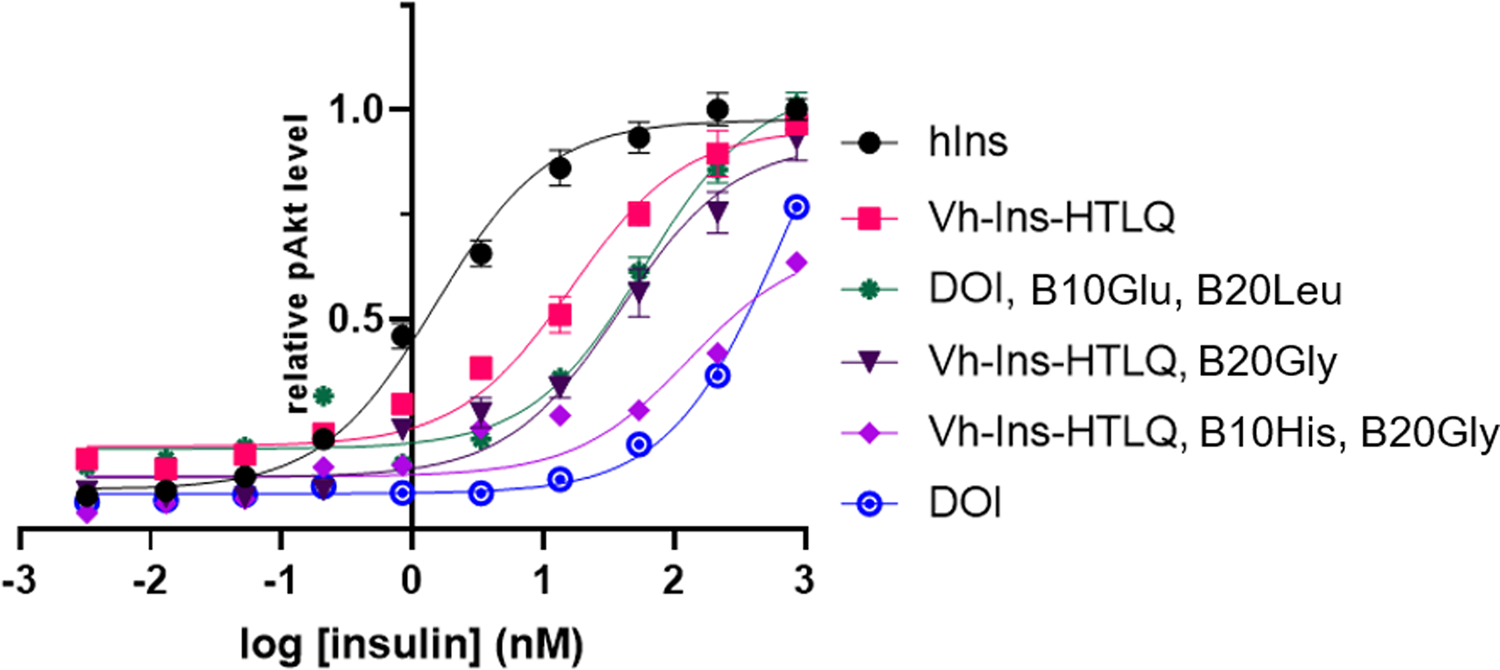
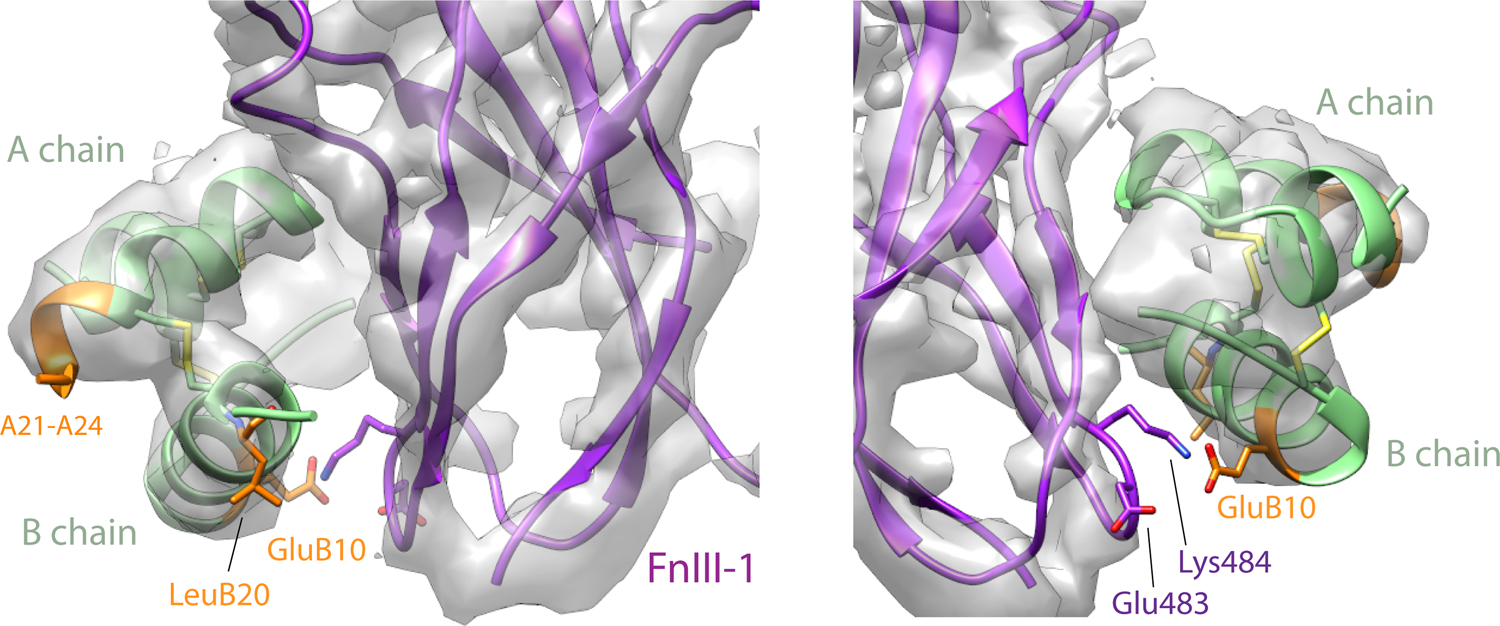
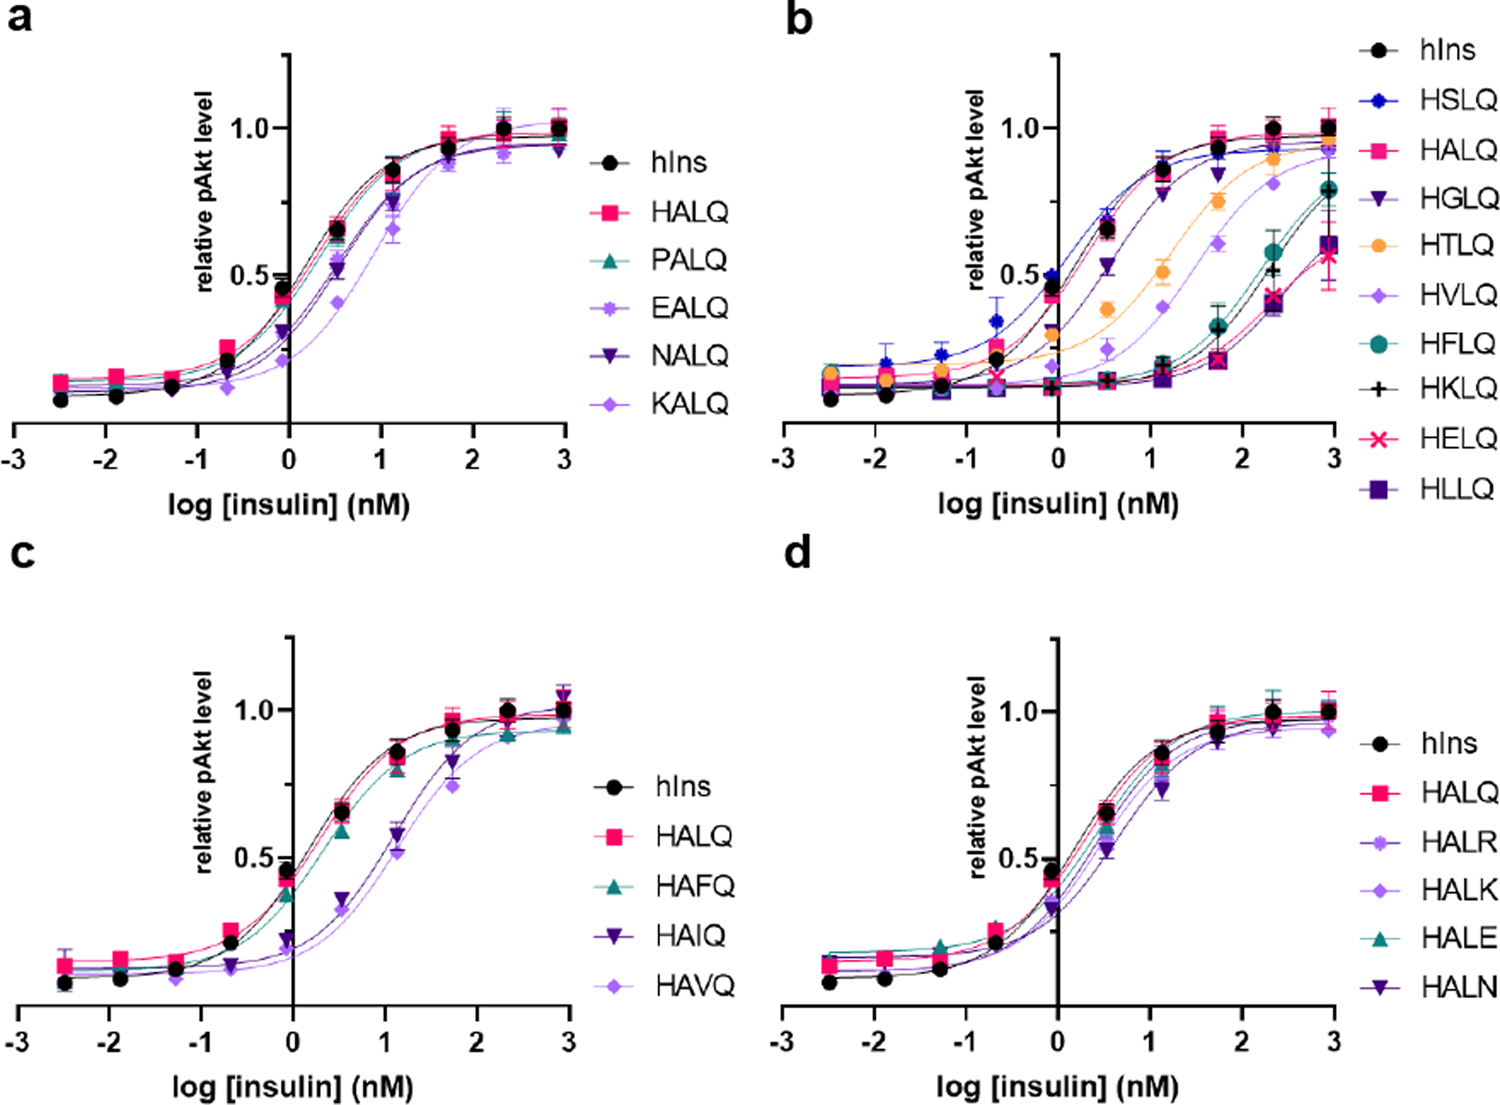
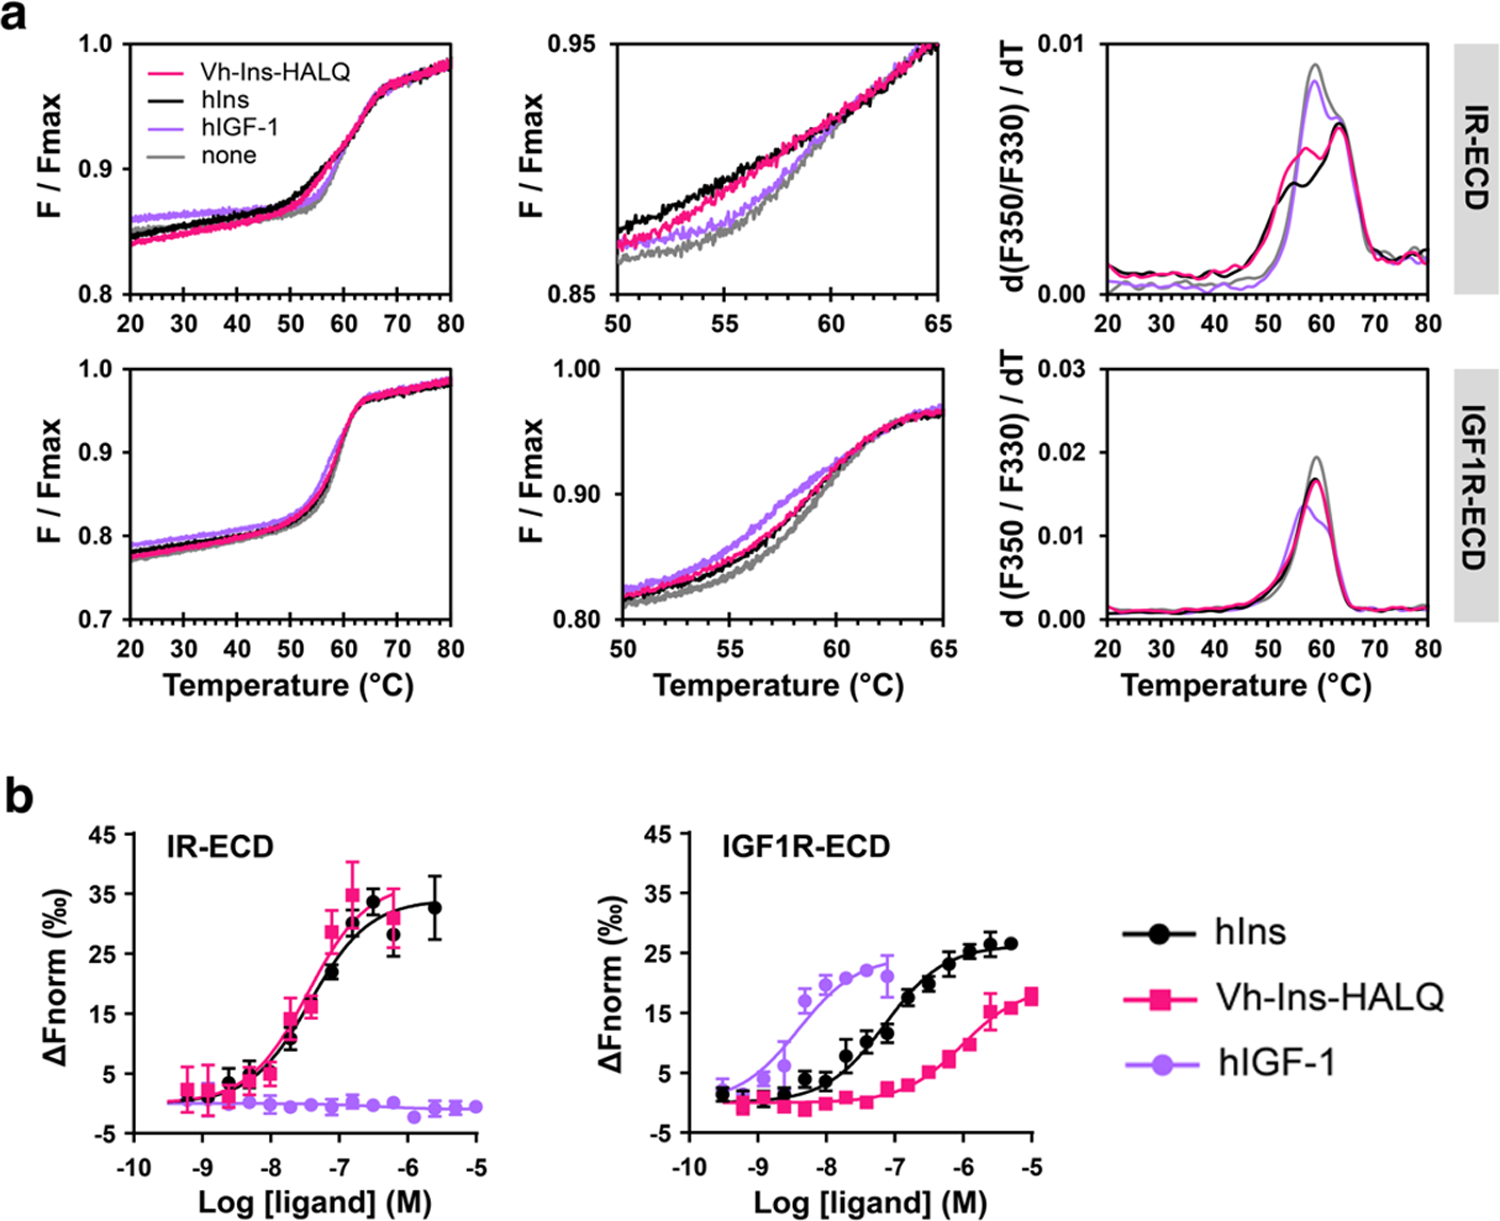
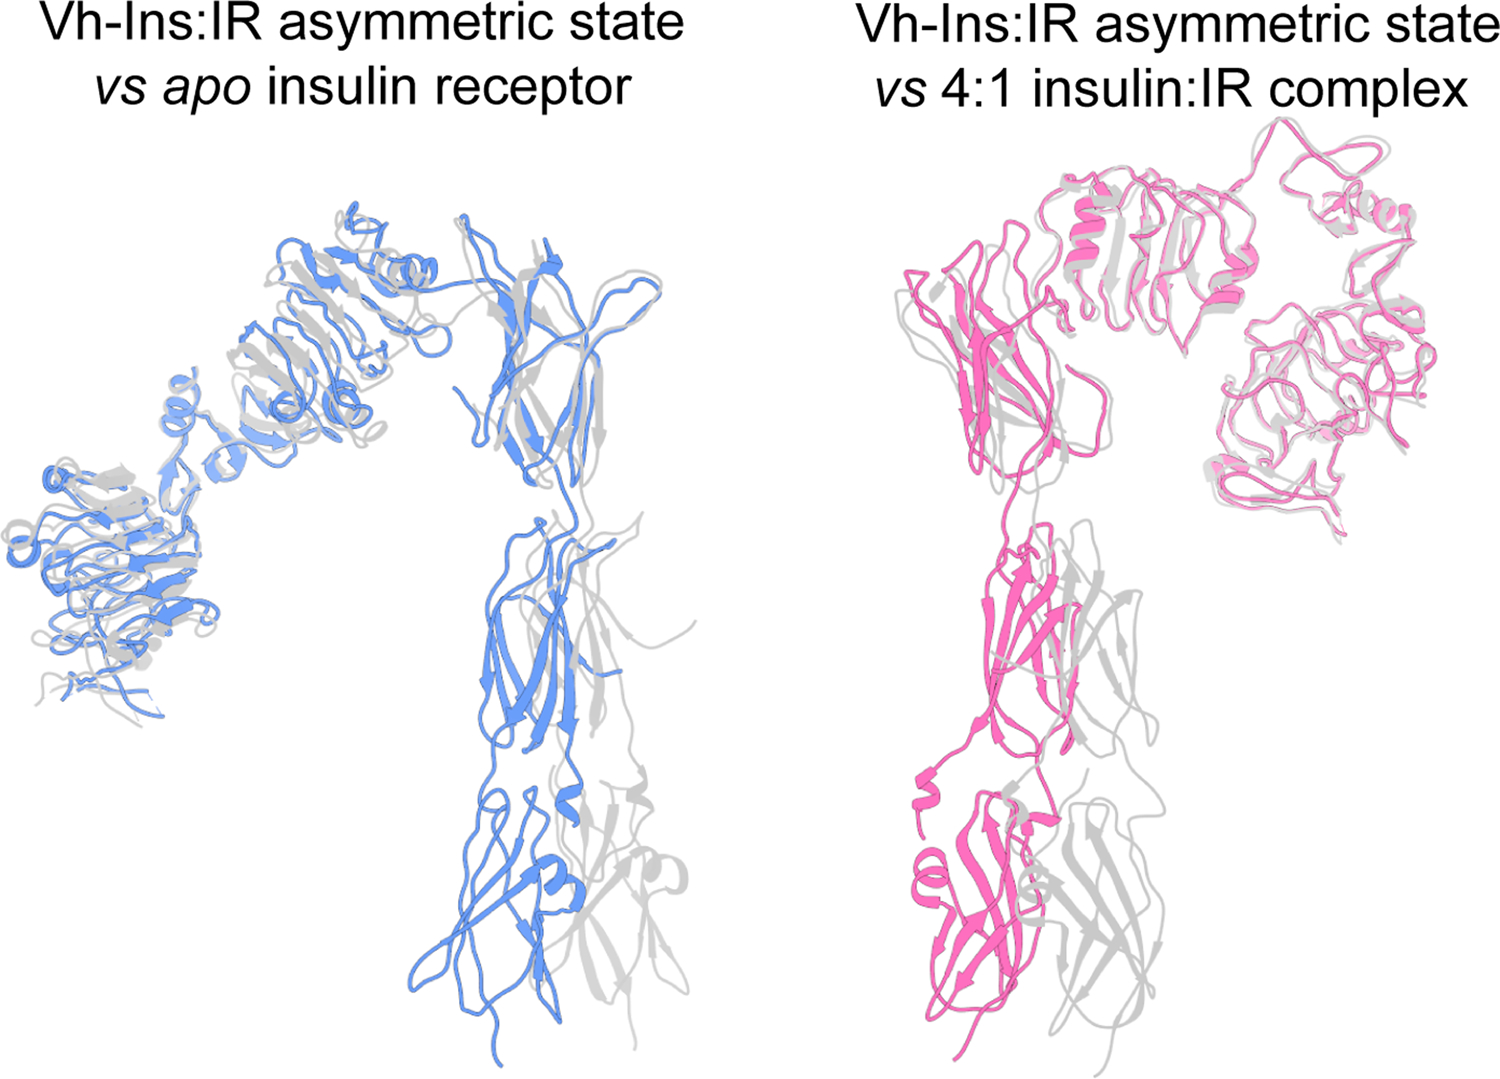
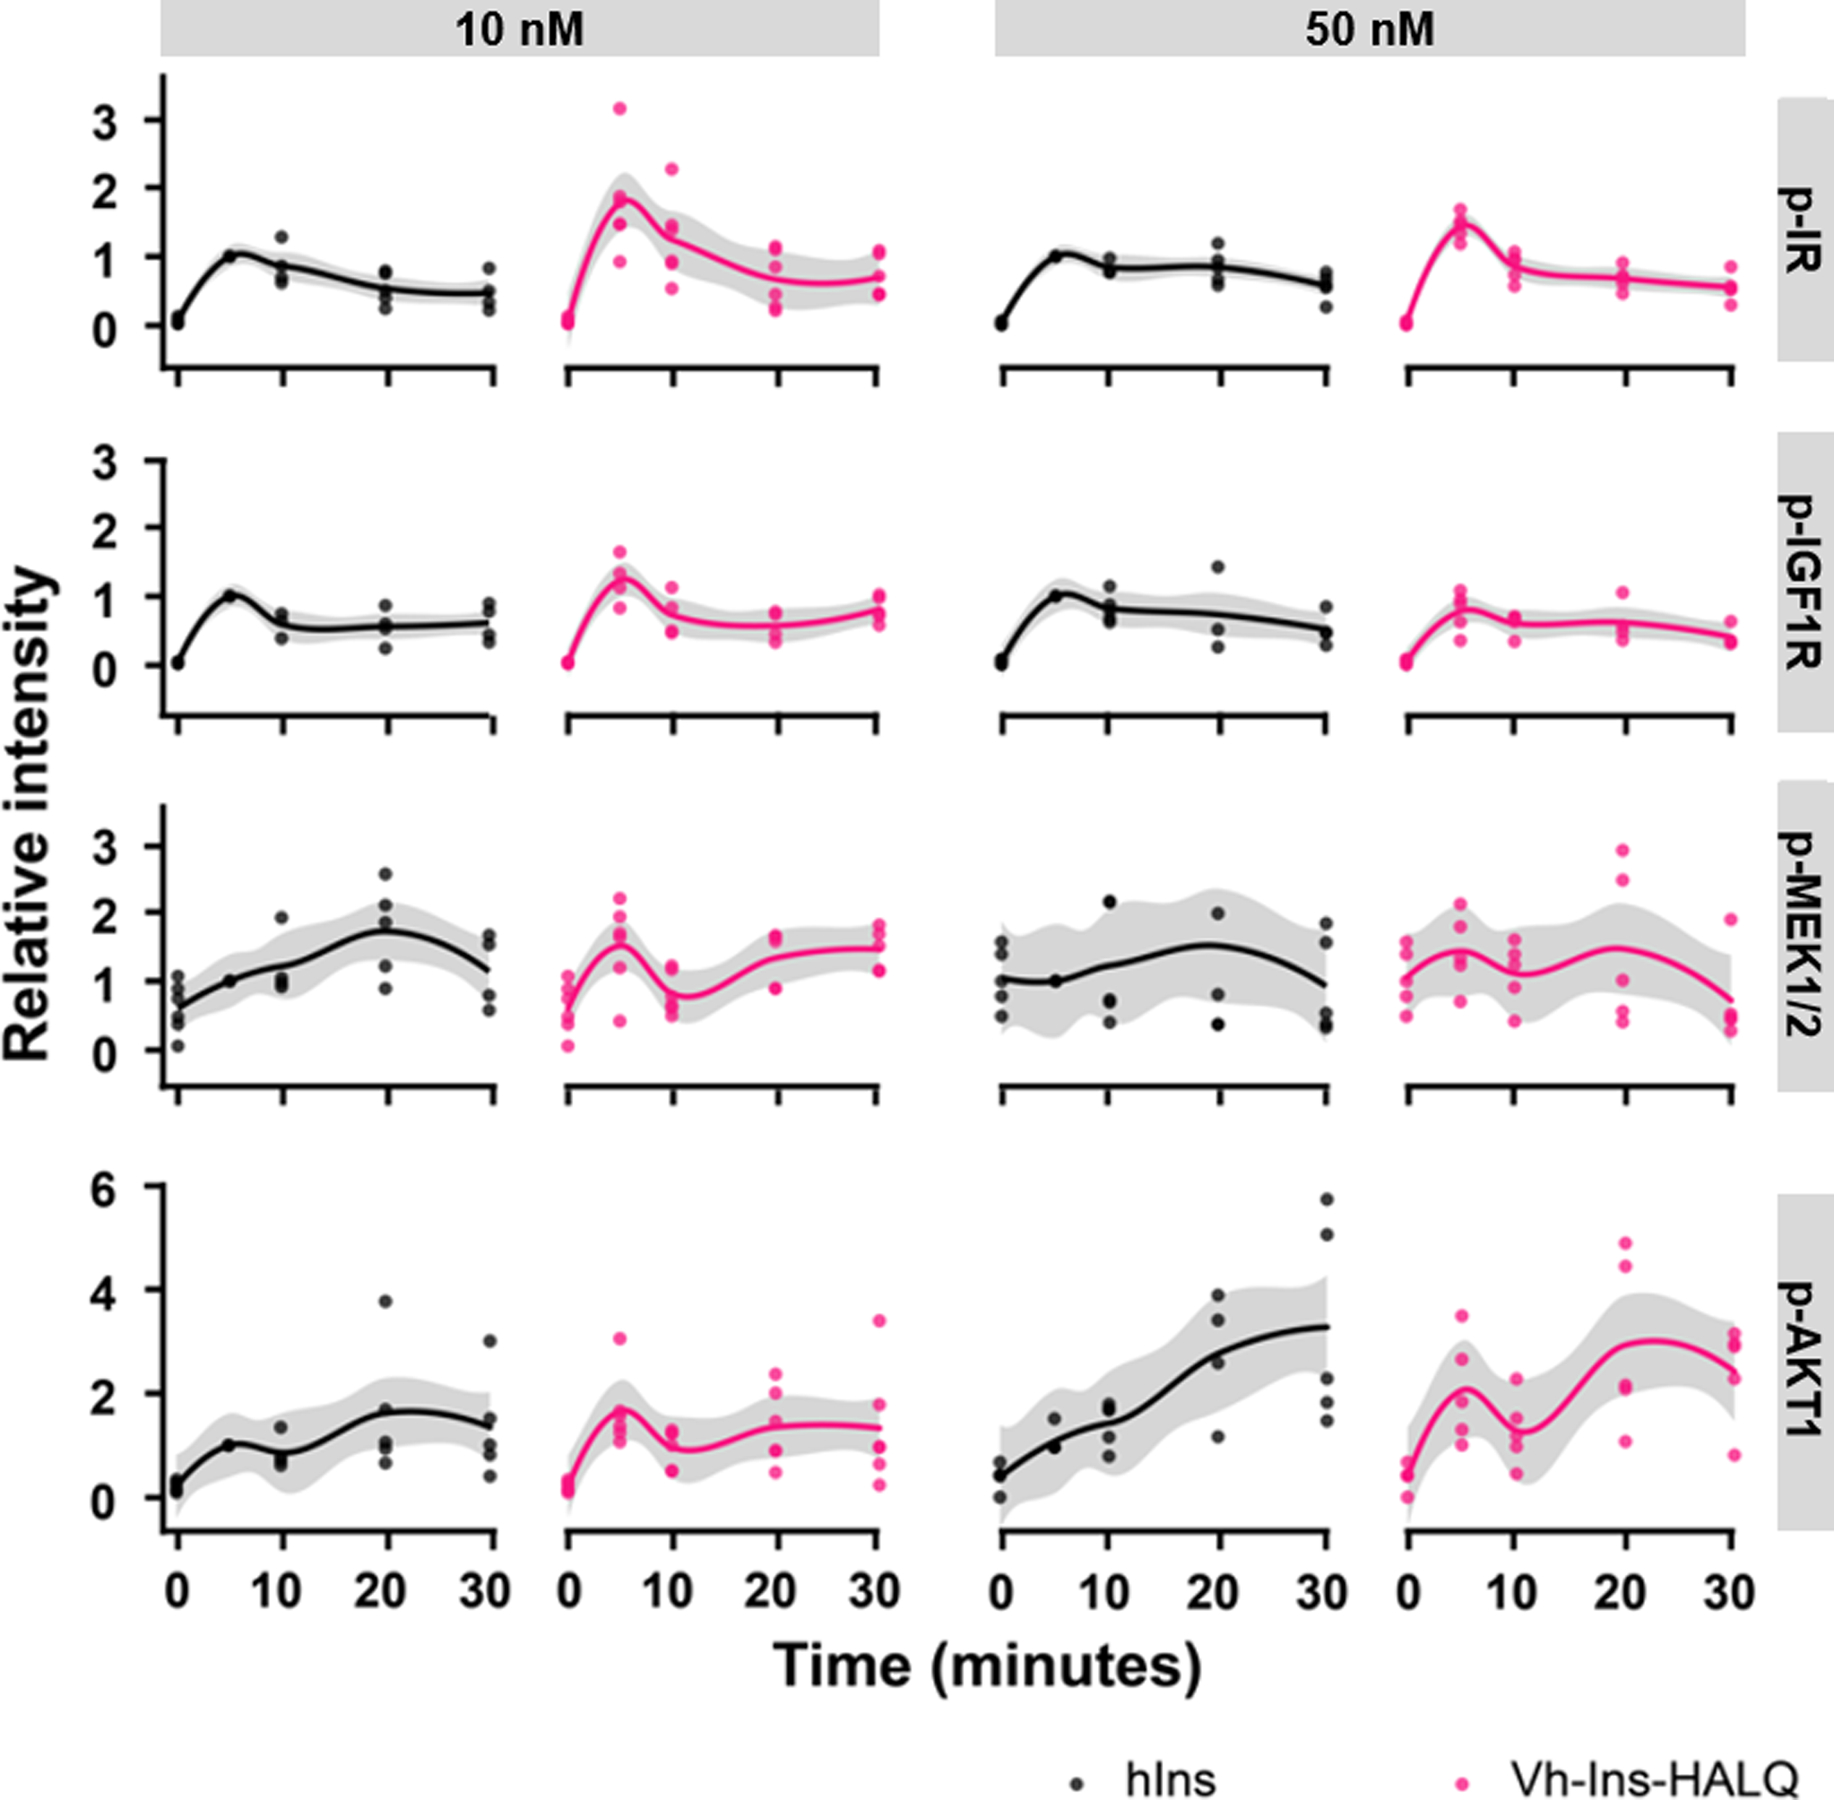
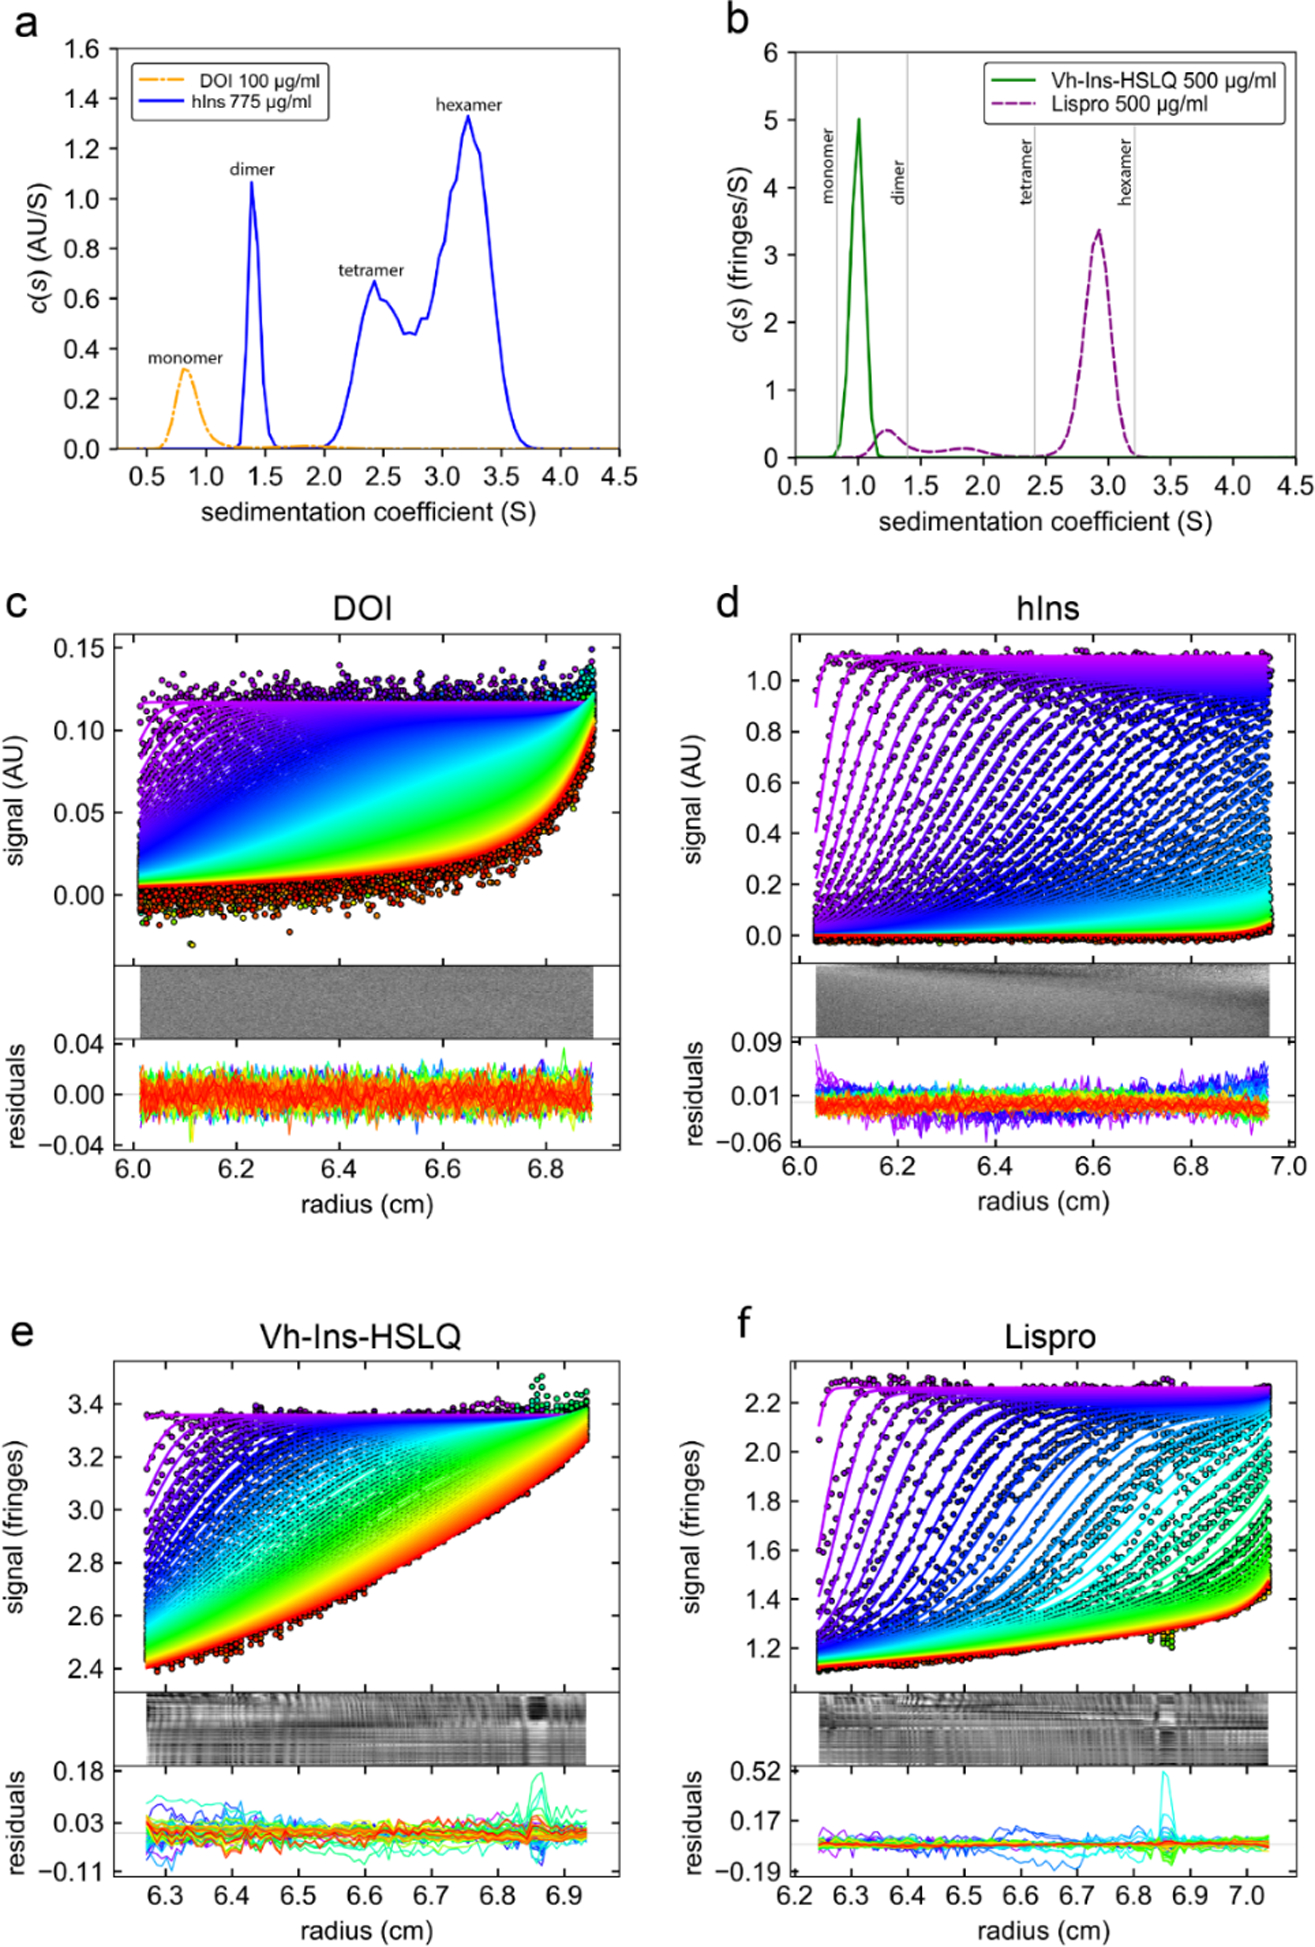
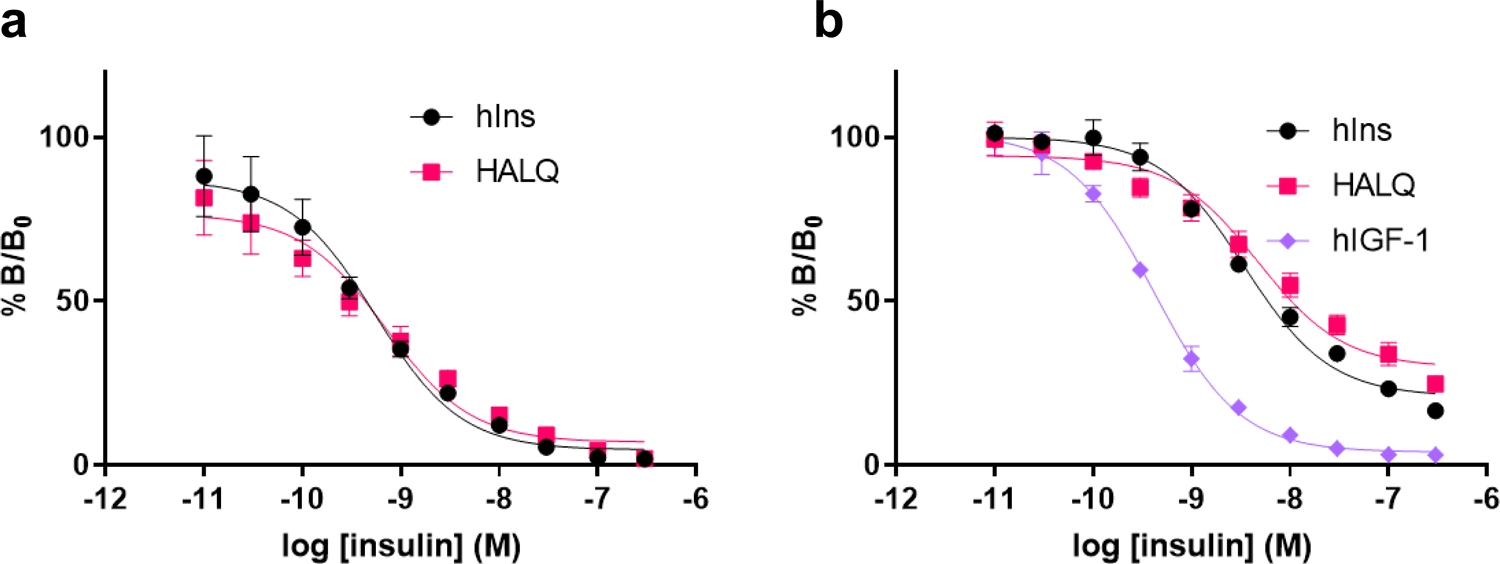
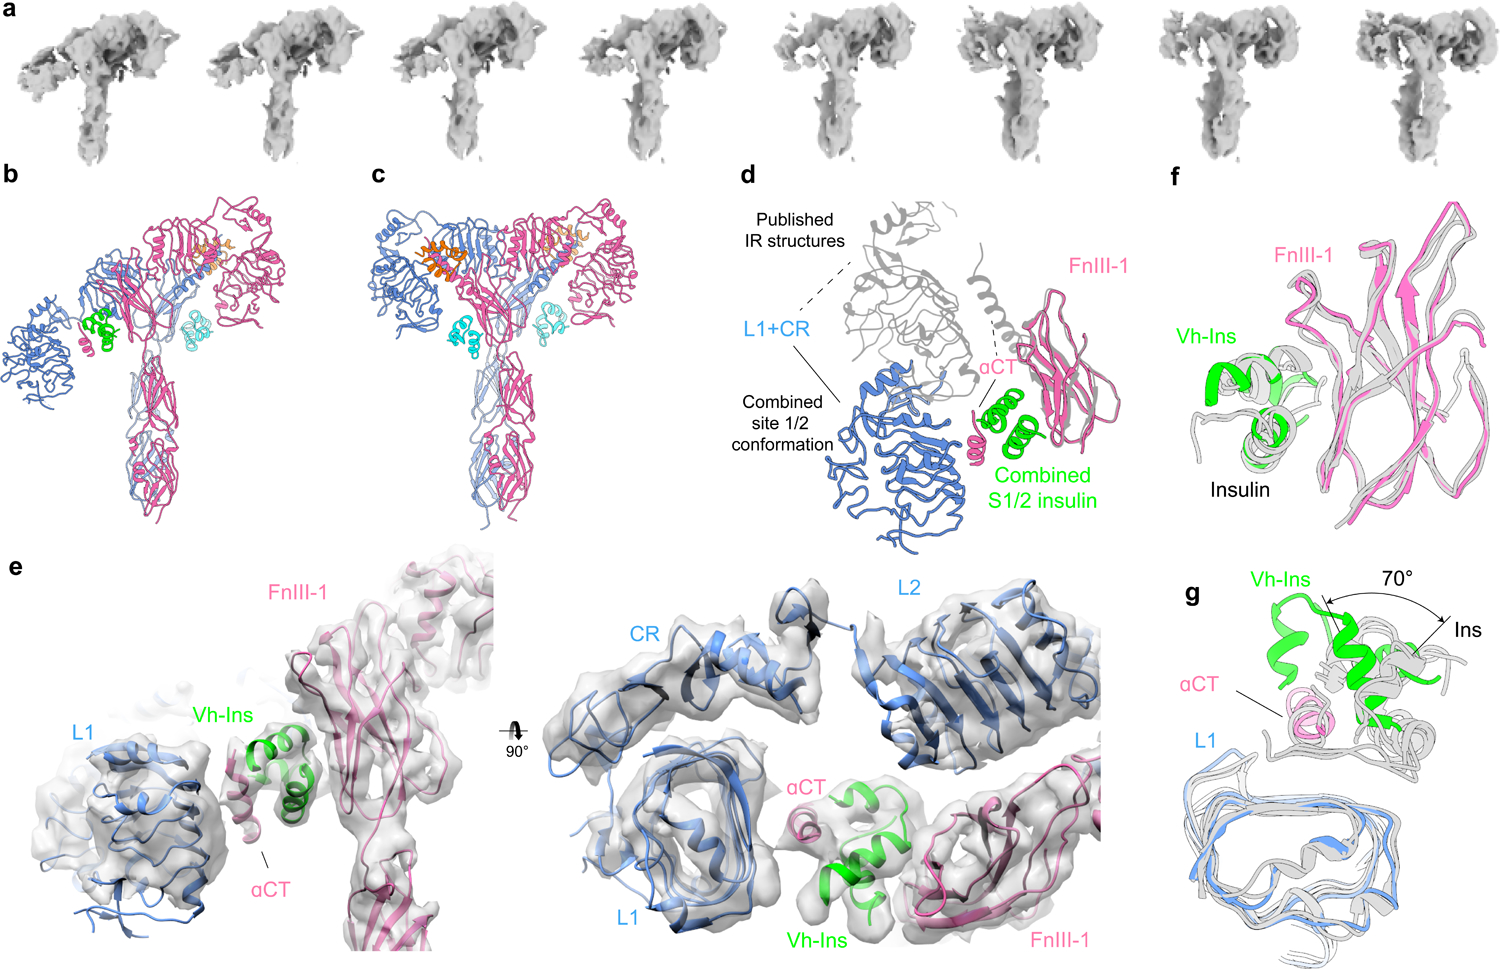
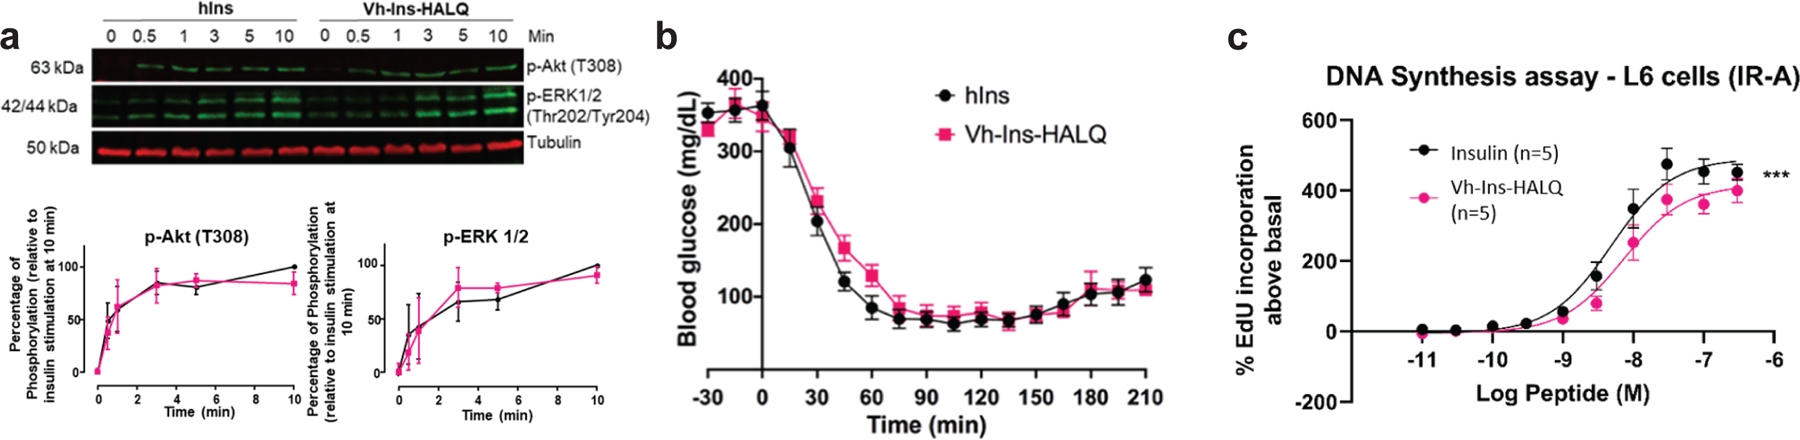
Cone snail venoms contain a wide variety of bioactive peptides, including insulin-like molecules with distinct structural features, binding modes and biochemical properties. Here, we report an active humanized cone snail venom insulin with an elongated A chain and a truncated B chain, and use cryo-electron microscopy (cryo-EM) and protein engineering to elucidate its interactions with the human insulin receptor (IR) ectodomain. We reveal how an extended A chain can compensate for deletion of B-chain residues, which are essential for activity of human insulin but also compromise therapeutic utility by delaying dissolution from the site of subcutaneous injection. This finding suggests approaches to developing improved therapeutic insulins. Curiously, the receptor displays a continuum of conformations from the symmetric state to a highly asymmetric low-abundance structure that displays coordination of a single humanized venom insulin using elements from both of the previously characterized site 1 and site 2 interactions.


Conflict of interest statement

Competing interests

A patent application related to this work was filed by the University of Utah.

Figures

Extended Data Fig. 1
Extended Data Fig. 1. Precursor sequence alignment of venom insulins identified in this study
Canonical arrangement of preproinsulins with N-terminal signal sequences (purple) followed by the B chain (blue), C-peptide region (black) and A chain (green). The signal sequence, C peptide(s), and additional black-colored residues are predicted to be cleaved during post-translational processing.
Extended Data Fig. 2
Extended Data Fig. 2. AKT phosphorylation activity of Vh-Ins-HTLQ and related analogs.
NIH 3T3 cells overexpressing IR-B were stimulated with insulin analogs and pAkt was quantified using a homogeneous time-resolved fluorescence assay. Error bars (s.e.m. of 4 biological replicates) are shown when larger than the symbols. Two substitutions on the B chain, GluB10 and LeuB20, were found to increase the relative activity of Vh-Ins-HTLQ. These substitutions were subsequently included in later stages of design of Vh-Ins molecules.
Extended Data Fig. 3
Extended Data Fig. 3. Vh-Ins-HSLQ at site 2.
Density is shown around Vh-Ins-HSLQ. Vh-Ins-HSLQ green, with Vh-Ins mutated residues relative to native human insulin shown in orange. Receptor FnIII-1 domain, purple. The only Vh-specific residue that approaches receptor at site 2 is GluB10, which has poor density. Nearby receptor side chains lack density but are shown explicitly for illustrative purposes.
Extended Data Fig. 4
Extended Data Fig. 4. Activity of Vh-Ins analogs with single-residue substitutions in the extended A-chain residues (A21-A24).
NIH 3T3 cells overexpressing IR-B were stimulated with insulin analogs and pAkt was quantified using a homogeneous time-resolved fluorescence assay. Error bars (s.e.m. of 4 biological replicates) are shown when larger than the symbols.
Extended Data Fig. 5
Extended Data Fig. 5. Vh-Ins-HALQ binding to IR and IGF-1R ectodomains.
a, NanoDSF monitoring of intrinsic protein fluorescence to determine the thermal conformational stability of IR-ECD (top) or IGF1R-ECD (bottom) in the presence of respective ligands in four-times molar excess. Apo-IR-ECD displays two detectable unfolding transitions Tmlow and Tmhigh at 59.2 °C and 63.2 °C, respectively (Supplementary Table 5). The presence of Vh-Ins-HALQ leads to a decrease in Tmlow to 56.3 °C indicating conformational changes induced by ligand binding similarly to insulin (Tmlow = 54.3 °C). Apo-IGF1R-ECD displays a single transition temperature Tmhigh, while binding to hIGF-I leads to an additional melting transition at 57.4 °C. No significant changes in unfolding transitions were observed for IR-ECD in the presence of hIGF-I or for IGF1R-ECD in the presence of Vh-Ins-HALQ or hIns as compared to the respective ligand-free ectodomains. b, MST with IR-ECD (left) and IGF1R-ECD (right) to determine dissociation constants of binding to respective ligands (Supplementary Table 6; n=3, error bars show standard deviations).
Extended Data Fig. 6
Extended Data Fig. 6. Comparison of the two receptor protomers in the asymmetric conformation against previously reported structures.
Left, Vh-Ins:IR asymmetric state apolike protomer (blue) vs apo IR (PDBs 4ZXB). Right, the second Vh-Ins:IR protomer (pink) vs insulin-bound receptor (6PXV) following alignment on L1, CR, L2, and FnIII-1 domains.
Extended Data Fig. 7
Extended Data Fig. 7. Vh-Ins-HALQ signal transduction in Hep-G2 cells.
Signal transduction in Hep-G2 hepatoblastoma cells induced by Vh-Ins-HALQ and hIns at 10 or 50 nM was assessed by Western blot and densitometry (4–6 biological replicates for each condition). Phosphorylation-specific antibodies were used to detect phosphorylated IR (Y1150/115), IGF1R (Y980), AKT1 (S473), and MEK-1/2 (S217/221). Relative intensities of specific protein bands were normalized to the GAPDH loading control and then to the respective signal after 5 min of insulin treatment.
Extended Data Fig. 8
Extended Data Fig. 8. SV-AUC c(s) analysis of insulin analogs.
a, DOI (des octapeptide insulin) and hIns (human insulin) controls at a concentration of 100 μg/ml and 775 μg/ml respectively in phosphate buffer (137 mM NaCl, 2.7 mM KCl, 5.3 mM Na2HPO4, 1.8 mM KH2PO4, pH 7.4). b, Vh-Ins-HSLQ and Lispro both at 500 μg/ml in sterile insulin diluent (16 mg/ml glycerol, 1.6 mg/ml m-cresol, 0.65 mg/ml phenol, 3.8 mg/ml Na2HPO4, pH 7.4). c-d, Data fit and residuals for DOI, hIns, Vh-Ins-HSLQ and lispro, respectively. For clarity, some scans are omitted from the figures shown but all scans were used for the c(s) analysis. The interval between the scans shown in each panel is ~9 minutes.
Extended Data Fig. 9
Extended Data Fig. 9. SV-AUC of DOI and hIns in sterile diluent.
a, c(s) analysis of DOI and hIns in sterile diluent. For reference the Vh-Ins-HSLQ trace from Fig. S11 is shown. b-c, data fit and residuals for DOI and hIns in sterile diluent, respectively. hIns shows increasing concentrations at higher radii in early scans, indicative of aggregation during the experiment.
Fig. 1 |
Fig. 1 |. Alignment of insulin sequences.
a, Molecular phylogenetics closely groups the newly identified venom insulin sequences with venom insulins previously identified from other fish hunters (red branches in tree). Tree branches of venom insulins from snail and worm-hunters are shown in blue, and those of endogenous signaling insulins are black. b, Sequence alignment of human and zebrafish insulin c, Alignment of venom insulins sequenced here from C. mucronatus (Mo1 and Mo2) and C. laterculatus (La1 and La2) and previously from C. kinoshitai (K1 and K2). d, Alignment of venom insulins from C. geographus (G1) and C. tulipa (T1A and T1B). B-chain residues deleted in DOI and important for receptor-binding and dimerization (b) or residues unique to venoms and predicted to bind insulin receptor (c and d) are in red. Cysteines are in bold. Disulfide connectivity is shown as black lines. # indicates C-terminal amides.
Fig. 2 |
Fig. 2 |. Activities of venom-insulin hybrid (Vh-Ins) analogs based on cone snail venoms containing extended A-chain sequences.
a, Sequences of human insulin, human DOI and venom-DOI hybrids. Red letters indicate altered sequence relative to human insulin, X represents the elongated A chain sequences in Fig. 1c. b, Cellular activities of Vh-Ins analogs as assessed by pAKT in NIH 3T3 cells overexpressing IR-B (all with B10E, B20L substitutions) with various elongated A-chain sequences from cone-snail insulins (without C-terminal amidation). Error bars are shown when greater than the size of the symbols. c, Cellular activities of Vh-Ins analogs with alanine substitutions. All sequences are without C-terminal amidation.
Fig. 3 |
Fig. 3 |. The symmetric Vh-Ins-HSLQ-receptor structure.
a, Schematic of the insulin receptor domains and disulfide connectivity. b, Structure of the insulin receptor ectodomain with four Vh-Ins-HSLQ molecules bound. Insulins are depicted in surface representation (orange, site 1; cyan, site 2). c, Consensus refinement density of the Vh-Ins-HSLQ-receptor complex (4.1 Å). Box indicates the region selected for focused refinement. Blue and pink, receptor protomers. Vh-Ins-HSLQ orange (site 1) and cyan (site 2). d, Focused refinement map. Site-2 insulins do not contribute significant signal relative to noise at the filter frequency used for the final reconstruction (3.4 Å). e-h, representative density and model for Vh-Ins A chain, Vh-Ins B chain, L1, and αCT residues, respectively. i, The extended A-chain residues (green) are in close proximity to the receptor αCT and L1 domains. LeuB20 contacts L1 and GluB10 interacts with FnIII-1. j, Comparison of site-1 Vh-Ins-HSLQ (orange) and human insulin (white, PDB 6PXW) aligned by superposition of L1 and αCT residues. Vn-Ins-HSLQ extended A-chain residues (green) contact the same receptor surface engaged by human insulin PheB24 and PheB25. The helix formed by Vh-Ins-HSLQ residues A13-A23 is kinked 24 ° away from αCT at HisA21 and slightly unwound. The human insulin A-chain C terminus is indicated with an asterisk. k, Vh-Ins-HSLQ LeuA23 binds a hydrophobic pocket in a similar fashion to human insulin PheB24. l, Surface representation of the pocket formed by αCT and L1 and binding by LeuA23 and PheB24. m, Vh-Ins-HSLQ LeuB20 packs against TyrB16 and approaches receptor Lys40.
Fig. 4 |
Fig. 4 |. Receptor binding affinity.
a, Competition binding assays of human insulin and Vh-Ins-HALQ to solubilized and immobilized insulin receptor (IR-B). Note that IR-B generally binds insulin and analogs with similar affinity to IR-A. Each data point represents the mean of three assays. Error bars (s.e.m.) are shown. b, Type 1 IGF receptor competition binding assay of human insulin, hIGF-I and Vh-Ins-HALQ. Each data point represents the mean of two assays (each with three technical replicates). Error bars (s.e.m.) are shown. Results in a and b are expressed as a percentage of binding in the absence of competing ligand.
Fig. 5 |
Fig. 5 |. Conformational heterogeneity in Vh-Ins-HSLQ-receptor reconstructions.
a, The conformational trajectory solved by 3D variability analysis depicted as a series of eight maps b, Model of the most asymmetric extreme. Three Vh-Ins-HSLQ molecules are bound. Site-1 (orange) and site-2 (cyan) positions are occupied for the right-hand “up” protomer of the receptor in the same manner as the symmetric conformation (Fig. 2). One Vh-Ins-HSLQ is bound to the left-hand “down” protomer of the receptor at the combined 1/2 site (green) that approximates a combination of site-1 and site-2 interactions. c, Model of the conformational state that most closely resembles a two-fold symmetric ectodomain complex, built into a 6.0 Å map. Vh-Ins is apparent at both site 1 positions (orange) and for site-2 Vh-Ins (cyan). d, Apparent motion of L1, CR and αCT when site-1 and site-1/2 structures are superimposed on the FnIII-1 domains. e, 4.4 Å map and model of the asymmetric conformation and the combined site 1/2. The resolution is sufficient to model the location and orientation of all domains, although the register of the αCT helix is not clear. f, Comparison of site-2-bound human insulin (PDBs 6SOF, 6PXW) with Vh-Ins-HSLQ at the combined site-1/2 position following structural alignment with the FnIII-1 domain g, Comparison of site-1-bound human insulin (PDBs 6HN5, 6SOF, 6PXW) with Vh-Ins-HSLQ at the combined site-1/2 position following structural alignment with the L1 domain.
Fig. 6 |
Fig. 6 |. Activity of Vh-Ins-HALQ relative to human insulin.
a, ERK(pThr202, pTyr204) and AKT(pThr308) signaling profile induced in L6 myoblasts by Vh-Ins-HALQ (pink) and human insulin (black). Data points here and in other panels represent the average of three experiments, and error bars (standard error of the mean) are shown when larger than the symbols. A representative western blot is shown. b, Insulin tolerance test in rats determined by the lowering of blood glucose following subcutaneous injection of 0.017 mg.kg−1 insulin or Vh-Ins-HALQ. c, DNA synthesis as response to concentration of insulin or Vh-Ins-HALQ is shown as percent incorporation of 5-Ethynyl-2’-uridine (EdU) above the basal level. Insulin vs Vh-Ins-HALQ *** p value <0.001 (2-way ANOVA, Dunnett’s multiple comparison test).

Similar articles

Cited by

References

    1. Shabanpoor F, Separovic F & Wade JD The human insulin superfamily of polypeptide hormones. Vitam Horm 80, 1–31 (2009). - PubMed
    1. Heinemann L Variability of Insulin Absorption and Insulin Action. Diabetes Technology & Therapeutics 4(2004). - PubMed
    1. Gradel AKJ et al. Factors Affecting the Absorption of Subcutaneously Administered Insulin: Effect on Variability. J Diabetes Res 2018, 1205121 (2018). - PMC - PubMed
    1. Menting JG et al. How insulin engages its primary binding site on the insulin receptor. Nature 493, 241–245 (2013). - PMC - PubMed
    1. Carpenter FH Relationship of structure to biological activity of insulin as revealed by degradative studies. The American Journal of Medicine 40, 750–758 (1966). - PubMed

Publication types