

Increased risk of SARS-CoV-2 reinfection associated with emergence of Omicron in South Africa
- PMID: 35289632
- PMCID: PMC8995029
- DOI: 10.1126/science.abn4947
Increased risk of SARS-CoV-2 reinfection associated with emergence of Omicron in South Africa
Abstract
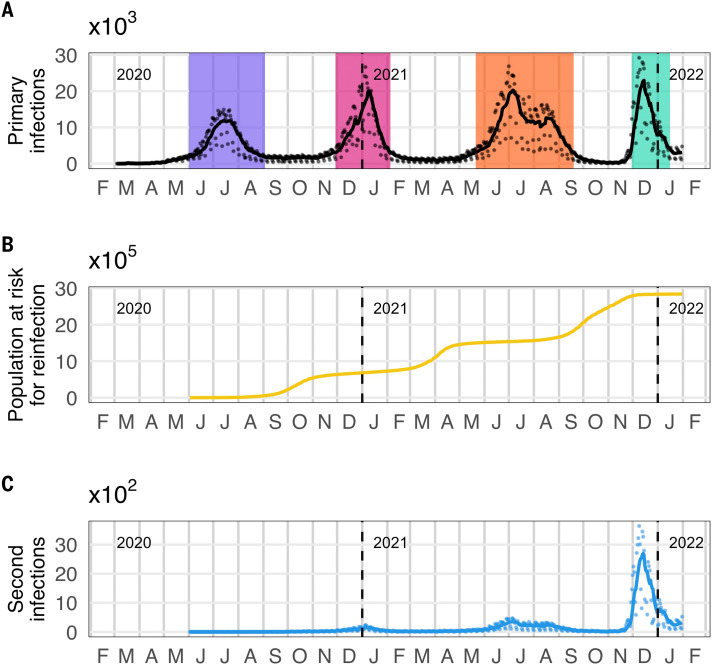
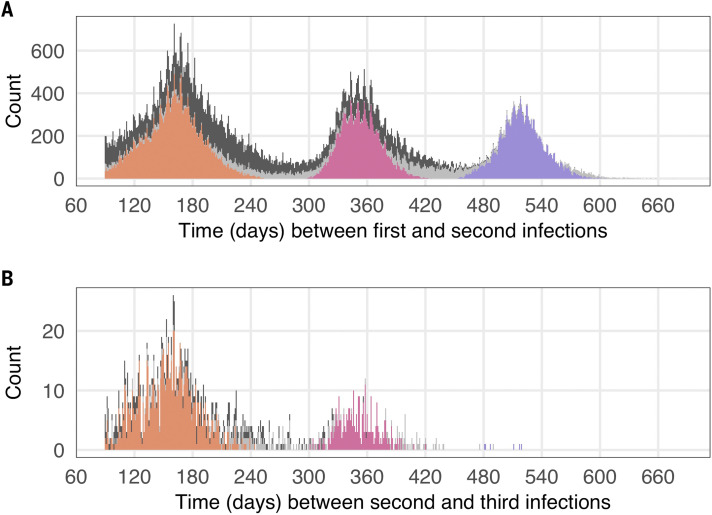
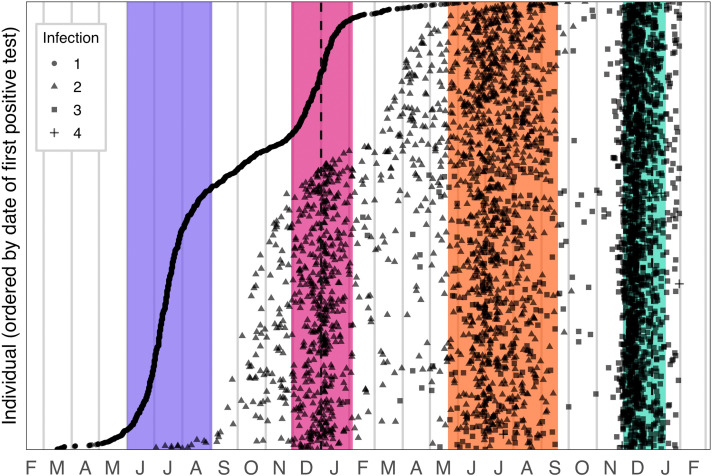
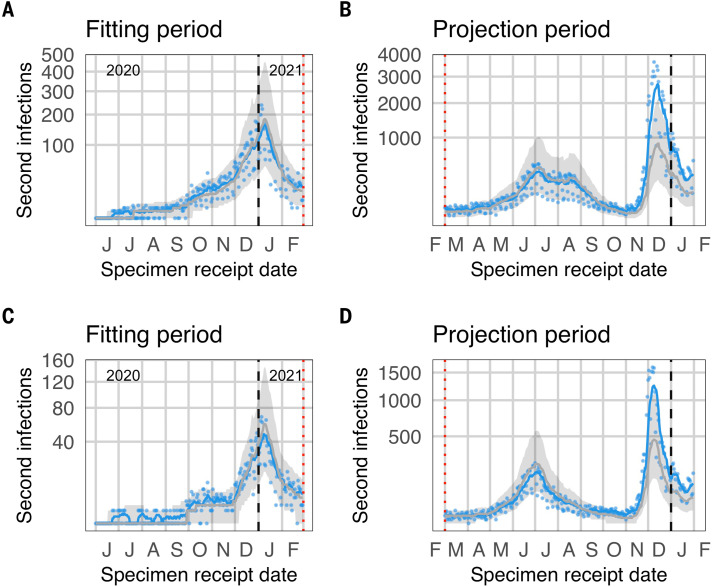
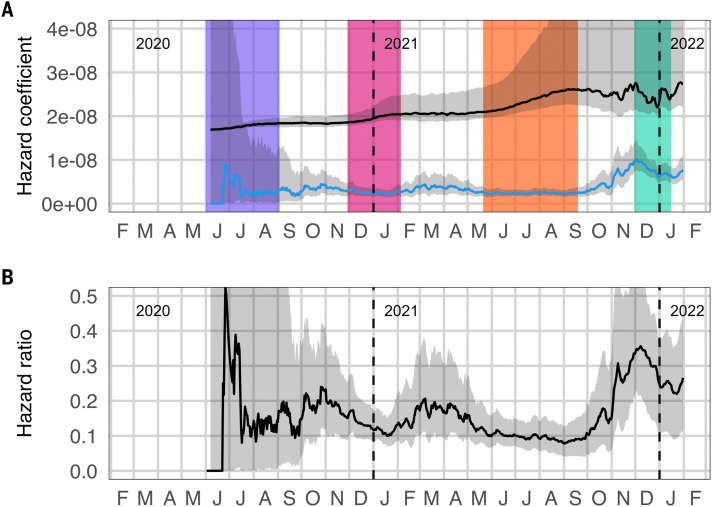
We provide two methods for monitoring reinfection trends in routine surveillance data to identify signatures of changes in reinfection risk and apply these approaches to data from South Africa's severe acute respiratory syndrome coronavirus 2 (SARS-CoV-2) epidemic to date. Although we found no evidence of increased reinfection risk associated with circulation of the Beta (B.1.351) or Delta (B.1.617.2) variants, we did find clear, population-level evidence to suggest immune evasion by the Omicron (B.1.1.529) variant in previously infected individuals in South Africa. Reinfections occurring between 1 November 2021 and 31 January 2022 were detected in individuals infected in all three previous waves, and there has been an increase in the risk of having a third infection since mid-November 2021.
Figures
References
-
- Tegally H., Wilkinson E., Giovanetti M., Iranzadeh A., Fonseca V., Giandhari J., Doolabh D., Pillay S., San E. J., Msomi N., Mlisana K., von Gottberg A., Walaza S., Allam M., Ismail A., Mohale T., Glass A. J., Engelbrecht S., Van Zyl G., Preiser W., Petruccione F., Sigal A., Hardie D., Marais G., Hsiao N. Y., Korsman S., Davies M.-A., Tyers L., Mudau I., York D., Maslo C., Goedhals D., Abrahams S., Laguda-Akingba O., Alisoltani-Dehkordi A., Godzik A., Wibmer C. K., Sewell B. T., Lourenço J., Alcantara L. C. J., Kosakovsky Pond S. L., Weaver S., Martin D., Lessells R. J., Bhiman J. N., Williamson C., de Oliveira T., Detection of a SARS-CoV-2 variant of concern in South Africa. Nature 592, 438–443 (2021). 10.1038/s41586-021-03402-9 - DOI - PubMed
-
- Viana R., Moyo S., Amoako D. G., Tegally H., Scheepers C., Althaus C. L., Anyaneji U. J., Bester P. A., Boni M. F., Chand M., Choga W. T., Colquhoun R., Davids M., Deforche K., Doolabh D., du Plessis L., Engelbrecht S., Everatt J., Giandhari J., Giovanetti M., Hardie D., Hill V., Hsiao N.-Y., Iranzadeh A., Ismail A., Joseph C., Joseph R., Koopile L., Kosakovsky Pond S. L., Kraemer M. U. G., Kuate-Lere L., Laguda-Akingba O., Lesetedi-Mafoko O., Lessells R. J., Lockman S., Lucaci A. G., Maharaj A., Mahlangu B., Maponga T., Mahlakwane K., Makatini Z., Marais G., Maruapula D., Masupu K., Matshaba M., Mayaphi S., Mbhele N., Mbulawa M. B., Mendes A., Mlisana K., Mnguni A., Mohale T., Moir M., Moruisi K., Mosepele M., Motsatsi G., Motswaledi M. S., Mphoyakgosi T., Msomi N., Mwangi P. N., Naidoo Y., Ntuli N., Nyaga M., Olubayo L., Pillay S., Radibe B., Ramphal Y., Ramphal U., San J. E., Scott L., Shapiro R., Singh L., Smith-Lawrence P., Stevens W., Strydom A., Subramoney K., Tebeila N., Tshiabuila D., Tsui J., van Wyk S., Weaver S., Wibmer C. K., Wilkinson E., Wolter N., Zarebski A. E., Zuze B., Goedhals D., Preiser W., Treurnicht F., Venter M., Williamson C., Pybus O. G., Bhiman J., Glass A., Martin D. P., Rambaut A., Gaseitsiwe S., von Gottberg A., de Oliveira T., Rapid epidemic expansion of the SARS-CoV-2 Omicron variant in southern Africa. Nature 10.1038/s41586-022-04411-y (2022). 10.1038/s41586-022-04411-y - DOI - PMC - PubMed
-
- National Institute for Communicable Diseases, “The daily COVID-19 effective reproductive number (R) in South Africa: Week 47 2021” (National Institute for Communicable Diseases, 2021); https://www.nicd.ac.za/wp-content/uploads/2021/11/COVID-19-Effective-Rep....
-
- National Institute for Communicable Diseases, “The daily COVID-19 effective reproductive number (R) in South Africa: Week 51 2021” (National Institute for Communicable Diseases, 2021); https://www.nicd.ac.za/wp-content/uploads/2021/12/COVID-19-Effective-Rep....
MeSH terms
Supplementary concepts
LinkOut - more resources
Full Text Sources
Other Literature Sources
Medical
Miscellaneous
