

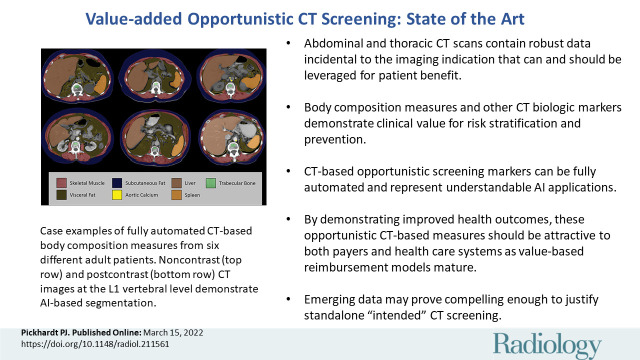
Value-added Opportunistic CT Screening: State of the Art
- PMID: 35289661
- PMCID: PMC9083232
- DOI: 10.1148/radiol.211561
Value-added Opportunistic CT Screening: State of the Art
Erratum in
-
Value-added Opportunistic CT Screening: State of the Art.Radiology. 2022 Jun;303(3):E41. doi: 10.1148/radiol.229010. Radiology. 2022. PMID: 35604845 Free PMC article. No abstract available.
Abstract
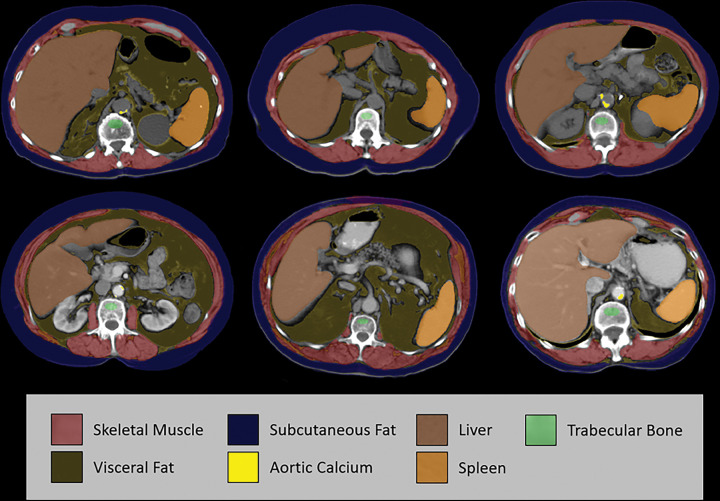
Opportunistic CT screening leverages robust imaging data embedded within abdominal and thoracic scans that are generally unrelated to the specific clinical indication and have heretofore gone largely unused. This incidental imaging information may prove beneficial to patients in terms of wellness, prevention, risk profiling, and presymptomatic detection of relevant disease. The growing interest in CT-based opportunistic screening relates to a confluence of factors: the objective and generalizable nature of CT-based body composition measures, the emergence of fully automated explainable AI solutions, the sheer volume of body CT scans performed, and the increasing emphasis on precision medicine and value-added initiatives. With a systematic approach to body composition and other useful CT markers, initial evidence suggests that their ability to help radiologists assess biologic age and predict future adverse cardiometabolic events rivals even the best available clinical reference standards. Emerging data suggest that standalone "intended" CT screening over an unorganized opportunistic approach may be justified, especially when combined with established cancer screening. This review will discuss the current status of opportunistic CT screening, including specific body composition markers and the various disease processes that may be impacted. The remaining hurdles to widespread clinical adoption include generalization to more diverse patient populations, disparate technical settings, and reimbursement.
© RSNA, 2022.
Conflict of interest statement
Figures
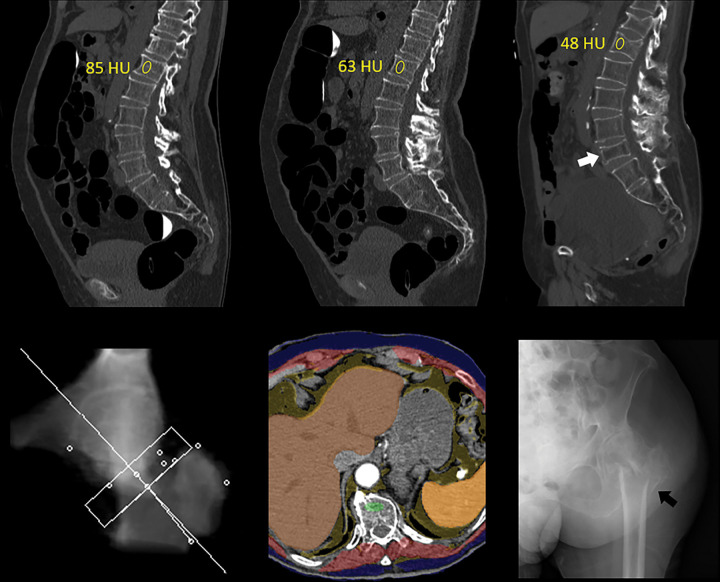
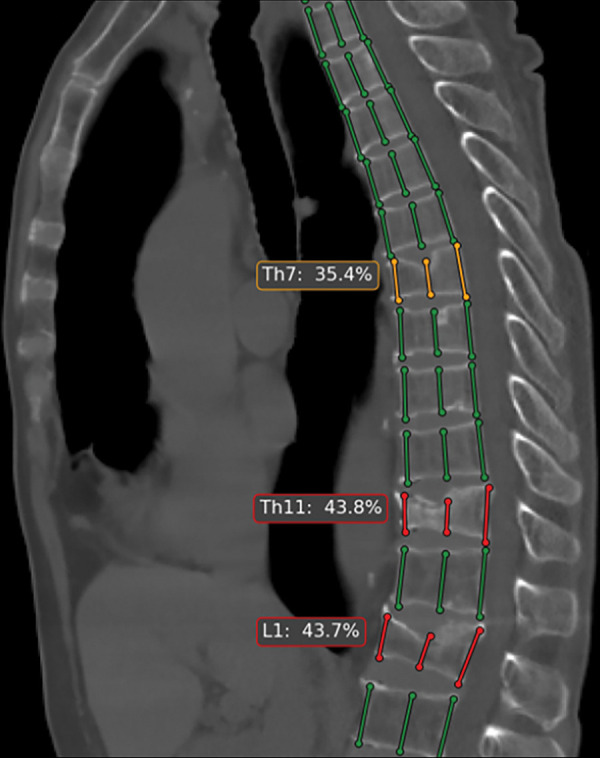
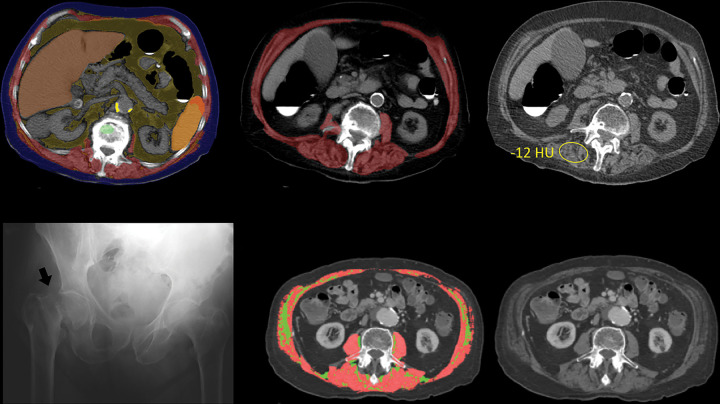
![Unsuspected osteoporosis and sarcopenia (osteosarcopenic obesity) in a
58-year-old woman with subsequent hip fracture. Top row: Sagittal (left) and
L3-level transverse (middle) images from CT examination for unexplained
abdominal pain show a prevalent L1 compression fracture and associated low bone
mineral density (BMD) (L2 region of interest [ROI]), compatible with complicated
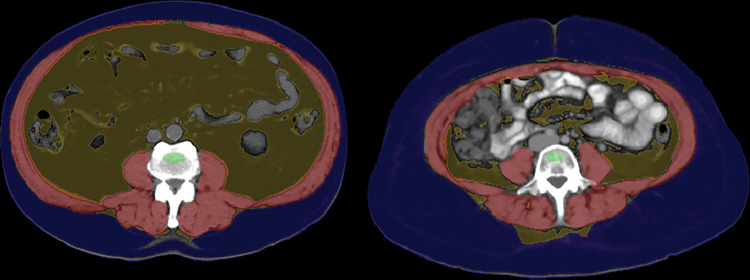
osteoporosis. The same transverse L3-level image (right) shows superimposition
of automated BMD (green) and muscle (red) segmentations, with mean muscle
attenuation of 2 HU, comparing well with the manual paraspinal ROI (4 HU).
Bottom row: Retrospective quantitative CT image (left) shows an osteoporotic
femoral neck T-score of –2.9, but central dual-energy x-ray
absorptiometry examination 2 years later (not shown) was falsely negative for
osteoporosis and also missed the L1 compression. The patient presented 3 months
later with hip pain. Initial pelvic radiograph (middle) was negative, but an MRI
examination later that day (right) revealed a trochanteric fracture with
extension into the metaphysis (arrows), which required internal fixation. Note
also generalized sarcopenia at MRI.](https://cdn.ncbi.nlm.nih.gov/pmc/blobs/0ff2/9083232/422dc5452222/radiol.211561.fig4.jpg)
References
-
- Boutin RD , Lenchik L . Value-added opportunistic CT: insights into osteoporosis and sarcopenia . AJR Am J Roentgenol 2020. ; 215 ( 3 ): 582 – 594 . - PubMed
Publication types
MeSH terms
LinkOut - more resources
Full Text Sources
Medical
