. 2022 Mar 15:11:e73289.
doi: 10.7554/eLife.73289.

Corticofugal regulation of predictive coding

Affiliations

Corticofugal regulation of predictive coding

Alexandria M H Lesicko et al. Elife. .

Abstract

Sensory systems must account for both contextual factors and prior experience to adaptively engage with the dynamic external environment. In the central auditory system, neurons modulate their responses to sounds based on statistical context. These response modulations can be understood through a hierarchical predictive coding lens: responses to repeated stimuli are progressively decreased, in a process known as repetition suppression, whereas unexpected stimuli produce a prediction error signal. Prediction error incrementally increases along the auditory hierarchy from the inferior colliculus (IC) to the auditory cortex (AC), suggesting that these regions may engage in hierarchical predictive coding. A potential substrate for top-down predictive cues is the massive set of descending projections from the AC to subcortical structures, although the role of this system in predictive processing has never been directly assessed. We tested the effect of optogenetic inactivation of the auditory cortico-collicular feedback in awake mice on responses of IC neurons to stimuli designed to test prediction error and repetition suppression. Inactivation of the cortico-collicular pathway led to a decrease in prediction error in IC. Repetition suppression was unaffected by cortico-collicular inactivation, suggesting that this metric may reflect fatigue of bottom-up sensory inputs rather than predictive processing. We also discovered populations of IC units that exhibit repetition enhancement, a sequential increase in firing with stimulus repetition. Cortico-collicular inactivation led to a decrease in repetition enhancement in the central nucleus of IC, suggesting that it is a top-down phenomenon. Negative prediction error, a stronger response to a tone in a predictable rather than unpredictable sequence, was suppressed in shell IC units during cortico-collicular inactivation. These changes in predictive coding metrics arose from bidirectional modulations in the response to the standard and deviant contexts, such that the units in IC responded more similarly to each context in the absence of cortical input. We also investigated how these metrics compare between the anesthetized and awake states by recording from the same units under both conditions. We found that metrics of predictive coding and deviance detection differ depending on the anesthetic state of the animal, with negative prediction error emerging in the central IC and repetition enhancement and prediction error being more prevalent in the absence of anesthesia. Overall, our results demonstrate that the AC provides cues about the statistical context of sound to subcortical brain regions via direct feedback, regulating processing of both prediction and repetition.

Keywords: adaptation; auditory cortex; auditory neuroscience; feedback; inferior colliculus; mouse; neuroscience; predictive coding.


Conflict of interest statement

AL, CA, JB, MD, MG No competing interests declared

Figures
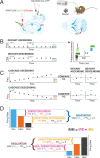
Figure 1.
Figure 1.. Experimental design.
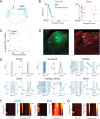
(A) Cre/FLEX dual injections for selective ArchT expression in cortico-collicular neurons. Recordings were performed in the inferior colliculus (IC) while inactivation was mediated by a 532 nm laser connected to cannulas implanted over the auditory cortex (AC). (B) Oddball stimuli consisted of pairs of pure tones separated by 0.5 octave with a 90:10 standard-to-deviant ratio. Two sequences were constructed such that each frequency is represented as both the standard and the deviant. (C) Cascade sequences consisted of 10 evenly spaced tones separated by 0.5 octaves, with both frequencies from the oddball sequence included in the sequence. Responses to tones in the cascade context were compared to responses in the standard and deviant context to analyze repetition and prediction effects, respectively. (D) A positive index of neuronal mismatch (iMM) (top diagram) indicates a stronger response to the deviant than the standard (adaptation), while a negative iMM (bottom diagram) indicates a stronger response to the standard than to the deviant (facilitation). The iMM can be further decomposed into an index of prediction error (iPE) and an index of repetition suppression (iRS). Positive iPE values represent prediction error, and negative values convey negative prediction error. Positive iRS indices indicate repetition suppression, while repetition enhancement is represented by negative values.
Figure 1—figure supplement 1.
Figure 1—figure supplement 1.. Cre/FLEX viral injection strategy enables selective inactivation of cortico-collicular neurons.
(A) Expression of the retroAAV-Cre-GFP construct at the injection site is restricted to the inferior colliculus (IC) (top left). tdTomato-labeled axons are found in a pattern matching the known topographical distribution of cortico-collicular neurons in IC (left bottom). Somatic AAV9-FLEX-ArchT-tdTomato expression is present in layers 5 and 6 of the auditory cortex (AC) (right, inset). (B) Experimental design for recording from AC to confirm the presence of inactivated units. (C) Example of an inactivated unit (i.e., putative cortico- collicular unit) exhibiting a strong reduction in firing during silence and during the presentation of pure tones. (D) Population data demonstrating reduced firing rates during silence and in response to pure tone stimuli in putative cortico-collicular units. Dots represent recorded units. Bar plots represent means over the population n = 20 CC units. Error bars are standard error of the mean.
Figure 1—figure supplement 2.
Figure 1—figure supplement 2.. Parsing of recording sites into central and shell locations.
(A) Experimental design for awake inferior colliculus (IC) recordings in the central and shell regions of IC. (B) Linear fits for best frequency vs. depth in central (left) and shell (right) IC. (C) Sparseness vs. R2 value for linear fit. K-means clustering was performed using these parameters to classify recording sites as either in the shell or central nucleus of IC. Each dot represents a recording site. (D) Left: DiA labeling from an electrode penetration in a recording site classified as a central site. Atlas image overlay confirms that the dye track runs through the central IC (CIC) (Paxinos and Franklin, 2019). Right: DiD labeling from an electrode penetration in a recording site classified as a shell site. Atlas image overlay confirms that the dye track runs through the shell IC (here denoted as ECIC/DCIC). (E) Example raster plots and peristimulus time histograms showing different firing types in the awake IC. Examples of inhibited and mixed types are from single units, while all others are from multiunits. (F) Example tuning curves in central (left) and shell (right) IC. (G) Example of a tuning curve with inhibited side bands.
Figure 2.
Figure 2.. Inferior colliculus (IC) units encode different aspects of prediction and repetition in awake and anesthetized states.
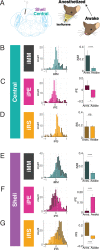
(A) Experimental design for recording in the awake and isoflurane anesthetized IC in the same population of units. (B) Distribution of index of neuronal mismatch (iMM) in the awake vs. anesthetized central IC. Bar plots represent means over the population of n = 39 units. Error bars are standard error of the mean. (C) Index of prediction error (iPE) distribution in the awake vs. anesthetized central IC. (D) Index of repetition suppression (iRS) distribution in the awake vs. anesthetized central IC. (E) Distribution of iMM in the awake vs. anesthetized shell IC. Bar plots represent means over the population of n = 165 units. Error bars are standard error of the mean. (F) iPE distribution in the awake vs. anesthetized shell IC. (G) iRS distribution in the awake vs. anesthetized shell IC. Data is from four recording sessions in one mouse.
Figure 3.
Figure 3.. Adapting and facilitating inferior colliculus (IC) units are differentially affected by cortico-collicular inactivation.
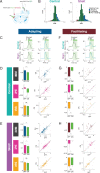
(A) Experimental design for recording in awake IC during laser inactivation of the cortico-collicular pathway. (B) Categorization of units according to whether they displayed significant adaptation, facilitation, or neither (nonadapting). (C) Average peristimulus time histogram for adapting units in central (top) and shell (bottom) IC. Green = during laser inactivation. (D) Index of neuronal mismatch (iMM) (top), index of prediction error (iPE) (middle), and index of repetition suppression (iRS) (bottom) for adapting units in the central nucleus. Dots represent recorded units. Bar plots represent means over the population of n = 52 units. Error bars are standard error of the mean. (E) iMM (top), iPE (middle), and iRS (bottom) for adapting units in shell regions of IC. Dots represent recorded units. Bar plots represent means over the population of n = 113 units. Error bars are standard error of the mean. (F) Average peristimulus time histogram for facilitating units in central (top) and shell (bottom) IC. Green = during laser inactivation. (G) iMM (top), iPE (middle), and iRS (bottom) for facilitating units in the central nucleus. Dots represent recorded units. Bar plots represent means over the population of n = 14 units. Error bars are standard error of the mean. (H) iMM (top), iPE (middle), and iRS (bottom) for facilitating units in shell regions of IC. Dots represent recorded units. Bar plots represent means over the population of n = 38 units. Error bars are standard error of the mean.
Figure 3—figure supplement 1.
Figure 3—figure supplement 1.. Control data.
(A) Experimental design for control experiments. All procedures were performed identically to the experimental group, except with the omission of ArchT from the viral construct injected in the auditory cortex (AC). (B) Comparison of the index of neuronal mismatch (iMM) distribution for control (navy) and experimental (light blue) groups in central (left) and shell (right) inferior colliculus (IC). (C) iMM (top), index of prediction error (iPE) (middle), and index of repetition suppression (iRS) (bottom) for control adapting units in the central nucleus. Dots represent recorded units. Bar plots represent means over the population of n = 18 units. Error bars are standard error of the mean. (D) iMM (top), iPE (middle), and iRS (bottom) for control adapting units in shell regions of IC. Dots represent recorded units. Bar plots represent means over the population of n = 35 units. Error bars are standard error of the mean. (E) iMM (top), iPE (middle), and iRS (bottom) for control facilitating units in the central nucleus. Dots represent recorded units. Bar plots represent means over the population of n = 4 units. Error bars are standard error of the mean. (F) iMM (top), iPE (middle), and iRS (bottom) for control facilitating units in shell regions of IC. Dots represent recorded units. Bar plots represent means over the population of n = 21 units. Error bars are standard error of the mean. (G) iMM (top), iPE (middle), and iRS (bottom) for control nonadapting units in the central nucleus. Dots represent recorded units. Bar plots represent means over the population of n = 55 units. Error bars are standard error of the mean. (H) iMM (top), iPE (middle), and iRS (bottom) for control nonadapting units in shell regions of IC. Dots represent recorded units. Bar plots represent means over the population of n = 63 units. Error bars are standard error of the mean.
Figure 3—figure supplement 2.
Figure 3—figure supplement 2.. Comparison of neuronal responses between the many standards and cascade sequences.
(A) The many standards sequence consists of the same 10 tones found in the cascade sequence, but the tone order is random. Responses to the cascade and many standards sequences were compared to assess whether cross-frequency adaptation or global stimulus regularity affects responses to the cascade condition. (B) Firing rates of adapting units (left) and facilitating units (right) in the central inferior colliculus (IC) to tones in the cascade and many standards contexts. Dots represent recorded units. Bar plots represent means over the population of n = 52 adapting and n = 14 facilitating units. Error bars are standard error of the mean. (C) Firing rates of adapting units (left) and facilitating units (right) in the shell IC to tones in the cascade and many standards contexts. Dots represent recorded units. Bar plots represent means over the population of n = 113 adapting and n = 38 facilitating units. Error bars are standard error of the mean.
Figure 3—figure supplement 3.
Figure 3—figure supplement 3.. Index of neuronal mismatch (iMM) distribution does not differ between single- and multiunit types.
The iMM for laser OFF (x-axis) and laser ON (y-axis) trials for each region of the IC separated by single- (displayed in teal) and multiunits.
Figure 4.
Figure 4.. Nonadapting units also display top-down repetition enhancement.
(A) Distribution of adapting types (adapting, facilitating, and nonadapting) for units in central (left) and shell (right) regions of the inferior colliculus (IC). (B) Average peristimulus time histogram for nonadapting units in central (top) and shell (bottom) IC. (C) Index of neuronal mismatch (iMM) (top), index of prediction error (iPE) (middle), and index of repetition suppression (iRS) (bottom) for nonadapting units in central regions of IC. Dots represent recorded units. Bar plots represent means over the population of n = 155 units. Error bars are standard error of the mean. (D) iMM (top), iPE (middle), and iRS (bottom) for nonadapting units in shell regions of IC. Dots represent recorded units. Bar plots represent means over the population of n = 243 units. Error bars are standard error of the mean.
Figure 5.
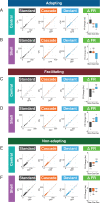
Figure 5.. Standard and deviant responses are bidirectionally modulated by cortico-collicular inactivation.
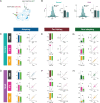
(A) Responses to the standard (left), cascade (middle left), and deviant (middle right) for adapting units in central regions of the inferior colliculus (IC) under baseline and laser conditions. Change in firing rate between the laser and baseline condition for each stimulus (right). Dots represent recorded units. Bar plots represent means over the population of n = 52 units. Error bars are standard error of the mean. (B) Responses to the standard (left), cascade (middle left), and deviant (middle right) for adapting units in shell regions of IC under baseline and laser conditions. Change in firing rate between the laser and baseline condition for each stimulus (right). Dots represent recorded units. Bar plots represent means over the population of n = 113 units. Error bars are standard error of the mean. (C) Responses to the standard (left), cascade (middle left), and deviant (middle right) for facilitating units in central regions of IC under baseline and laser conditions. Change in firing rate between the laser and baseline condition for each stimulus (right). Dots represent recorded units. Bar plots represent means over the population of n = 14 units. Error bars are standard error of the mean. (D) Responses to the standard (left), cascade (middle left), and deviant (middle right) for facilitating units in shell regions of IC under baseline and laser conditions. Change in firing rate between the laser and baseline condition for each stimulus (right). Dots represent recorded units. Bar plots represent means over the population of n = 38 units. Error bars are standard error of the mean. (E) Responses to the standard (left), cascade (middle left), and deviant (middle right) for nonadapting units in central regions of IC under baseline and laser conditions. Change in firing rate between the laser and baseline condition for each stimulus (right). Dots represent recorded units. Bar plots represent means over the population of n = 155 units. Error bars are standard error of the mean. (F) Responses to the standard (left), cascade (middle left), and deviant (middle right) for nonadapting units in shell regions of IC under baseline and laser conditions. Change in firing rate between the laser and baseline condition for each stimulus (right). Dots represent recorded units. Bar plots represent means over the population of n = 243 units. Error bars are standard error of the mean.
Figure 6.
Figure 6.. Inferior colliculus (IC) units exhibit distinct combinations of index of prediction error (iPE) and index of repetition suppression (iRS).
(A) Distribution of both iRS and iPE in adapting (left), facilitating (middle), and nonadapting (right) units in central IC. (B) Plots of distributions of both iRS and iPE in adapting (left), facilitating (middle), and nonadapting (right) units in shell IC. (C) Response to three subsequent standards prior to or following the deviant in facilitating units in central IC. Comparison between the last standard before and the first standard after the deviant demonstrates significant repetition enhancement. Bar plots represent means over the population of n = 14 units. Error bars are standard error of the mean. (D) Response to three subsequent standards prior to or following the deviant in facilitating units in shell IC. Comparison between the last standard before and the first standard after the deviant demonstrates significant repetition enhancement. Bar plots represent means over the population of n = 38 units. Error bars are standard error of the mean.
Figure 7.
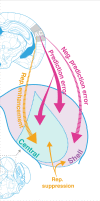
Figure 7.. Corticofugal regulation of predictive coding.
Laser inactivation led to the abolishment of repetition enhancement in central facilitating units and the abolishment of negative prediction error in shell facilitating units. Prediction error decreased during inactivation for adapting units in both shell and central regions of the inferior colliculus (IC). Repetition suppression remained unaffected during cortical inactivation, suggesting that it may reflect fatigue of bottom-up sensory inputs.

References

    1. Aitkin LM, Webster WR, Veale JL, Crosby DC. Inferior colliculus. I. Comparison of response properties of neurons in central, pericentral, and external nuclei of adult cat. Journal of Neurophysiology. 1975;38:1196–1207. doi: 10.1152/jn.1975.38.5.1196. - DOI - PubMed
    1. Anderson LA, Christianson GB, Linden JF. Stimulus-specific adaptation occurs in the auditory thalamus. The Journal of Neuroscience. 2009;29:7359–7363. doi: 10.1523/JNEUROSCI.0793-09.2009. - DOI - PMC - PubMed
    1. Anderson L A, Malmierca MS. The effect of auditory cortex deactivation on stimulus‐specific adaptation in the inferior colliculus of the rat. The European Journal of Neuroscience. 2013;37:52–62. doi: 10.1111/ejn.12018. - DOI - PubMed
    1. Antunes FM, Nelken I, Covey E, Malmierca MS. Stimulus-specific adaptation in the auditory thalamus of the anesthetized rat. PLOS ONE. 2010;5:e14071. doi: 10.1371/journal.pone.0014071. - DOI - PMC - PubMed
    1. Antunes FM, Malmierca MS. Effect of auditory cortex deactivation on stimulus-specific adaptation in the medial geniculate body. The Journal of Neuroscience. 2011;31:17306–17316. doi: 10.1523/JNEUROSCI.1915-11.2011. - DOI - PMC - PubMed

Publication types