. 2022 May 16;132(10):1-13.
doi: 10.1172/JCI154611.

A Piezo1/KLF15/IL-6 axis mediates immobilization-induced muscle atrophy

Affiliations

A Piezo1/KLF15/IL-6 axis mediates immobilization-induced muscle atrophy

Yu Hirata et al. J Clin Invest. .

Abstract

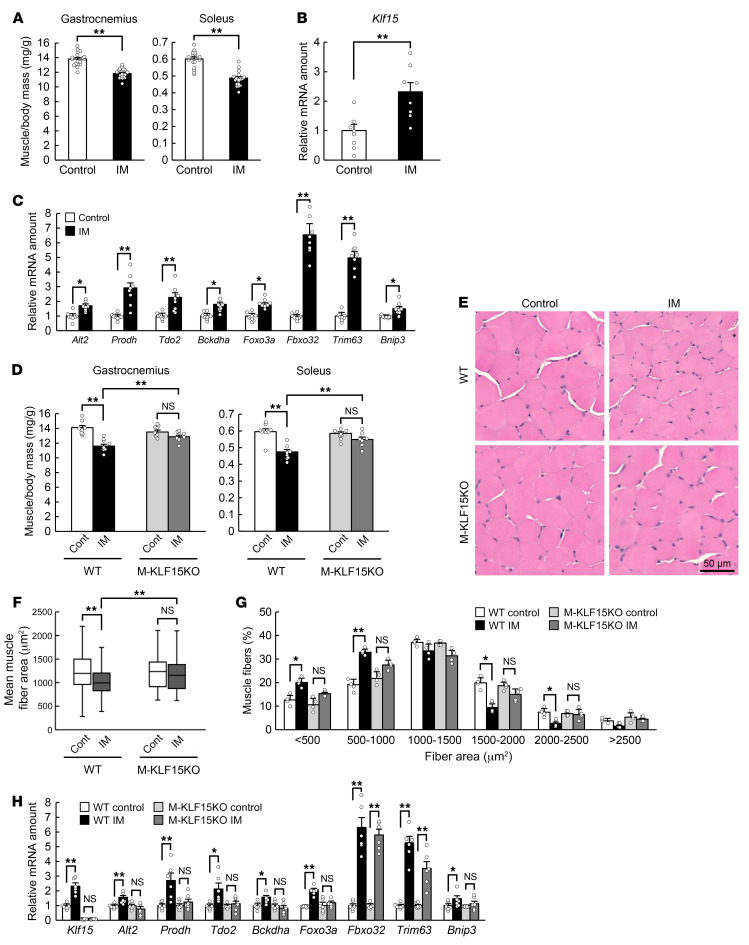
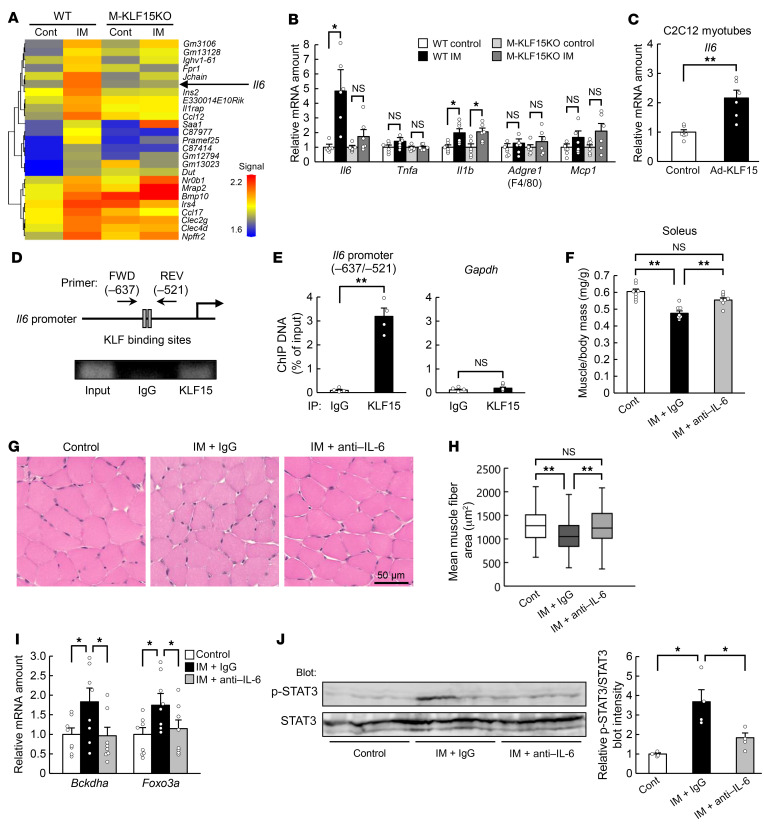
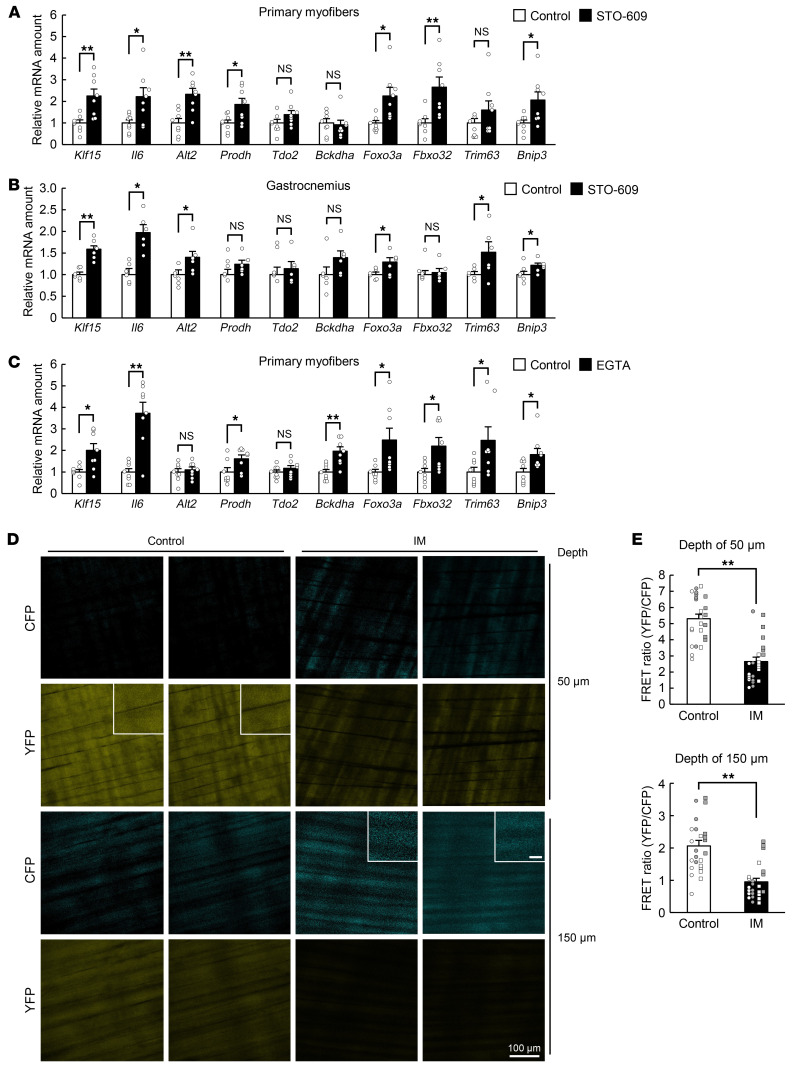
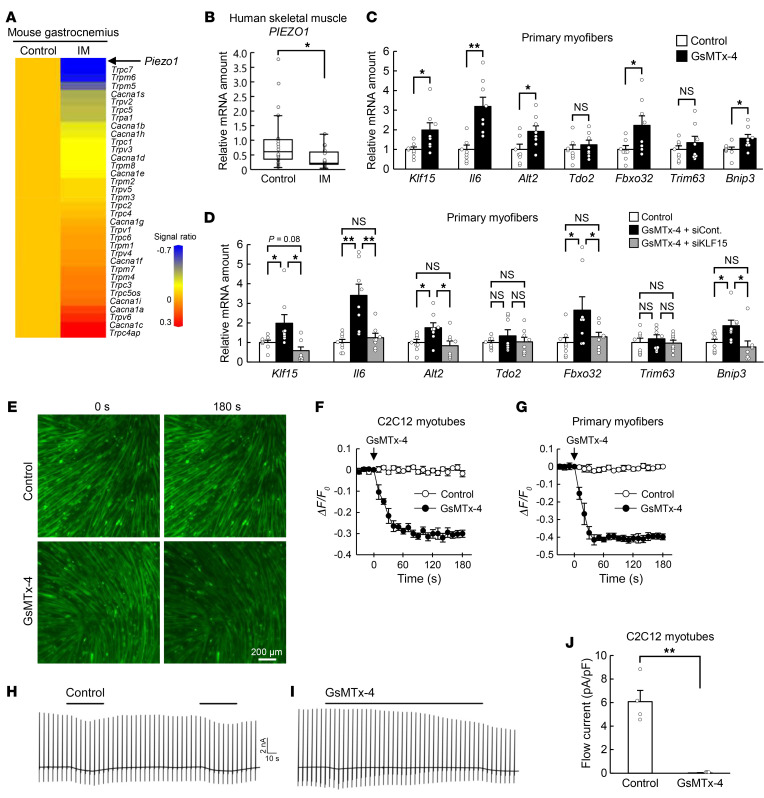
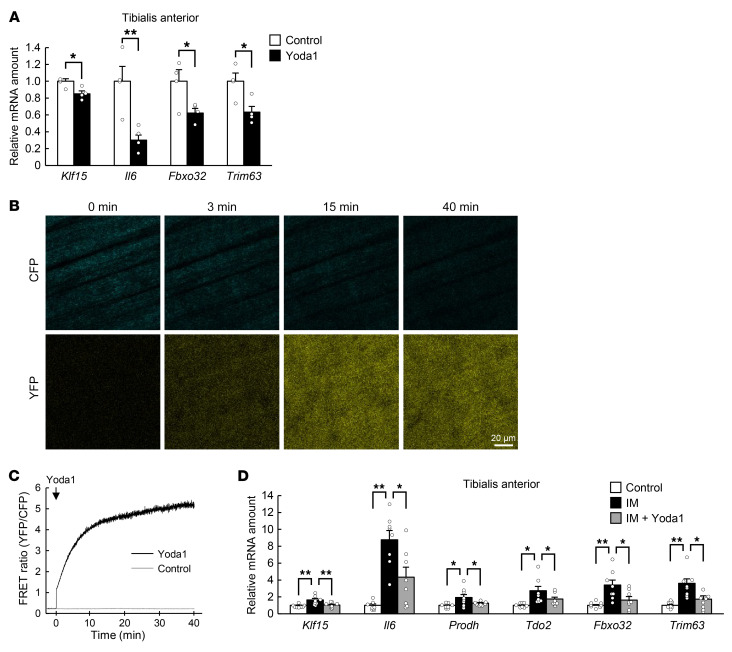
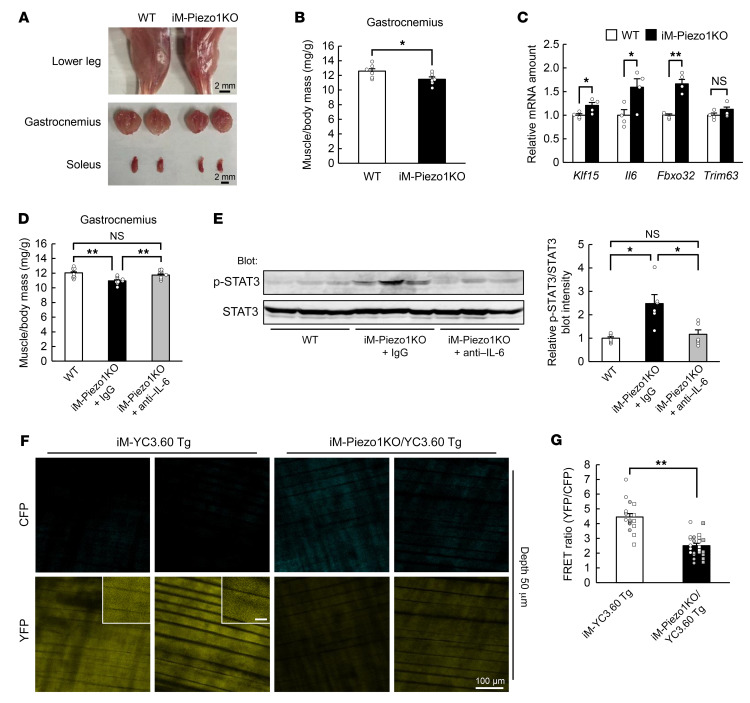
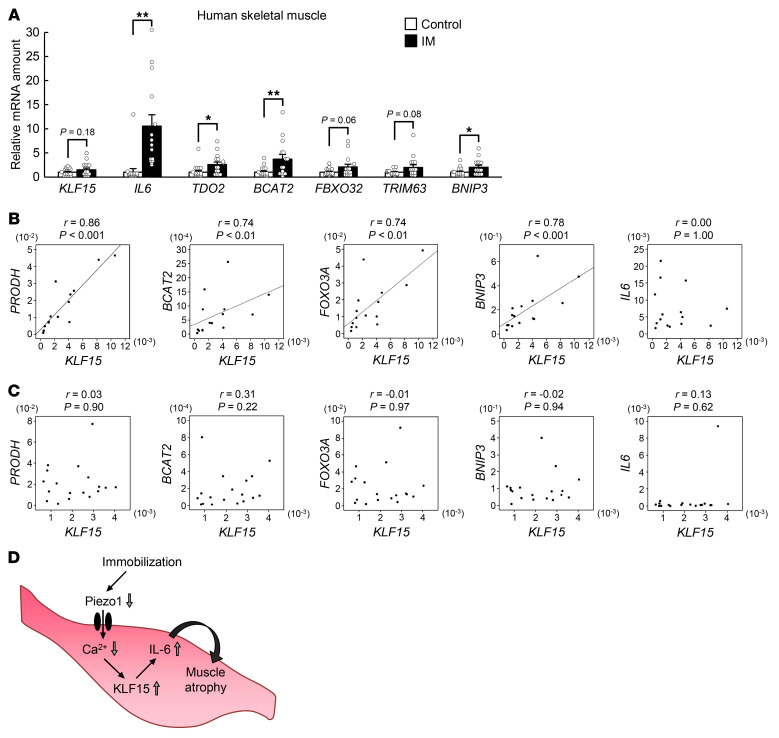
Although immobility is a common cause of muscle atrophy, the mechanism underlying this causality is unclear. We here show that Krüppel-like factor 15 (KLF15) and IL-6 are upregulated in skeletal muscle of limb-immobilized mice and that mice with KLF15 deficiency in skeletal muscle or with systemic IL-6 deficiency are protected from immobility-induced muscle atrophy. A newly developed Ca2+ bioimaging revealed that the cytosolic Ca2+ concentration ([Ca2+]i) of skeletal muscle is reduced to below the basal level by immobilization, which is associated with the downregulation of Piezo1. Acute disruption of Piezo1 in skeletal muscle induced Klf15 and Il6 expression as well as muscle atrophy, which was prevented by antibodies against IL-6. A role for the Piezo1/KLF15/IL-6 axis in immobility-induced muscle atrophy was validated in human samples. Our results thus uncover a paradigm for Ca2+ signaling in that a decrease in [Ca2+]i from the basal level triggers a defined biological event.

Keywords: Calcium signaling; Metabolism; Muscle Biology; Skeletal muscle.


Conflict of interest statement

Conflict of interest: The authors have declared that no conflict of interest exists.

Figures

Figure 1
Figure 1. Skeletal muscle atrophy triggered by immobilization is prevented in mice with KLF15 deficiency in skeletal muscle.
(A) Ratio of gastrocnemius or soleus muscle mass in both hind limbs to body mass for control mice or mice subjected to bilateral hind limb immobilization (IM) with a cast for 3 days (n = 18 mice). (B and C) Quantitative RT-PCR analysis of Klf15 mRNA (B) and of atrophy-related gene expression (C) in gastrocnemius of mice as in A (n = 8 mice). (D) Ratio of muscle mass to body mass for WT or M-KLF15KO mice subjected to cast immobilization for 3 days or for corresponding control (Cont) mice (n = 8 mice). (EG) Hematoxylin-eosin staining (E) for determination of muscle fiber area (F) and the distribution of muscle fiber area (G) in soleus of mice as in D (n = 8 mice). The area of 800 fibers pooled from 4 mice was measured and averaged for each condition in F. Scale bar: 50 μm. (H) Quantitative RT-PCR analysis of atrophy-related gene expression in gastrocnemius of mice as in D (n = 6 mice). Quantitative data are mean ± SEM (AD, G, and H) or medians (F). *P < 0.05, **P < 0.01 by unpaired Student’s t test (AC) or 2-way ANOVA with Bonferroni’s post hoc test (D and FH). NS, not significant.
Figure 2
Figure 2. IL-6 is a downstream effector of KLF15 in immobilization-induced muscle atrophy.
(A) DNA microarray analysis of gene expression in gastrocnemius of WT or M-KLF15KO mice after cast immobilization (IM) of the hind limbs for 3 days. The heatmap shows genes for humoral factors whose expression was upregulated in immobilized WT mice compared with control WT mice. (B) Quantitative RT-PCR analysis of inflammation-related gene expression in gastrocnemius of mice as in A (n = 6 mice). (C) Quantitative RT-PCR analysis of Il6 mRNA (n = 6 independent experiments) in C2C12 myotubes infected with an adenovirus encoding LacZ (control) or mouse KLF15 (Ad-KLF15). (D and E) ChIP assay of KLF15 binding to the mouse Il6 promoter region in C2C12 myotubes. Immunoprecipitation (IP) was performed with antibodies against KLF15 or with control immunoglobulin G (IgG). A schematic representation of the promoter region indicating the positions of putative KLF binding sites and PCR primers as well as representative gel electrophoresis of PCR products are shown in D. Quantitative data for the ChIP analysis of KLF15 binding to the Il6 promoter region or to Gapdh (negative control) are shown in E (n = 4 independent experiments). (FJ) Ratio of muscle mass to body mass (n = 8 mice) (F), histological determination of muscle fiber area in soleus (G and H), atrophy-related gene expression in gastrocnemius (n = 8 mice) (I), and immunoblot analysis of total and phosphorylated (p-) forms of STAT3 in gastrocnemius (n = 4 mice) (J) are shown for control or cast-immobilized mice subjected to intraperitoneal injection of neutralizing antibodies against IL-6 (0.1 mg/mouse) or control IgG at the onset of limb immobilization. Scale bar: 50 μm (G). The area of 800 fibers pooled from 4 mice was measured for each condition in H. Quantitative data are mean ± SEM (B, C, E, F, I, and J) or medians (H). *P < 0.05, **P < 0.01 by unpaired Student’s t test (C and E) or 2-way ANOVA with Bonferroni’s post hoc test (B, F, and HJ). NS, not significant.
Figure 3
Figure 3. A decrease in [Ca2+]i to below the basal level is associated with muscle atrophy.
(A and C) Quantitative RT-PCR analysis of the expression of atrophy-related genes, including Klf15 and Il6, in mouse primary myofibers exposed to 2 μM STO-609 or vehicle (control) for 24 hours (n = 8 independent experiments) (A) or to 0.1 mM EGTA or vehicle (control) for 3 hours (n = 8 independent experiments) (C). (B) Quantitative RT-PCR analysis of atrophy-related gene expression in gastrocnemius of WT mice at 6 hours after intraperitoneal injection of STO-609 (10.4 mg/kg) or vehicle (control) (n = 6 mice). (D and E) Intravital Ca2+ imaging of M-YC3.60–Tg mice. Representative 2-photon images of CFP and YFP fluorescence at a depth of 50 or 150 μm from the fascia of the tibialis anterior muscle subjected (or not, control) to immobilization (IM) for 24 hours are shown in D. Scale bars: 100 μm (main panels) and 20 μm (insets). Quantitation of the FRET ratio in areas of 6 fibers for each of 4 mice is shown in E, with white or gray circles or squares indicating the values obtained from individual animals. All quantitative data are mean ± SEM. *P < 0.05, **P < 0.01 by unpaired Student’s t test. NS, not significant.
Figure 4
Figure 4. Piezo1 regulates muscle atrophy–related gene expression in a KLF15-dependent manner.
(A) Heatmap for DNA microarray analysis of downregulated (top) and upregulated (bottom) genes for Ca2+ channels of the cell membrane in gastrocnemius of mice subjected to cast immobilization (IM) for 3 days compared with control mice. (B) Quantitative RT-PCR analysis of PIEZO1 mRNA in skeletal muscle of control (n = 18) or immobilized (n = 15) human participants. (C) Quantitative RT-PCR analysis of the expression of atrophy-related genes, including Klf15 and Il6, in mouse primary myofibers exposed to 50 μM GsMTx-4 or vehicle (control) for 6 hours (n = 8 independent experiments). (D) Quantitative RT-PCR analysis of the expression of atrophy-related genes, including Klf15 and Il6, in mouse primary myofibers exposed to vehicle (control) or 50 μM GsMTx-4 as well as those transfected with control (siCont) or KLF15 (siKLF15) siRNAs for 6 hours (n = 8 independent experiments). (EG) Fluorescence microscopic images of C2C12 myotubes loaded with Fluo-8 were obtained before and after exposure to 10 μM GsMTx-4 or vehicle (control) for 180 seconds (E). Scale bar: 200 μm. The time course of fluorescence intensity was also measured in C2C12 myotubes (n = 4 independent experiments) (F) or mouse primary myofibers (n = 4 independent experiments) (G). (HJ) Representative whole-cell patch-clamp traces show that application of flow (black bars) induced inward currents in C2C12 myotubes (control) (H), and that such currents were inhibited by GsMTx-4 (5 μM) (I). Ramp pulses (from –100 to +100 mV for 500 ms) were applied at 5-second intervals. The holding potential was –60 mV. The amplitude (as current density) of flow-induced currents in both control and GsMTx-4 conditions was quantified (n = 4 independent experiments) (J). Quantitative data are medians (B) or mean ± SEM (C, D, F, G, and J). *P < 0.05, **P < 0.01 by Mann-Whitney U test (B), unpaired Student’s t test (C and J), or 2-way ANOVA with Bonferroni’s post hoc test (D). NS, not significant.
Figure 5
Figure 5. Effect of a Piezo1 channel activator on immobilization-induced muscle atrophy.
(A) Quantitative RT-PCR analysis of the expression of atrophy-related genes, including Klf15 and Il6, in the tibialis anterior muscle of WT mice at 6 hours after intramuscular injection of Yoda1 (0.2 mg/kg) or vehicle (control) (n = 4 mice). (B and C) Intravital Ca2+ imaging of M-YC3.60–Tg mice. Representative 2-photon images of CFP and YFP fluorescence at the indicated times after intramuscular injection of Yoda1 at 0.2 mg/kg (B) as well as the time course of the FRET ratio (n = 4 mice) (C) are shown for the tibialis anterior of M-YC3.60–Tg mice. Scale bar: 20 μm. (D) Quantitative RT-PCR analysis of the expression of atrophy-related genes, including Klf15 and Il6, in tibialis anterior of control mice or mice subjected to cast immobilization (IM) for 3 days with or without intramuscular injection of Yoda1 (0.2 mg/kg) at the onset of immobilization (n = 8 mice). All quantitative data are mean ± SEM. *P < 0.05, **P < 0.01 by unpaired Student’s t test (A) or 2-way ANOVA with Bonferroni’s post hoc test (D).
Figure 6
Figure 6. The phenotype of tamoxifen-inducible skeletal muscle–specific Piezo1 KO (iM-Piezo1KO) mice.
(AC) Representative images of the lower hind limb, gastrocnemius, and soleus (A), the ratio of gastrocnemius muscle mass to body mass (n = 6 mice) (B), and quantitative RT-PCR analysis of the expression of atrophy-related genes, including Klf15 and Il6, in gastrocnemius (n = 4 mice) (C) for WT or tamoxifen-treated iM-Piezo1KO mice. Scale bars: 2 mm. (D and E) Ratio of muscle mass to body mass (n = 9 mice) (D), and immunoblot analysis of total and phosphorylated (p-) forms of STAT3 in gastrocnemius (n = 6 mice) (E) are shown for WT or iM-Piezo1KO mice subjected to intraperitoneal injection of neutralizing antibodies against IL-6 (0.1 mg/mouse) or control IgG at the onset of tamoxifen treatment. (F and G) Intravital Ca2+ imaging of iM-Piezo1KO/YC3.60–Tg mice. Representative 2-photon images of CFP and YFP fluorescence at a depth of 50 μm from the fascia of the tibialis anterior muscle for tamoxifen-treated iM-YC3.60–Tg mice or iM-Piezo1KO/YC3.60–Tg mice are shown in F. Scale bars: 100 μm (main panels) and 20 μm (insets). Quantitation of the FRET ratio in areas of 6 fibers for each of 3 (iM-YC3.60 Tg) or 4 (iM-Piezo1KO/YC3.60 Tg) hind limbs is shown in G, with white or gray circles or squares indicating the values obtained from individual hind limbs. All quantitative data are mean ± SEM. *P < 0.05, **P < 0.01 by unpaired Student’s t test (B, C, and G) or 2-way ANOVA with Bonferroni’s post hoc test (D and E). NS, not significant.
Figure 7
Figure 7. Role of KLF15 in regulation of muscle atrophy–related gene expression in humans.
(A) Quantitative RT-PCR analysis of atrophy-related genes, including KLF15 and IL6, in skeletal muscle of control (n = 18) or immobilized (IM, n = 15) human participants. Data are mean ± SEM. *P < 0.05, **P < 0.01 by unpaired Student’s t test. (B and C) Spearman’s rank correlation analysis for the expression of KLF15 and that of other muscle atrophy–related genes in skeletal muscle of immobilized patients (n = 15) (B) or control participants (n = 18) (C). (D) Proposed role for a Piezo1/KLF15/IL-6 axis in immobilization-induced muscle atrophy.

Comment in

References

    1. Kalyani RR, et al. Age-related and disease-related muscle loss: the effect of diabetes, obesity, and other diseases. Lancet Diabetes Endocrinol. 2014;2(10):819–829. doi: 10.1016/S2213-8587(14)70034-8. - DOI - PMC - PubMed
    1. Chin ER. The role of calcium and calcium/calmodulin-dependent kinases in skeletal muscle plasticity and mitochondrial biogenesis. Proc Nutr Soc. 2004;63(2):279–286. doi: 10.1079/PNS2004335. - DOI - PubMed
    1. Clapham DE. Calcium signaling. Cell. 2007;131(6):1047–1058. doi: 10.1016/j.cell.2007.11.028. - DOI - PubMed
    1. Hirata Y, et al. Hyperglycemia induces skeletal muscle atrophy via a WWP1/KLF15 axis. JCI Insight. 2019;4(4):e124952. doi: 10.1172/jci.insight.124952. - DOI - PMC - PubMed
    1. Bothe GW, et al. Selective expression of Cre recombinase in skeletal muscle fibers. Genesis. 2000;26(2):165–166. doi: 10.1002/(SICI)1526-968X(200002)26:2<165::AID-GENE22>3.0.CO;2-F. - DOI - PubMed

Publication types