. 2022 Apr 22;7(8):e156341.
doi: 10.1172/jci.insight.156341.

Single-cell transcriptomics reveals distinct effector profiles of infiltrating T cells in lupus skin and kidney

Affiliations

Single-cell transcriptomics reveals distinct effector profiles of infiltrating T cells in lupus skin and kidney

Garrett S Dunlap et al. JCI Insight. .

Abstract

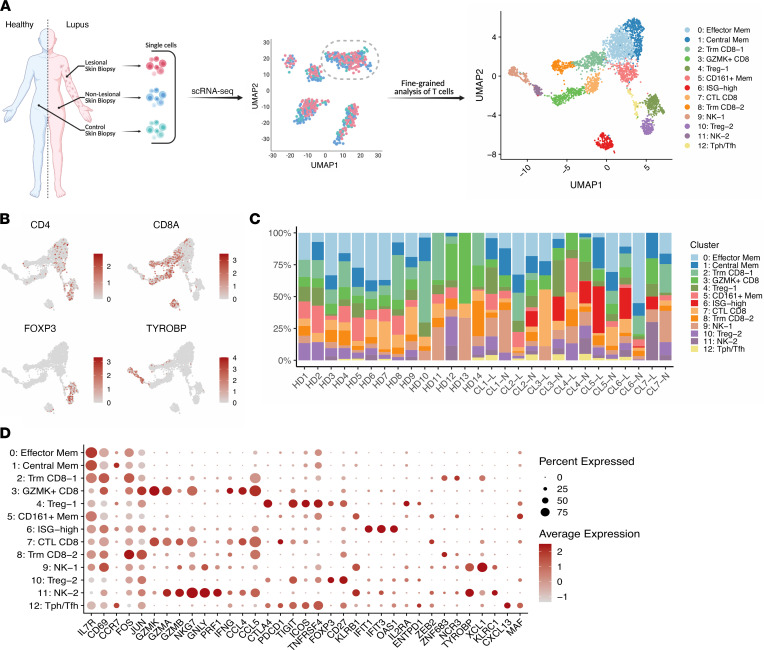
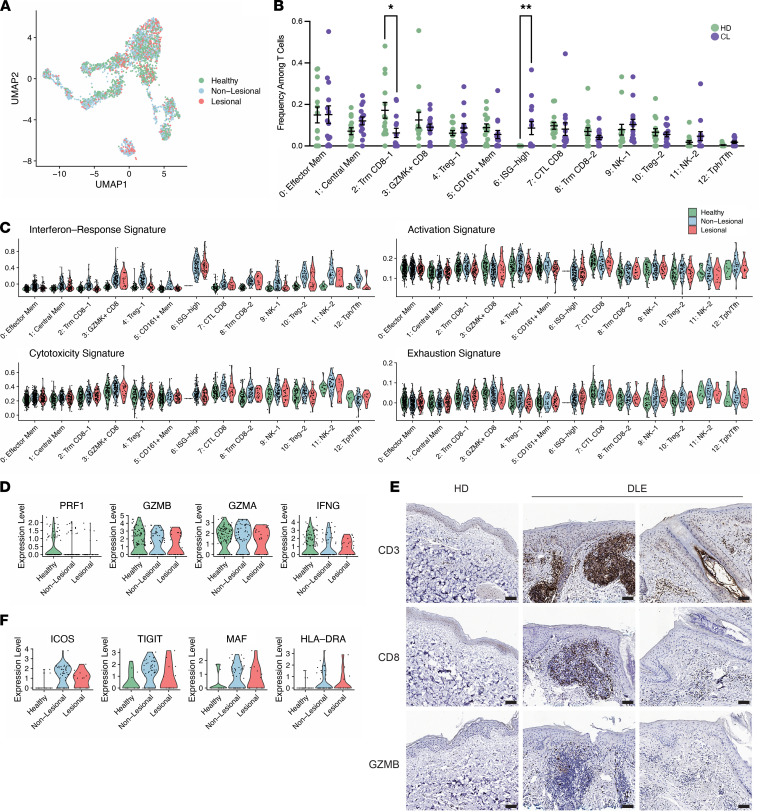
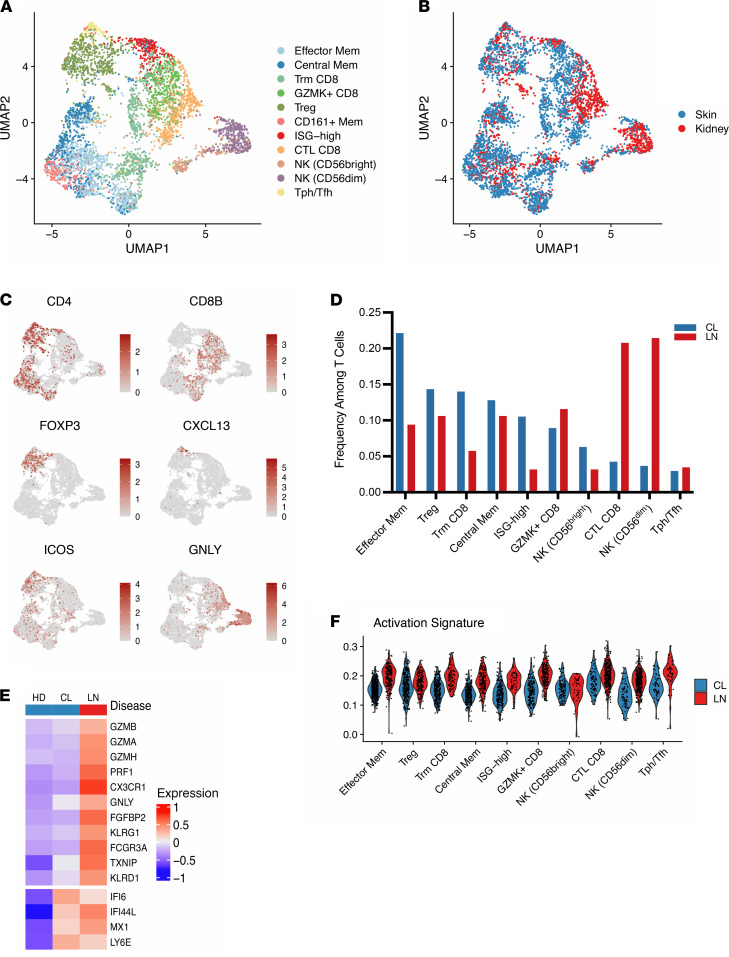
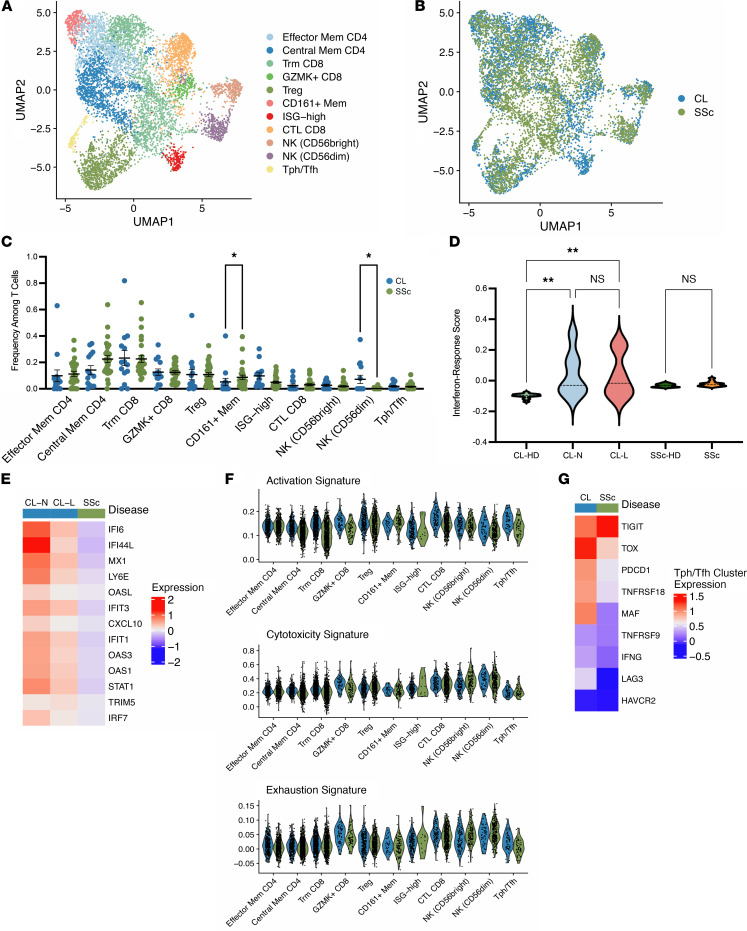
Cutaneous lupus is commonly present in patients with systemic lupus erythematosus (SLE). T cells have been strongly suspected to contribute to the pathology of cutaneous lupus; however, our understanding of the relevant T cell phenotypes and functions remains incomplete. Here, we present a detailed single-cell RNA-Seq profile of T and NK cell populations present within lesional and nonlesional skin biopsies of patients with cutaneous lupus. T cells across clusters from lesional and nonlesional skin biopsies expressed elevated levels of IFN-simulated genes (ISGs). Compared with T cells from control skin, however, T cells from cutaneous lupus lesions did not show elevated expression profiles of activation, cytotoxicity, or exhaustion. Integrated analyses indicated that skin lymphocytes appeared less activated and lacked the expanded cytotoxic populations prominent in lupus nephritis kidney T/NK cells. Comparison of skin T cells from lupus and systemic sclerosis skin biopsies further revealed an elevated ISG signature specific to cells from lupus biopsies. Overall, these data represent the first detailed transcriptomic analysis to our knowledge of the T and NK cells in cutaneous lupus at the single-cell level and have enabled a cross-tissue comparison that highlights stark differences in composition and activation of T/NK cells in distinct tissues in lupus.

Keywords: Adaptive immunity; Autoimmunity; Skin; T cells.


Figures

Figure 1
Figure 1. Identification of T and NK cell states in lesional and nonlesional skin biopsies of cutaneous lupus patients.
(A) Schematic diagram of study, including sample collection, initial scRNA-Seq, and fine clustering of T cell subsets. (B) UMAP plots of main T cell lineage marker expression. (C) Bar plot of cluster assignments for captured cells in each sample. (D) Dot plot of differentially expressed genes in each identified cluster. HD, healthy donor; CL, cutaneous lupus; L, lesional; N, nonlesional.
Figure 2
Figure 2. Examination of differences between lesional, nonlesional, and healthy skin biopsies.
(A) UMAP plot of cells colored by sample type. (B) Comparison of the frequencies of T cells per cluster between cutaneous lupus (CL) patients and healthy donors (HD). (C) Violin plots of signature scores between healthy, lesional, and nonlesional cell components of each cluster. (D) Violin plots of the expression of select markers between healthy, lesional, and nonlesional cell components of the CTL CD8 cluster. (E) Representative IHC staining for CD3, CD8, and GZMB in healthy donor and discoid lupus erythematosus (DLE) skin biopsy samples. n = 4 biopsies used for IHC in both groups. Scale bars: 100 μM. (F) Violin plots of the expression of select markers between healthy, lesional, and nonlesional cell components of the Tph/Tfh cluster. Data are shown as mean ± SEM. *P < 0.05, **P < 0.01 by Kruskal-Wallis test in B.
Figure 3
Figure 3. Integration of cutaneous lupus and lupus nephritis single-cell data sets reveals decreased cytotoxic profiles in the skin T cells.
(A) UMAP plot of the cluster identifications resulting from canonical correlation analysis (CCA) integration. (B) UMAP plot of the location of cells from each study. (C) Representative UMAP plots of select major lineage markers. (D) Comparison of the frequencies of T cells per cluster between cells from cutaneous lupus (CL) and lupus nephritis (LN) data sets. (E) Scaled heatmap of cytotoxic genes (top) and select IFN-stimulated genes (bottom). (F) Violin plot of the activation signature scores between CL and LN cells for each cluster.
Figure 4
Figure 4. Integration of cutaneous lupus and systemic sclerosis single-cell data sets demonstrates selective ISG upregulation in lupus.
(A) UMAP plot of the cluster identifications resulting from CCA integration. (B) UMAP plot of the location of cells from each study. (C) Comparison of the frequencies of T cells per cluster between cells from cutaneous lupus (CL) and systemic sclerosis (SSc) data sets. (D) Violin plot of IFN response signatures between study and sample types. (E) Scaled heatmap of IFN-stimulated genes. (F) Violin plots of signature scores between CL and SSc cells for each cluster. (G) Scaled heatmap of select activation and exhaustion markers in the Tph/Tfh cluster. Data are shown as mean ± SEM. *P < 0.05, **P < 0.01 by Kruskal-Wallis test in C and D.

References

    1. Kaul A, et al. Systemic lupus erythematosus. Nat Rev Dis Primers. 2016;2:16039. doi: 10.1038/nrdp.2016.39. - DOI - PubMed
    1. Stannard JN, Kahlenberg JM. Cutaneous lupus erythematosus: updates on pathogenesis and associations with systemic lupus. Curr Opin Rheumatol. 2016;28(5):453–459. doi: 10.1097/BOR.0000000000000308. - DOI - PMC - PubMed
    1. Shi H, et al. Treatment of cutaneous lupus erythematosus: current approaches and future strategies. Curr Opin Rheumatol. 2020;32(3):208–214. doi: 10.1097/BOR.0000000000000704. - DOI - PMC - PubMed
    1. Bocharnikov AV, et al. PD-1hiCXCR5- T peripheral helper cells promote B cell responses in lupus via MAF and IL-21. JCI Insight. 2019;4(20):e130062. doi: 10.1172/jci.insight.130062. - DOI - PMC - PubMed
    1. Liarski VM, et al. Cell distance mapping identifies functional T follicular helper cells in inflamed human renal tissue. Sci Transl Med. 2014;6(230):230ra46. - PMC - PubMed

Publication types