. 2022 Mar 15;17(3):e0265422.
doi: 10.1371/journal.pone.0265422. eCollection 2022.

Intrinsically disordered signaling proteins: Essential hub players in the control of stress responses in Saccharomyces cerevisiae

Affiliations

Intrinsically disordered signaling proteins: Essential hub players in the control of stress responses in Saccharomyces cerevisiae

Leidys French-Pacheco et al. PLoS One. .

Abstract

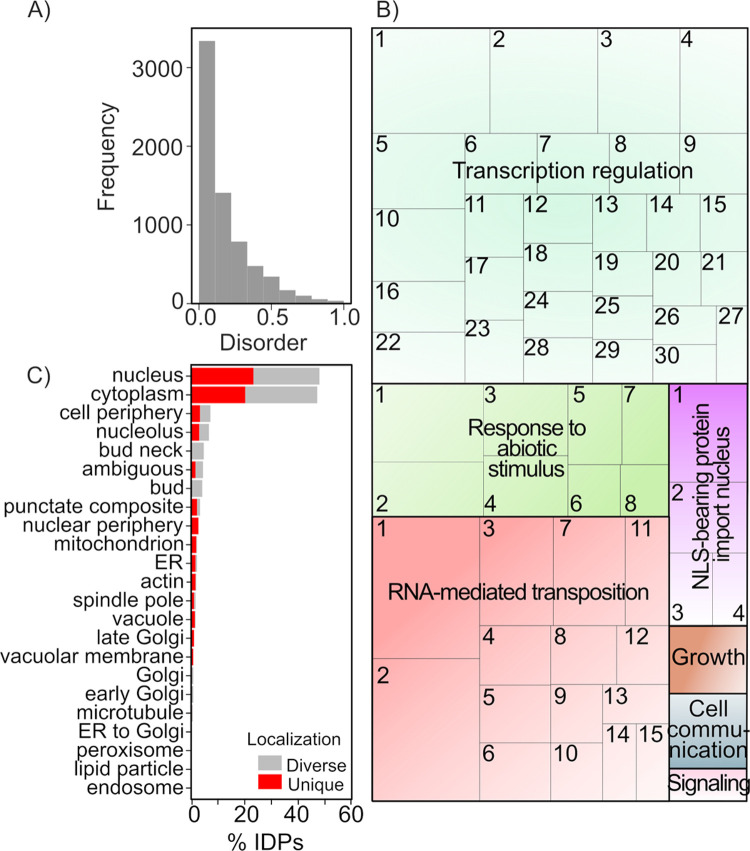
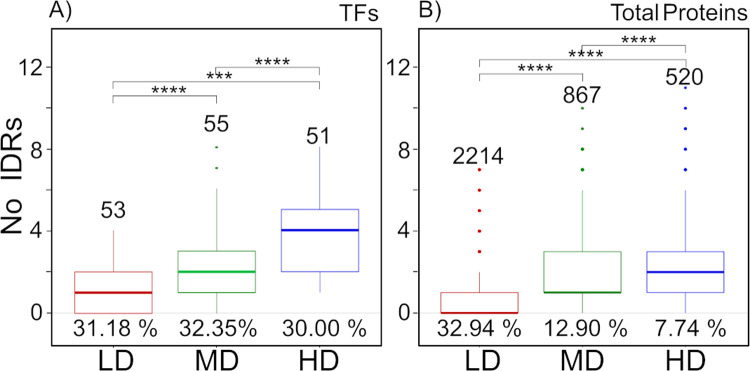
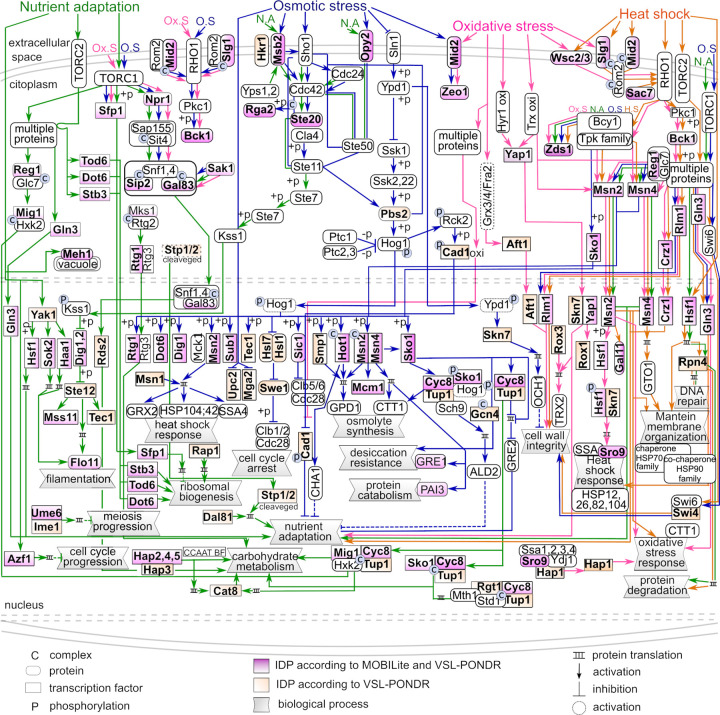
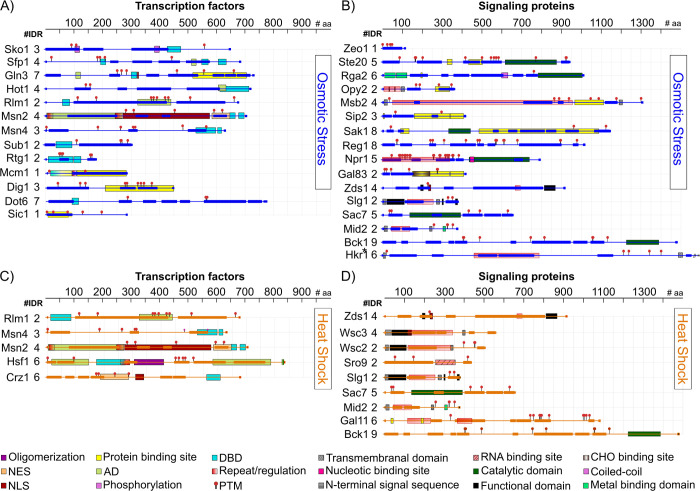
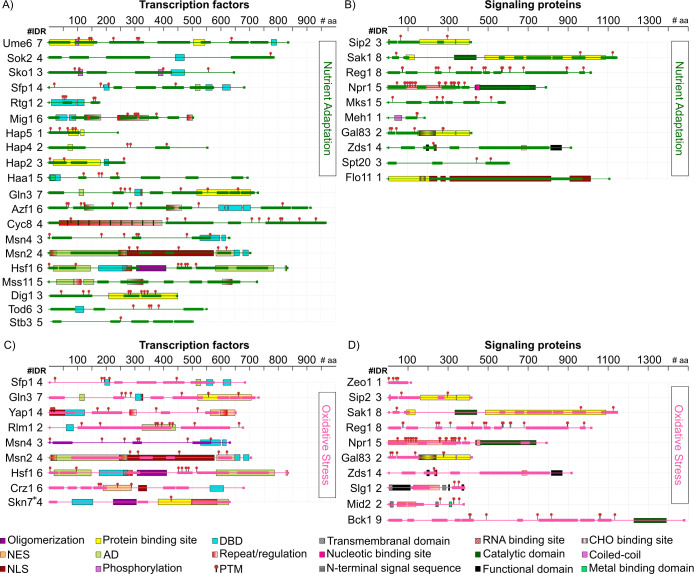
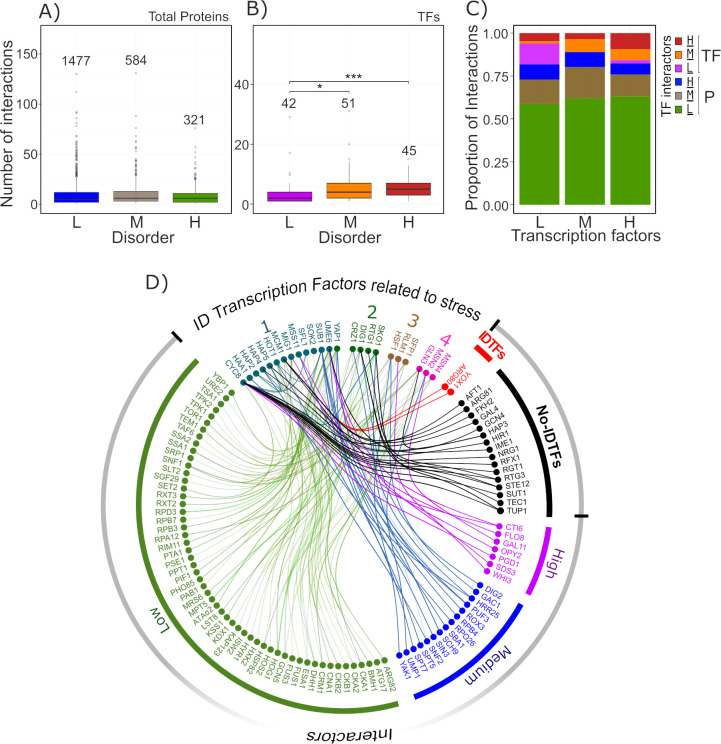
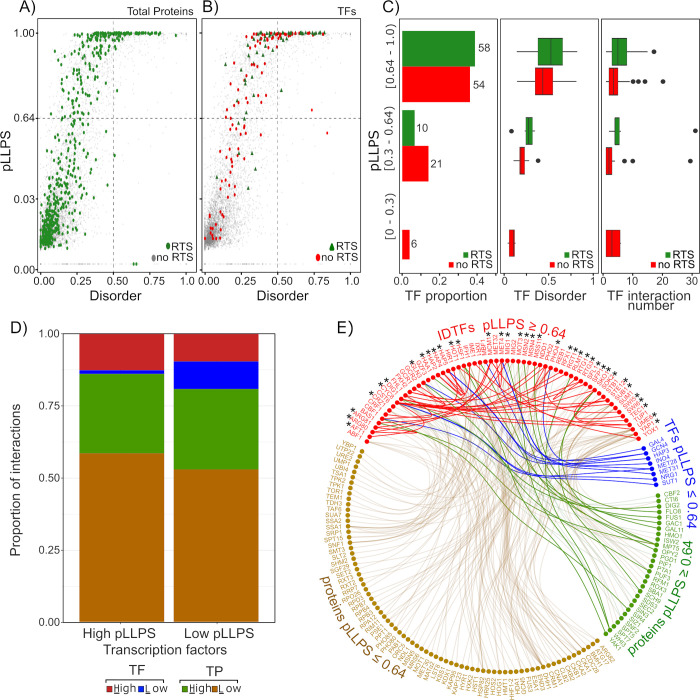
Cells have developed diverse mechanisms to monitor changes in their surroundings. This allows them to establish effective responses to cope with adverse environments. Some of these mechanisms have been well characterized in the budding yeast Saccharomyces cerevisiae, an excellent experimental model to explore and elucidate some of the strategies selected in eukaryotic organisms to adjust their growth and development in stressful conditions. The relevance of structural disorder in proteins and the impact on their functions has been uncovered for proteins participating in different processes. This is the case of some transcription factors (TFs) and other signaling hub proteins, where intrinsically disordered regions (IDRs) play a critical role in their function. In this work, we present a comprehensive bioinformatic analysis to evaluate the significance of structural disorder in those TFs (170) recognized in S. cerevisiae. Our findings show that 85.2% of these TFs contain at least one IDR, whereas ~30% exhibit a higher disorder level and thus were considered as intrinsically disordered proteins (IDPs). We also found that TFs contain a higher number of IDRs compared to the rest of the yeast proteins, and that intrinsically disordered TFs (IDTFs) have a higher number of protein-protein interactions than those with low structural disorder. The analysis of different stress response pathways showed a high content of structural disorder not only in TFs but also in other signaling proteins. The propensity of yeast proteome to undergo a liquid-liquid phase separation (LLPS) was also analyzed, showing that a significant proportion of IDTFs may undergo this phenomenon. Our analysis is a starting point for future research on the importance of structural disorder in yeast stress responses.


Conflict of interest statement

The authors have declared that no competing interests exist.

Figures

Fig 1
Fig 1. Structural disorder in S. cerevisiae proteins.
Proteins with a disorder ratio ≥ 0.5 according to MobiDB were considered as intrinsically disordered proteins (IDPs). (A) Frequency of structural disorder in yeast proteins according to MobiDB disorder ratio. (B) Gene ontology (GO) analysis of S. cerevisiae IDPs represented as Treemap. The size of each box represents the dimension of the corrected p-value from the GO enrichment analysis. Each colored “supercluster” corresponds to common biological functions (represented with a number, S2 Table), named with the GO that showed the lower p-value. A full description of each GO can be found in S2 Table. (C) Cellular distribution of IDPs in yeast using YEAST GFP fusion localization database. “Unique” indicates the proteins that can only found in one compartment, meanwhile “Diverse” indicates that those proteins can be found in more than one compartment.
Fig 2
Fig 2. Intrinsically disordered regions (IDRs) in S. cerevisiae proteome.
Number of IDRs identified in TFs (A) and total proteins (B) according to MobiDB disorder ratio. LD, MD and HD correspond to low D_ratio (0.1–0.29), medium D_ratio (0.3–0.49), and higher disorder (D_ratio ≥ 0.5), respectively. Ordered TFs or proteins were not included. Asterisks denote differences evaluated with the Wilcoxon test *** p-value ≤ 0.001 and **** p-value ≤ 0.0001).
Fig 3
Fig 3. Stress signaling pathways in S. cerevisiae.
Intrinsically disordered transcription factors (IDTFs) (boxes) and other signaling IDPs (ovals) identified with MobiDB are highlighted in violet. The nutrient adaptation, osmotic stress, oxidative stress and heat shock signaling pathways are marked with lines and arrows in green, blue, pink and orange, respectively. Signaling proteins showing lower structural disorder but filtered through VSL2 were also included in this figure (orange boxes and ovals). Stress response signaling pathways were modified from Kawakami et al. (2016).
Fig 4
Fig 4. IDRs and functional domains in IDTFs and in signaling proteins involved in osmotic and heat shock response signaling pathways.
(A and B) osmotic stress and (C and D) heat shock. The functional domains shown in this figure are those supported by experimental evidence. NES: Nuclear Export Sequence; NLS: Nuclear Localization Sequence; TAD: Transcription Activation Domain; DBD: DNA Binding Domain; PTM: Post-Translational Modification; CHO: Carbohydrate Binding Site. IDRs are showed as bars in osmotic stress (blue) and heat shock (orange). The rulers above each protein representation schemes indicate the number of amino acid residues.
Fig 5
Fig 5. IDRs and functional domains in IDTFs and in signaling proteins involved in nutrient adaptation and oxidative stress response signaling pathways.
(A and B) nutrient adaptation and (C and D) oxidative stress. The functional domains shown in this figure are those supported by experimental evidence. NES: Nuclear Export Sequence; NLS: Nuclear Localization Sequence; TAD: Transcription Activation Domain; DBD: DNA Binding Domain; PTM: Post-Translational Modification; CHO: Carbohydrate Binding Site. IDRs are showed as bars in nutrient adaptation (green) and oxidative stress (pink). The rulers above each protein representation schemes indicate the number of amino acid residues.
Fig 6
Fig 6. Protein-protein interaction network of S. cerevisiae IDTFs related to stress responses.
(A) Number of interactions for total yeast proteins grouped in three disorder ratio ranges according to MobiDB: low (L) (0.1–0.29, blue box), medium (M) (0.3–0.49, brown box) and high (H) (D_ratio ≥ 0.5, green box). (B) Number of interactions for TFs grouped as described for (A): L (violet box), M (orange box) and H (red box). Asterisks denote differences evaluated with the Wilcoxon test * p-value ≤ 0.05 and *** p-value ≤ 0.001). The number of interactions was obtained from the node degree analysis. The outliers above 150 for (A) and 50 for (B) were not included to improve graph resolution; however, all data was used for the statistical analyses. (C) Proportion of interactions for TFs grouped according to their D_ratio range as described above. Each colour identifies the type of TF interaction: interactions between TFs (in violet, orange and red blocks) or between TFs and non-TFs proteins (in green, brown and blue blocks) classified by their disorder (Low, Medium and High, respectively). (D) Interaction network for IDTFs involved in yeast stress responses based on the protein-protein interaction analysis. The numbers above IDTF names represent the number of pathways where they participate (from 1 to 4). The connector line colours refer to the disorder level of the corresponding interactor. The external circle demarcates the different interactors, TFs were classified in IDTF (red lines) and non-IDTF (black lines), while proteins were categorized by their D_ratio (H, violet lines; M, blue lines; L, green lines).
Fig 7
Fig 7. Liquid-Liquid Phase Separation (LLPS) propensity of yeast TFs.
LLPS probability index (pLLPS) was determined using FuzPred, and disorder probability index was obtained using MobiDB. (A) Relation between pLLPS index and disorder ratio of the complete yeast proteome (light grey circles). Green circles represent proteins related to stress responses (RTS). Vertical and horizontal discontinue gray lines represent the cutoff values for disorder ratio (≥ 0.5) and for pLLPs (≥ 0.64), respectively. (B) Relation between pLLPS index and disorder ratio for TFs. Red circles and green triangles represent TFs no related to stress (no RTS) and RTS, respectively. (C) Distribution of TFs considering their pLLPS index, and its relation to their disorder ratio, number of interactions and participation in stress responses. (D) Interaction proportion for TFs according to their pLLPS index. Interaction proportions between TFs with high (≥ 0.64) and with low pLLPS (≤ 0.64) are represented in red and blue blocks, respectively, whereas proportions between TFs and proteins (TP) with high pLLPS (≥ 0.64) and low pLLPS (≤ 0.64) are represented with green and brown blocks, respectively. (E) Interaction network for IDTFs with pLLPS ≥ 0.64 (in red) with: TFs showing pLLPS ≤ 0.64 (in blue), proteins with pLLPS ≤ 0.64 (in brown) and proteins with pLLPS ≥ 0.64 (in green). IDTFs related to stress are indicated with an asterisk. The connector lines colour corresponds to the pLLPS index of the corresponding interactor.

Similar articles

Cited by

References

    1. Causton HC, Ren B, Koh SS, Harbison CT, Kanin E, Jennings EG, et al.. Remodeling of Yeast Genome Expression in Response to Environmental Changes. Silver PA, editor. Mol Biol Cell. 2001;12: 323–337. doi: 10.1091/mbc.12.2.323 - DOI - PMC - PubMed
    1. Chasman D, Ho Y, Berry DB, Nemec CM, MacGilvray ME, Hose J, et al.. Pathway connectivity and signaling coordination in the yeast stress‐activated signaling network. Mol Syst Biol. 2014;10: 759. doi: 10.15252/msb.20145120 - DOI - PMC - PubMed
    1. Gasch AP, Spellman PT, Kao CM, Carmel-Harel O, Eisen MB, Storz G, et al.. Genomic Expression Programs in the Response of Yeast Cells to Environmental Changes. Mol Biol Cell. 2000;11: 17. doi: 10.1091/mbc.11.12.4241 - DOI - PMC - PubMed
    1. Dawes IW, Perrone GG. Stress and ageing in yeast. FEMS Yeast Res. 2020;20: foz085. doi: 10.1093/femsyr/foz085 - DOI - PubMed
    1. Vihervaara A, Duarte FM, Lis JT. Molecular mechanisms driving transcriptional stress responses. Nat Rev Genet. 2018;19: 385–397. doi: 10.1038/s41576-018-0001-6 - DOI - PMC - PubMed

Publication types

MeSH terms

Substances

LinkOut - more resources