. 2022 Mar 15;149(6):dev200159.
doi: 10.1242/dev.200159. Epub 2022 Mar 16.

Engrailed, Suppressor of fused and Roadkill modulate the Drosophila GLI transcription factor Cubitus interruptus at multiple levels

Affiliations

Engrailed, Suppressor of fused and Roadkill modulate the Drosophila GLI transcription factor Cubitus interruptus at multiple levels

Nicole Roberto et al. Development. .

Abstract

Morphogen gradients need to be robust, but may also need to be tailored for specific tissues. Often this type of regulation is carried out by negative regulators and negative feedback loops. In the Hedgehog (Hh) pathway, activation of patched (ptc) in response to Hh is part of a negative feedback loop limiting the range of the Hh morphogen. Here, we show that in the Drosophila wing imaginal disc two other known Hh targets genes feed back to modulate Hh signaling. First, anterior expression of the transcriptional repressor Engrailed modifies the Hh gradient by attenuating the expression of the Hh pathway transcription factor cubitus interruptus (ci), leading to lower levels of ptc expression. Second, the E-3 ligase Roadkill shifts the competition between the full-length activator and truncated repressor forms of Ci by preferentially targeting full-length Ci for degradation. Finally, we provide evidence that Suppressor of fused, a negative regulator of Hh signaling, has an unexpected positive role, specifically protecting full-length Ci but not the Ci repressor from Roadkill.

Keywords: Drosophila; Hedgehog; Pathway modulation; Signal transduction.


Conflict of interest statement

Competing interests The authors declare no competing or financial interests.

Figures

Fig. 1.
Fig. 1.
The effects of manipulating the expression of en, rdx, ci and Su(fu) on Drosophila wing morphogenesis. (A) Wild-type wing. (B) In control ptc-GAL4 (ptc559.1)/+ flies, wing patterning is relatively normal, with a slight expansion in the domain between longitudinal vein (LV) 3 and LV4. (C) In flies in which the expression of en and inv has been knocked down specifically in the anterior compartment adjacent to the A/P compartment boundary [w; ptc-GAL4 (ptc559.1)/UAS-RNAi-inv(KK101934); UAS-RNAi-en(v35697)/+] the domain between LV3 and LV4 has been substantially reduced, decreasing from 0.226 mm2±0.007 mm2 (mean±s.d.) in ptc-GAL4/+ (n=10) to 0.151 mm2±0.009 mm2 in [w; ptc-GAL4 (ptc559.1)/UAS-RNAi-inv (KK101934); UAS-RNAi-en (v35697)/+]; n=10, P=3.6E-20 (unpaired two-tailed Student's t-test). (D) Downregulation of rdx immediately anterior to the A/P compartment boundary of the wing pouch [w; ptc-GAL4 (ptc559.1)/UAS-RNAi-rdx(v28798)] does not alter the distance between LV3 and LV4. (E) ciCe2/+ wing. (F) Overexpression of rdx throughout the wing pouch in a ciCe2/+ background (w MS1096-GAL4/+; UAS-rdx-myc /+; ciCe2/+) results in a fusion of LV3 and LV4. (G) In Su(fu)LP/+; ciCe2/+ wings the distance between LV3 and LV4 is reduced. (H) In Su(fu)LP; ciCe2/+ LV3 and LV4 are fused. The phenotypes were very consistent in all the flies of each genotype, with at least eight wings for each genotype mounted for microscopy. Male wings were used for the analysis with the exception of panel F. Anterior to the left. Scale bar: 100 μm.
Fig. 2.
Fig. 2.
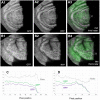
Attenuation of en and inv expression in the anterior compartment narrows the stripes of Bs and dpp expression between LV3 and LV4. (A-D) Wing discs were double-labeled with anti-Bs to visualize cells destined to make the wing intervein region and anti-β-Galactosidase (anti-β-Gal) to visualize the domain of dpp expression, using a dpp-lacZ reporter. (A) yw; dpp10638 (lacZ) ptc-GAL4 (ptc559.1)/+ wing disc; n=20. A1 shows anti-Bs; A2 shows anti-β-Gal (dpp-lacZ); A3 shows a merged image (anti-Bs, green; anti-β-Gal, magenta). White box marks location for readings in graph C. (B) yw; dpp10638 (lacZ) ptc-GAL4 (ptc559.1)/UAS-RNAi-inv(KK101934); UAS-RNAi-en(v35697)/+ disc in which the domains of dpp expression and intervein cells between LV3 and LV4 are more narrow; n=21. B1 shows anti-Bs; B2 shows anti-β-Gal (dpp-lacZ); B3 shows a merged image (anti-Bs, green; anti-β-Gal, magenta). White box marks location for readings in graph D. The graphs in C and D, respectively, show the intensity of antibody staining to Bs (green line) and β-Gal (red line) across the control and en+inv knockdown wing discs. Note that in D the expression of dpp-lacZ is higher directly adjacent to the compartment boundary, and that the expression domain of dpp-lacZ is narrower, as is the spacing between the primordia for LV3 and LV4 (asterisks). Here, and in subsequent wing disc images, anterior is to the left and dorsal is up. Scale bar: 10 μm.
Fig. 3.
Fig. 3.
Anterior clones mutant for en and inv show elevated expression of ptc and ci. (A) Wing imaginal discs of yw hs-FLP/+ or Y; FRT42B enE/FRT42B ubi-GFP; ptc-lacZ/+. A1 shows clones mutant for enE marked by the loss of GFP. A2 shows expression of ptc assayed by ptc-lacZ. A3 shows antibody staining to Ci. A4 shows a merged image of A1-A3 (GFP, green; β-Gal, red; Ci, blue); n=20. The bars labeled B1, B2 and B3 correspond to the three graphs below the figure. (B) Clones along the compartment boundary [marked by low levels of GFP (green line in bars B1 and B3)] have elevated levels of ptc-lacZ (red line) and Ci (blue line). (C) yw hs-FLP/+ or Y; FRT42B enE/FRT42B ubi-GFP; ciDplac/+. C1 shows clones mutant for enE marked by the loss of GFP. C2 shows expression of ci assayed by ciDplac. C3 shows antibody staining to Ci. C4 shows a merged image of C1-C3 (GFP, green; β-Gal, red; Ci, blue). The bars labeled D1 and D2 correspond to the two graphs below the figure. (D) Clones along the compartment boundary [marked by low levels of GFP (green line in bar D1)] have elevated levels of ci-lacZ (red line) and Ci (blue line); n=29. Scale bar: 10 μm.
Fig. 4.
Fig. 4.
ci expression is downregulated near the A/P compartment boundary in late-third instar larvae. (A) In mid-third instar larvae, ci-GAL4 drives uniform expression of destabilized GFP and RFP from UAS-TT (yw; ci-GAL4/UAS-TT); n=7. A1 shows destabilized GFP. A2 shows RFP. A3 shows a merged image (GFP, green; RFP, magenta). (B) In late-third instar yw; ci-GAL4/UAS-TT larvae, the levels of destabilized GFP are lower along the compartment boundary relative to RFP; n=20. B1 shows destabilized GFP. B2 shows RFP. B3 shows a merged image (GFP, green; RFP, magenta). (C) Bar function of ImageJ used to graph the distribution of GFP, RFP and their ratio from panels in A. The y-axis is the ratio of GFP/RFP and fluorescence intensities in arbitrary units. (D) Bar function of ImageJ used to graph the distribution of GFP, RFP and their ratio from panels in B. The y-axis is the ratio of GFP/RFP and fluorescence intensities in arbitrary units. Scale bar: 10 μm.
Fig. 5.
Fig. 5.
Loss of Su(fu) decreases in the expression of ptc and dpp in a ciCe2/+ background and is dependent on rdx. (A) Clones mutant for Su(fu) in a ciCe2/+ background show a dramatic decrease in ptc expression [yw hs-FLP/+ or Y; ptc-lacZ/+; FRT82B Su(fu)LP/FRT82B ubi-GFP; ciCe2/+]; anterior to the left. A clone along the compartment boundary is outlined in panels A1-A3. A1 shows Su(fu) mutant clones marked by the loss of GFP. A2 shows expression of ptc-lacZ. Note the significantly higher levels of ptc expression in the heterozygous Su(fu)LP territory adjacent to the compartment boundary (see B1). A3 shows antibody staining of Ci. A4 shows a merged image of A1-A3 (GFP, green; β-Gal, red; Ci, blue); n=5. The bars labeled B1 and B2 correspond to the two graphs below the figure. (B) Adjacent to the compartment boundary anterior cells heterozygous for Su(fu) have high levels of ptc expression (GFP, green line; ptc-lacZ, red line; Ci, blue line) (B1). A clone along the compartment boundary [marked by low levels of GFP (green line in bar B2)] has low levels of ptc-lacZ (red line) (Ci, blue line). (C) Clones mutant for Su(fu) in a ciCe2/+ background show a dramatic decrease in dpp expression [yw hs-FLP/+ or Y; dpp10638 (lacZ)/+; FRT82B Su(fu)LP/FRT82B ubi-GFP; ciCe2/+]; anterior to the left. A clone within the domain of dpp expression is outlined. C1 shows Su(fu) mutant clones marked by the loss of GFP. C2 shows expression of dpp-lacZ. C3 shows antibody staining of Ci. C4 shows a merged image of C1-C3 (GFP, green; β-Gal, red; Ci, blue); n=10. The bar labeled D1 correspond to the graph below the figure. (D1) A clone [marked by low levels of GFP (green line)] has decreased levels of dpp-lacZ (red line) (Ci, blue line). (E) Clones double mutant for Su(fu) and rdx in a ciCe2/+ background do not have a profound effect on the expression of dpp [yw hs-FLP/+ or Y; dpp10638 (lacZ)/+; FRT82B Su(fu)LP rdx5/FRT82B M(3)w ubi-GFP; ciCe2/+]. E1 shows Su(fu) rdx double mutant clones are marked by the loss of GFP. E2 shows that expression of dpp-lacZ is not significantly reduced in the clones. E3 shows antibody staining to Ci. E4 shows a merged image (GFP, green; β-Gal, red; Ci, blue); n=8. In order to recover Su(fu)LP rdx5 mutant clones, it was necessary to use the Minute technique. Eggs were collected for 24 h, aged 6 days then heat shocked at 35°C for 1 h. Scale bar: 10 μm.
Fig. 6.
Fig. 6.
Rdx facilitates the downregulation of ptc expression in cells away from the compartment boundary. (A) In yw; ptc-GAL4(ptc559.1)/+; UAS-TT/+ animals, the levels of destabilized GFP are reduced relative to that of RFP in ptc-expressing cells away from the compartment boundary; n=15. A1 shows GFP fluorescence. A2 shows RFP fluorescence. A3 shows a merged image (RFP, magenta; GFP, green). (B) In yw; ptc-GAL4(ptc559.1)/+; UAS-TT, UAS-RNAi-rdx(v28798)/+ animals the level of destabilized GFP is not reduced relative to RFP in ptc-expressing cells away from the boundary; n=13. B1 shows GFP fluorescence. B2 shows RFP fluorescence. B3 shows a merged image (RFP, magenta; GFP, green). The bars labeled C-F in A and B correspond to the graphs below the figure. (C) Bar function of ImageJ used to graph the distribution of GFP (green line) and RFP (red line) from panels in A. (D) Bar function of ImageJ used to graph the distribution of GFP and RFP from panels in B. (E) Boxed cell away from the compartment boundary in panel A has reduced levels of destabilized GFP relative to RFP. (F) Boxed cell adjacent to the compartment boundary in panel A has elevated levels of destabilized GFP relative to RFP. Scale bar: 10 μm.
Fig. 7.
Fig. 7.
Ci function is modulated by two feedback loops acting at different levels. Anterior expression of the En protein attenuates Ci activity directly adjacent to the compartment boundary of the wing disc by downregulating the expression of the ci gene. Rdx and Su(fu) act at the protein level modulating the competition between the full-length (Ci FL) and repressor forms (Ci R) of Ci. Rdx specifically targets full-length Ci, whereas Su(fu) partially protects full-length Ci from Rdx-mediated degradation. Rdx degradation of full-length Ci appears to help downregulate Hh target genes in cells no longer receiving the Hh signal.

Similar articles

Cited by

References

    1. Abouchar, L., Petkova, M. D., Steinhardt, C. R. and Gregor, T. (2014). Fly wing vein patterns have spatial reproducibility of a single cell. J. R Soc. Interface 11, 20140443. 10.1098/rsif.2014.0443 - DOI - PMC - PubMed
    1. Alves, G., Limbourg-Bouchon, B., Tricoire, H., Brissard-Zahraoui, J., Lamour-Isnard, C. and Busson, D. (1998). Modulation of Hedgehog target gene expression by the Fused serine-threonine kinase in wing imaginal discs. Mech. Dev. 78, 17-31. 10.1016/S0925-4773(98)00130-0 - DOI - PubMed
    1. Aza-Blanc, P., Ramírez-Weber, F.-A., Laget, M.-P., Schwartz, C. and Kornberg, T. B. (1997). Proteolysis that is inhibited by hedgehog targets Cubitus interruptus protein to the nucleus and converts it to a repressor. Cell 89, 1043-1053. 10.1016/S0092-8674(00)80292-5 - DOI - PubMed
    1. Biehs, B., Sturtevant, M. A. and Bier, E. (1998). Boundaries in the Drosophila wing imaginal disc organize vein-specific genetic programs. Development 125, 4245-4257. 10.1242/dev.125.21.4245 - DOI - PubMed
    1. Blair, S. S. (1992). Engrailed expression in the anterior lineage compartment of the developing wing blade of Drosophila’. Development 115, 21-33. 10.1242/dev.115.1.21 - DOI - PubMed

Publication types

MeSH terms

LinkOut - more resources