. 2022 Jun 24;73(12):3963-3977.
doi: 10.1093/jxb/erac107.

Genetic analysis of early phenology in lentil identifies distinct loci controlling component traits

Affiliations

Genetic analysis of early phenology in lentil identifies distinct loci controlling component traits

Vinodan Rajandran et al. J Exp Bot. .

Abstract

Modern-day domesticated lentil germplasm is generally considered to form three broad adaptation groups: Mediterranean, South Asian, and northern temperate, which correspond to the major global production environments. Reproductive phenology plays a key role in lentil adaptation to this diverse ecogeographic variation. Here, we dissect the characteristic earliness of the pilosae ecotype, suited to the typically short cropping season of South Asian environments. We identified two loci, DTF6a and DTF6b, at which dominant alleles confer early flowering, and we show that DTF6a alone is sufficient to confer early flowering under extremely short photoperiods. Genomic synteny confirmed the presence of a conserved cluster of three florigen (FT) gene orthologues among potential candidate genes, and expression analysis in near-isogenic material showed that the early allele is associated with a strong derepression of the FTa1 gene in particular. Sequence analysis revealed a 7.4 kb deletion in the FTa1-FTa2 intergenic region in the pilosae parent, and a wide survey of >350 accessions with diverse origin showed that the dtf6a allele is predominant in South Asian material. Collectively, these results contribute to understanding the molecular basis of global adaptation in lentil, and further emphasize the importance of this conserved genomic region for adaptation in temperate legumes generally.

Keywords: Adaptation; FT genes; QTL analysis; controlled environment; florigen; flowering time; legume; lentil; mapping; photoperiod.


Figures

Fig. 1.
Fig. 1.
Variation in flowering time and other aspects of reproductive development in response to photoperiod and vernalization. (A) Flowering time of lentil accessions under short- (SD) or long-day (LD) conditions, either with (+V) or without a vernalization treatment. (B) Relationship between flowering time in SDs and LDs. (C) Relationship between photoperiod response (difference in flowering time between SDs and LDs) and flowering time in SDs. Possibly distinct groupings are indicated in orange (early-flowering, low sensitivity), maroon (late-flowering, high sensitivity), and green (intermediate sensitivity). (D) Relationship between photoperiod response and vernalization response for DTF. Colours represent the same groupings as in (C). (E) Phasing of reproductive development. Coloured bars represent the node of flower initiation (NFI). Stacked bars in shades of grey represent the node of first developed flower (NFD), node of first pod (NFP), and the total number of nodes (TN) at maturity (terminal arrest). The wild L. orientalis accession ILWL 7 is indicated by open symbols in (A–C). All values represent the mean ±SE for n=4–6.
Fig. 2.
Fig. 2.
Frequency distributions for phenology and growth habit traits in an F2 population. Days to flower (A), days from sowing to seedling emergence (B), total branch length at 3 weeks post-emergence (C), and total plant height (D) were recorded in the F2 progeny of a cross between accessions ILL 2601 and ILL 5588. The ranges in parental values are indicated by horizontal bars.
Fig. 3.
Fig. 3.
Linkage map showing QTLs detected in the ILL 2601×ILL 5588 population. Scale is cM. QTL nomenclature follows Tables 1 and 2. Box and whiskers represent 1–LOD and 2–LOD intervals, respectively, around each QTL peak.
Fig. 4.
Fig. 4.
qDTF6a and qDTF6b peak marker effects under different photoperiods. (A) Interaction between DTF6a and DTF6b for flowering time in the ILL 2601×ILL 5588 F2 population under short-day conditions (12 h). (B) F4 NILs differing only at the DTF6a (middle panel) or DTF6b (bottom panel) locus grown under three different photoperiods: SDs (8 h), SDs (12 h), and LDs (16 h). Plants in the top panel carry ILL 5588 alleles at both loci. Orange triangles indicate the plants that have initiated flowering, with flowering time data shown on the right.
Fig. 5.
Fig. 5.
DTF6a is located over the conserved FTa–FTc cluster and affects its expression. (A) QTL peak for DTF6a. Lentil markers in the peak region were blasted against Medicago, chickpea, and pea to determine the matching genes from the syntenic regions. The FT cluster of FTa1, FTa2, and FTc is indicated in red. (B) Expression of lentil FT orthologues under a short-day (12 h) photoperiod for two pairs of NILs segregating at the single locus, DTF6a. Expression levels show the difference between the photoperiod-sensitive ILL 5588 allele (black) and the early-flowering ILL 2601 allele (grey). The most recent fully expanded leaves were harvested 3 weeks after emergence. Values have been normalized to the transcript level of Actin and represent the mean ±SE for n=3 biological replicates, each consisting of pooled material from two plants.
Fig. 6.
Fig. 6.
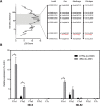
Characterization of the FTa1–FTa2 cluster in lentil accessions. (A) Schematic diagram of the FTa1–FTa2 cluster in ILL 5588 and ILL 2601. The green boxes represent the exons of the lentil FTa1 gene and the blue boxes represent the exons of FTa2. (B) The sequence position of the 7441 bp deletion in ILL 2601. (C) PCR of the intergenic region with a 45 s extension time (~1 kb) in ILL 5588 and ILL 2601. Primer positions are annotated in (A). An extended figure including the full gel results is available in Supplementary Fig. S9. (D) Phenotypic response of ILL 5588 and ILL 2601 to photoperiod and vernalization treatment. Blue and white bars represent vernalized and unvernalized plants, respectively. Background colour indicates photoperiod, with SDs (8 h) in grey and LDs (16 h) in yellow. NF indicates plants unable to flower at the end of the scoring period (123 d). Consequently, their flowering node is not present in the corresponding graph.

References

    1. Beales J, Turner A, Griffiths S, Snape JW, Laurie DA.. 2007. A pseudo-response regulator is misexpressed in the photoperiod insensitive Ppd-D1a mutant of wheat (Triticum aestivum L.). Theoretical and Applied Genetics 115, 721–733. - PubMed
    1. Churchill GA, Doerge RW.. 1994. Empirical threshold values for quantitative trait mapping. Genetics 138, 963–971. - PMC - PubMed
    1. Erskine W, Adham Y, Holly L.. 1989. Geographic distribution of variation in quantitative traits in a world lentil collection. Euphytica 43, 97–103.
    1. Erskine W, Chandra S, Chaudhry M, Malik IA, Sarker A, Sharma B.. 1998. A bottleneck in lentil: widening its genetic base in South Asia. Euphytica 101, 207–211
    1. Erskine W, Ellis RH, Summerfield RJ, Roberts EH, Hussain A.. 1990. Characterization of responses to temperature and photoperiod for time to flowering in a world lentil collection Theoretical and Applied Genetics 80, 193–199. - PubMed

Publication types