

Exploratory analysis of novel electronic health record variables for quantification of healthcare delivery strain, prediction of mortality, and prediction of imminent discharge
- PMID: 35290460
- PMCID: PMC9093028
- DOI: 10.1093/jamia/ocac037
Exploratory analysis of novel electronic health record variables for quantification of healthcare delivery strain, prediction of mortality, and prediction of imminent discharge
Abstract
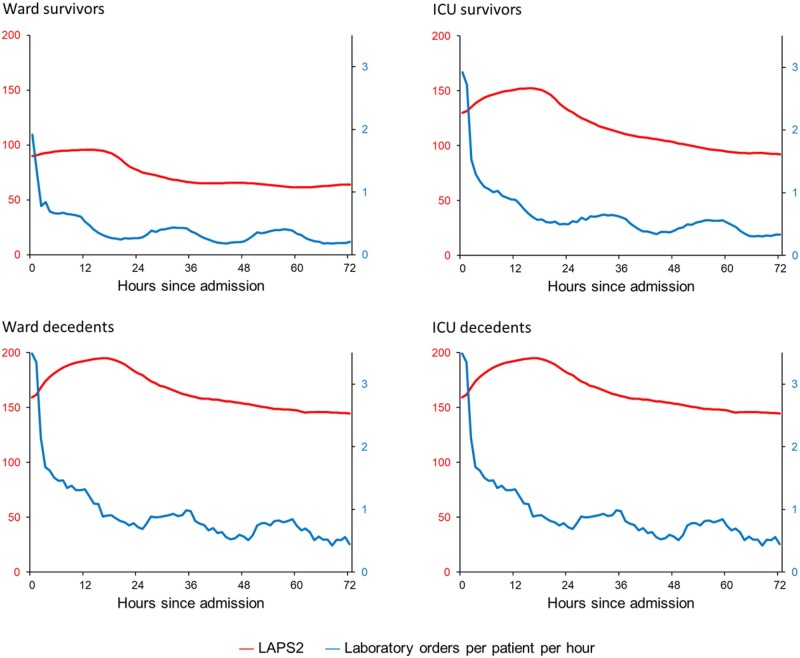
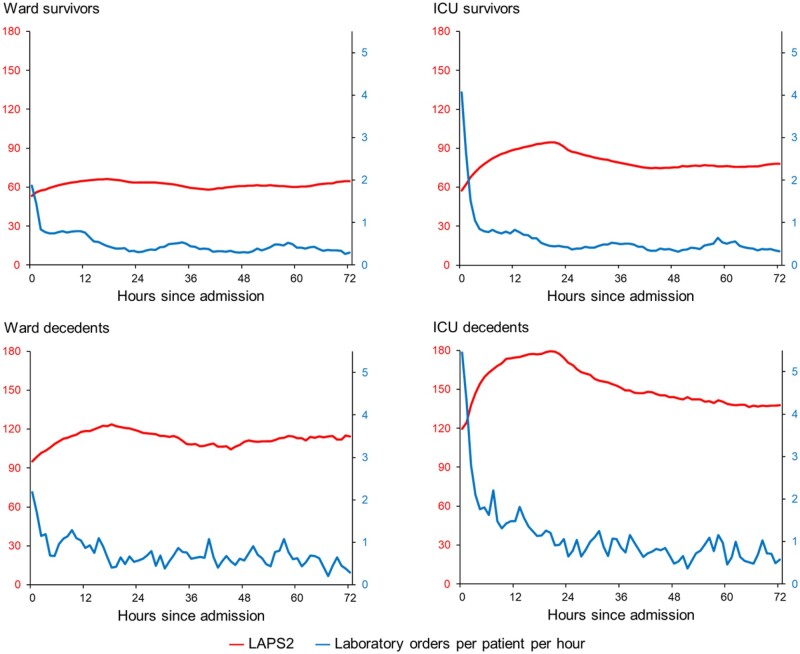
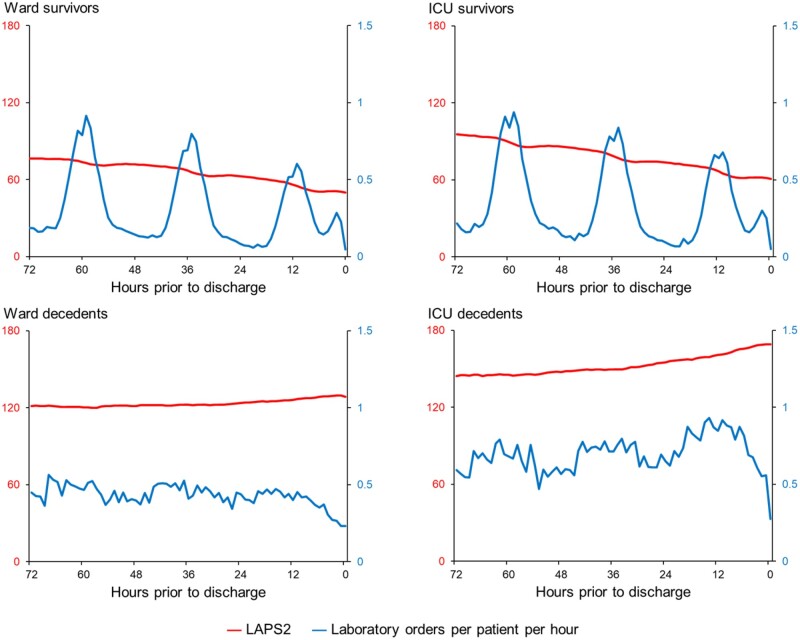
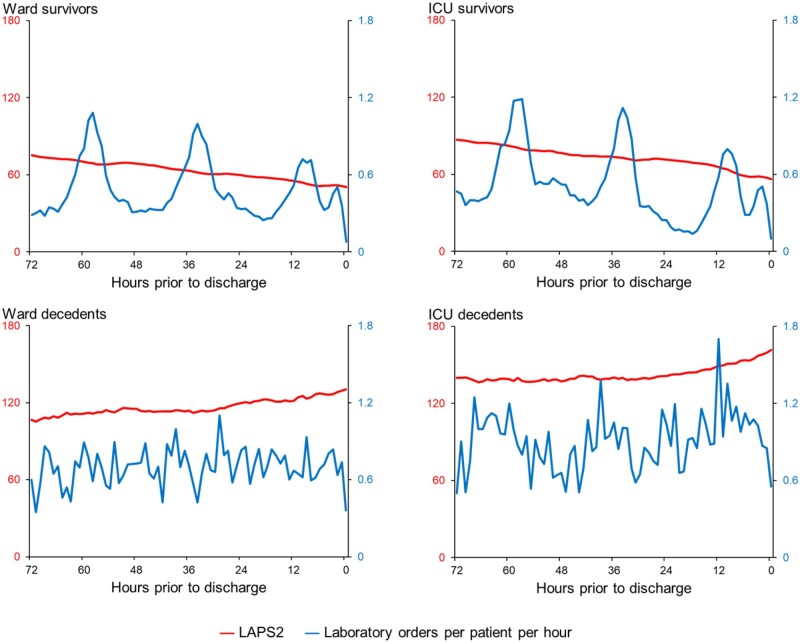
Objective: To explore the relationship between novel, time-varying predictors for healthcare delivery strain (eg, counts of patient orders per hour) and imminent discharge and in-hospital mortality.
Materials and methods: We conducted a retrospective cohort study using data from adults hospitalized at 21 Kaiser Permanente Northern California hospitals between November 1, 2015 and October 31, 2020 and the nurses caring for them. Patient data extracted included demographics, diagnoses, severity measures, occupancy metrics, and process of care metrics (eg, counts of intravenous drip orders per hour). We linked these data to individual registered nurse records and created multiple dynamic, time-varying predictors (eg, mean acute severity of illness for all patients cared for by a nurse during a given hour). All analyses were stratified by patients' initial hospital unit (ward, stepdown unit, or intensive care unit). We used discrete-time hazard regression to assess the association between each novel time-varying predictor and the outcomes of discharge and mortality, separately.
Results: Our dataset consisted of 84 162 161 hourly records from 954 477 hospitalizations. Many novel time-varying predictors had strong associations with the 2 study outcomes. However, most of the predictors did not merely track patients' severity of illness; instead, many of them only had weak correlations with severity, often with complex relationships over time.
Discussion: Increasing availability of process of care data from automated electronic health records will permit better quantification of healthcare delivery strain. This could result in enhanced prediction of adverse outcomes and service delays.
Conclusion: New conceptual models will be needed to use these new data elements.
Keywords: healthcare delivery strain; hospital occupancy; hospital strain; patient-nurse interactions; time-varying predictors.
© The Author(s) 2022. Published by Oxford University Press on behalf of the American Medical Informatics Association. All rights reserved. For permissions, please email: journals.permissions@oup.com.
Figures
Similar articles
-
Early detection of impending physiologic deterioration among patients who are not in intensive care: development of predictive models using data from an automated electronic medical record.J Hosp Med. 2012 May-Jun;7(5):388-95. doi: 10.1002/jhm.1929. Epub 2012 Mar 22. J Hosp Med. 2012. PMID: 22447632
-
Multiyear Rehospitalization Rates and Hospital Outcomes in an Integrated Health Care System.JAMA Netw Open. 2019 Dec 2;2(12):e1916769. doi: 10.1001/jamanetworkopen.2019.16769. JAMA Netw Open. 2019. PMID: 31800072 Free PMC article.
-
Development and validation of an electronic medical record-based alert score for detection of inpatient deterioration outside the ICU.J Biomed Inform. 2016 Dec;64:10-19. doi: 10.1016/j.jbi.2016.09.013. Epub 2016 Sep 20. J Biomed Inform. 2016. PMID: 27658885 Free PMC article.
-
Dynamic and explainable machine learning prediction of mortality in patients in the intensive care unit: a retrospective study of high-frequency data in electronic patient records.Lancet Digit Health. 2020 Apr;2(4):e179-e191. doi: 10.1016/S2589-7500(20)30018-2. Epub 2020 Mar 12. Lancet Digit Health. 2020. PMID: 33328078
-
Measuring integrated care.Dan Med Bull. 2011 Feb;58(2):B4245. Dan Med Bull. 2011. PMID: 21299927 Review.
Cited by
-
Comparative Analysis of Fusion Strategies for Imaging and Non-imaging Data - Use-case of Hospital Discharge Prediction.AMIA Jt Summits Transl Sci Proc. 2024 May 31;2024:652-661. eCollection 2024. AMIA Jt Summits Transl Sci Proc. 2024. PMID: 38827051 Free PMC article.
