. 2022 Apr 25;32(8):1861-1868.e7.
doi: 10.1016/j.cub.2022.02.059. Epub 2022 Mar 14.

Deconstructing gastrulation at single-cell resolution

Affiliations

Deconstructing gastrulation at single-cell resolution

Tomer Stern et al. Curr Biol. .

Abstract

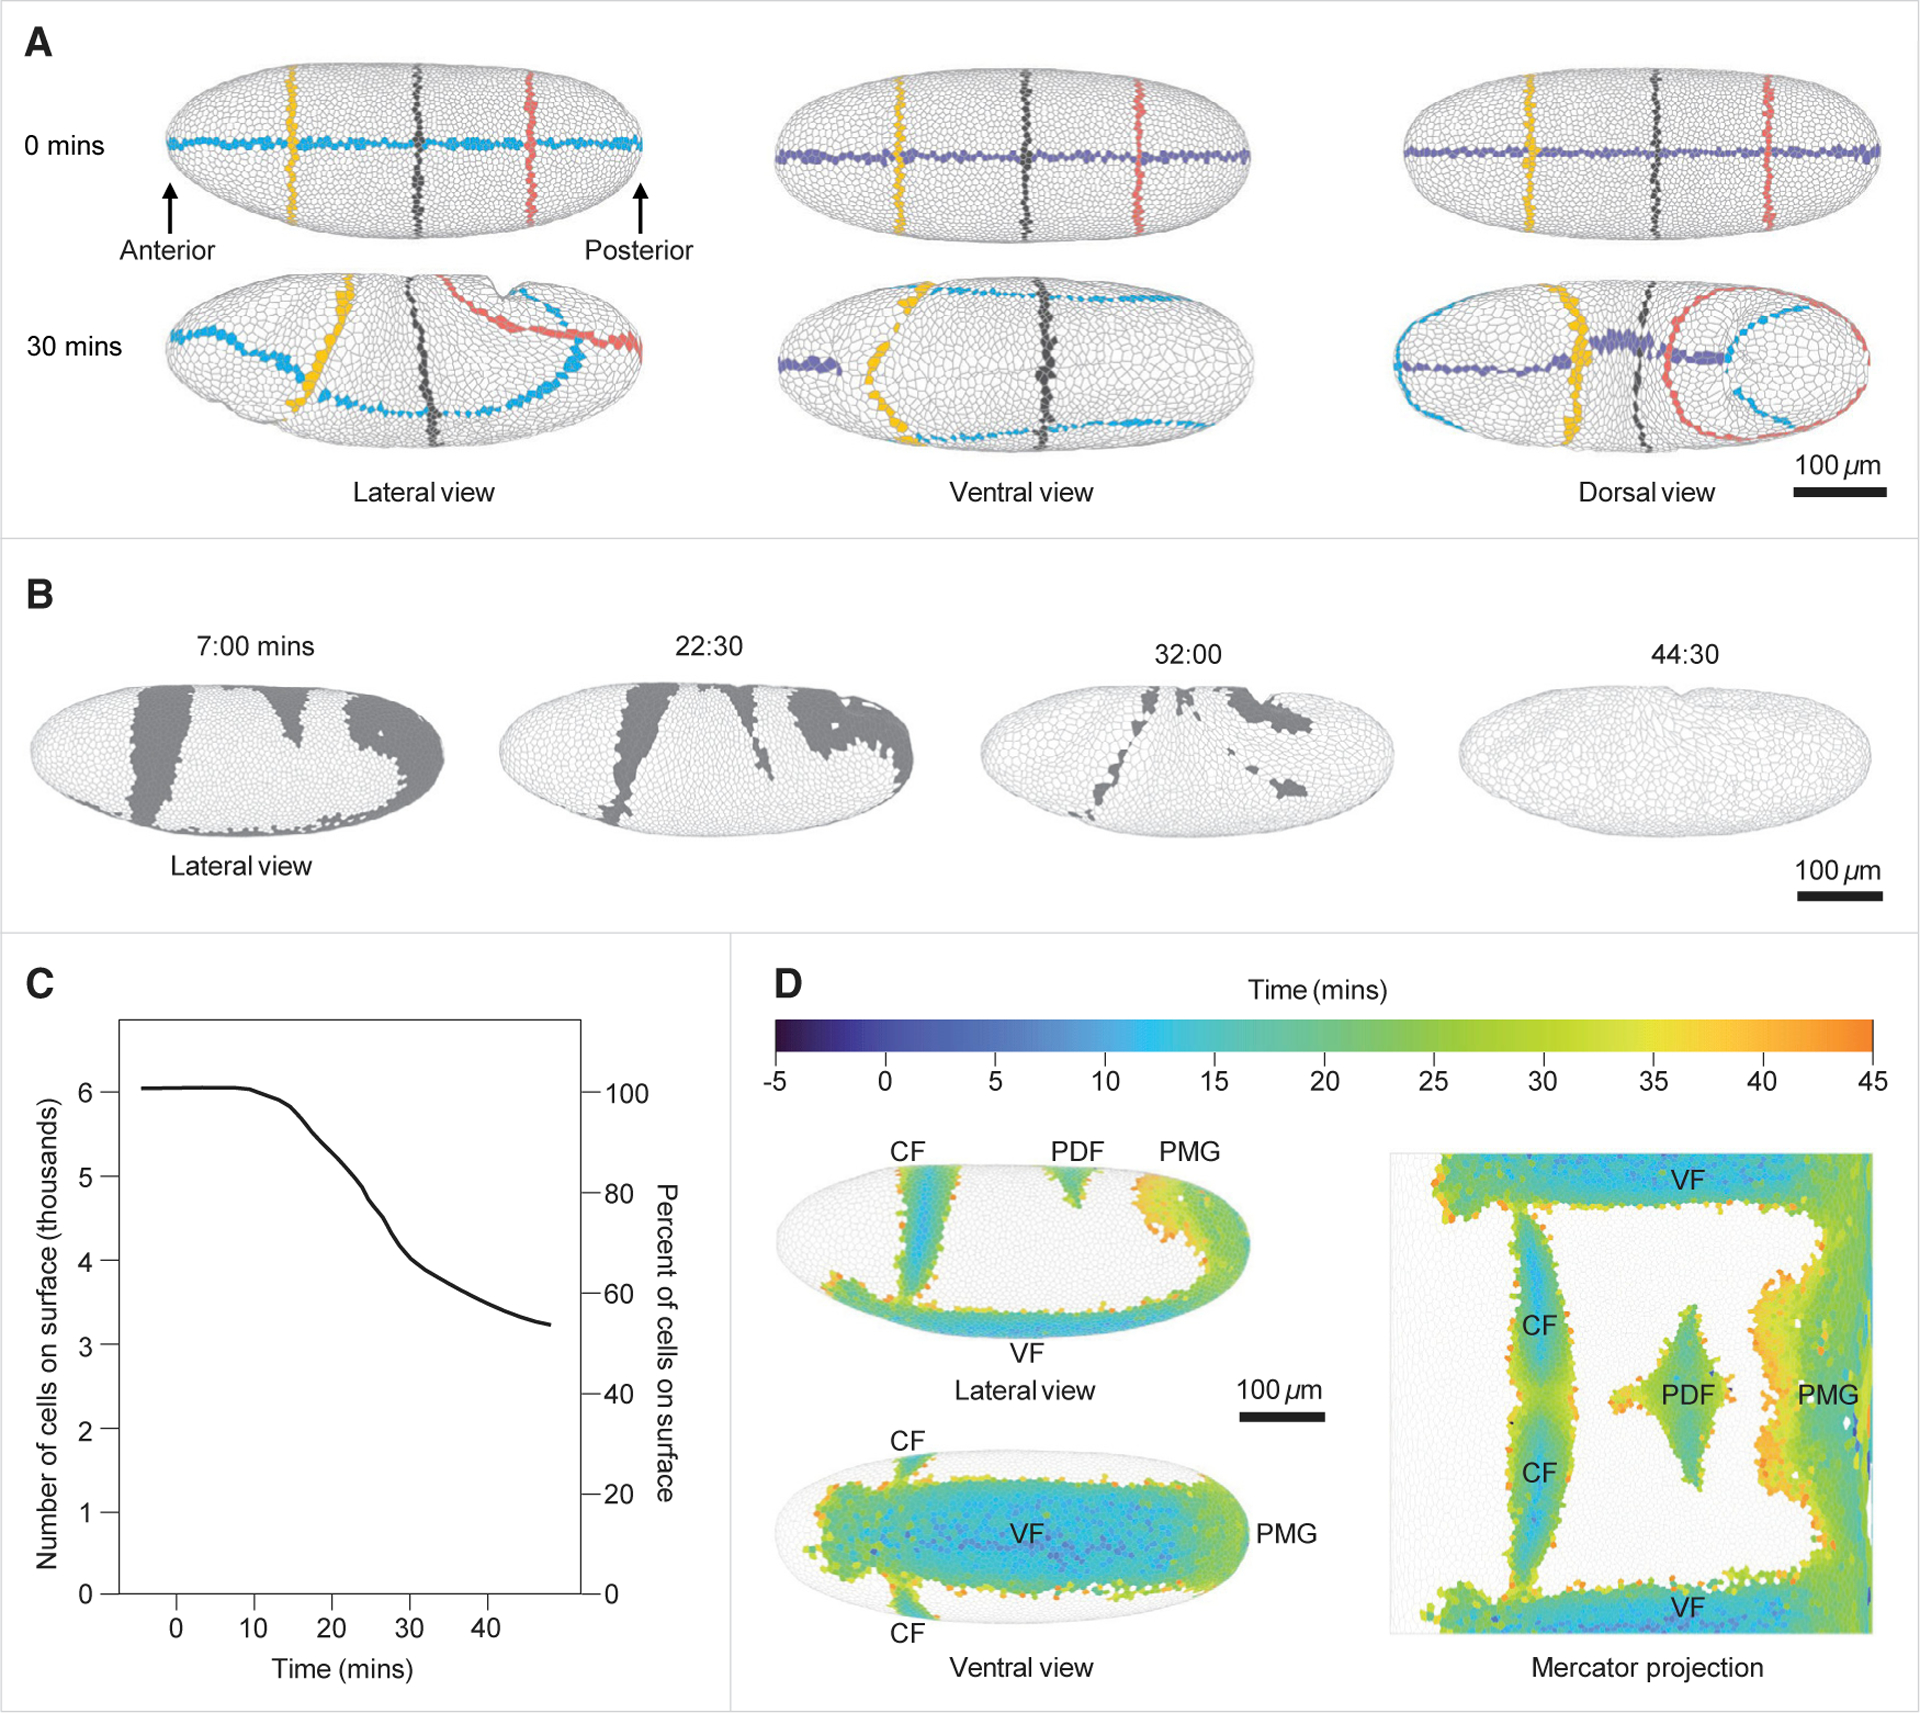
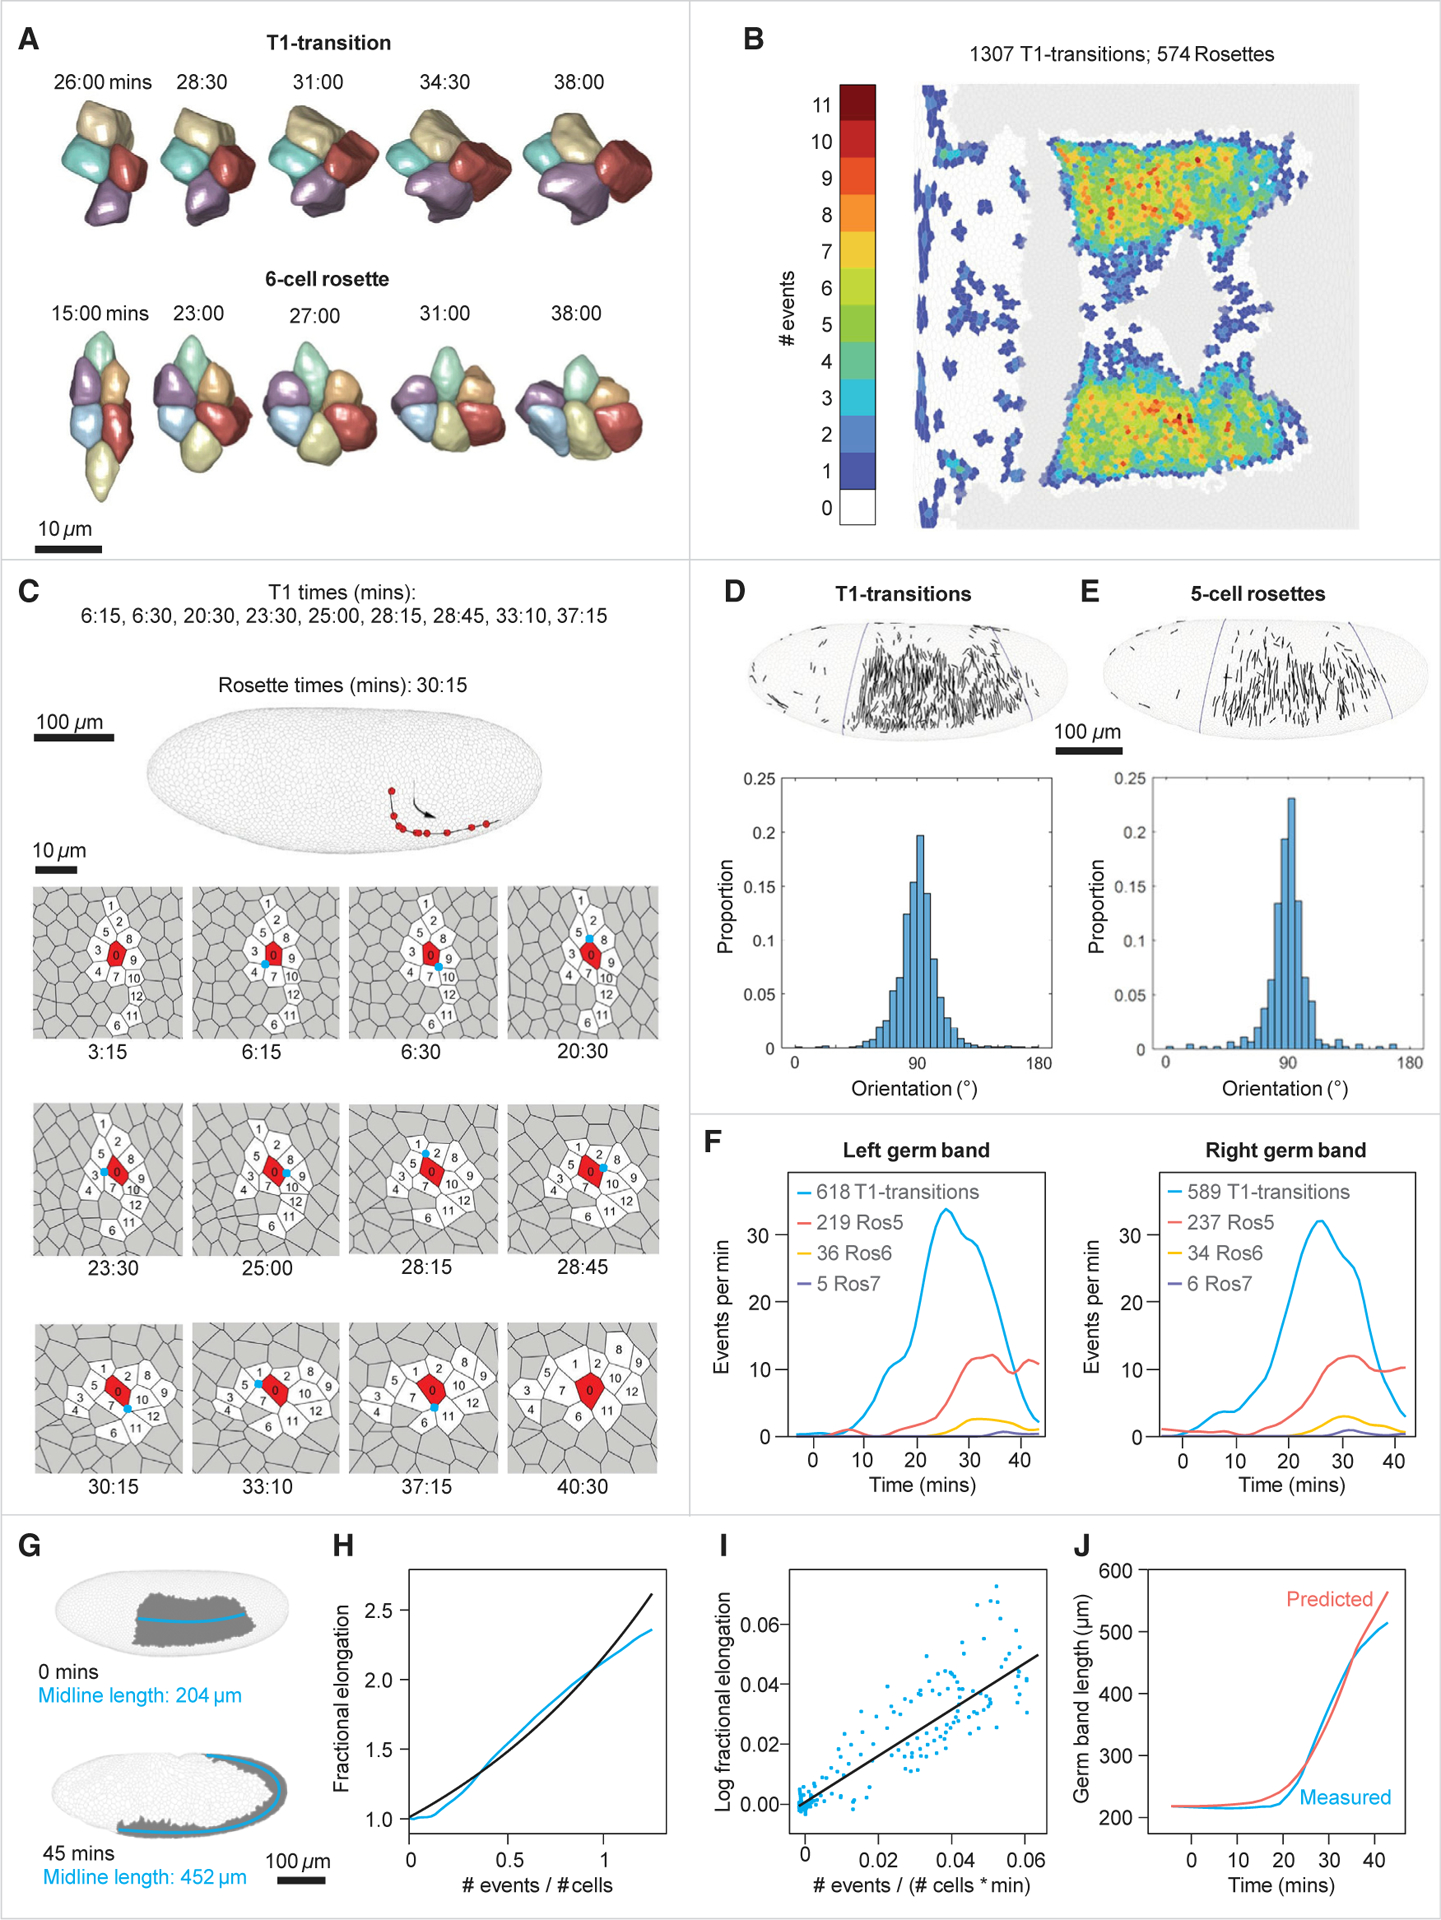
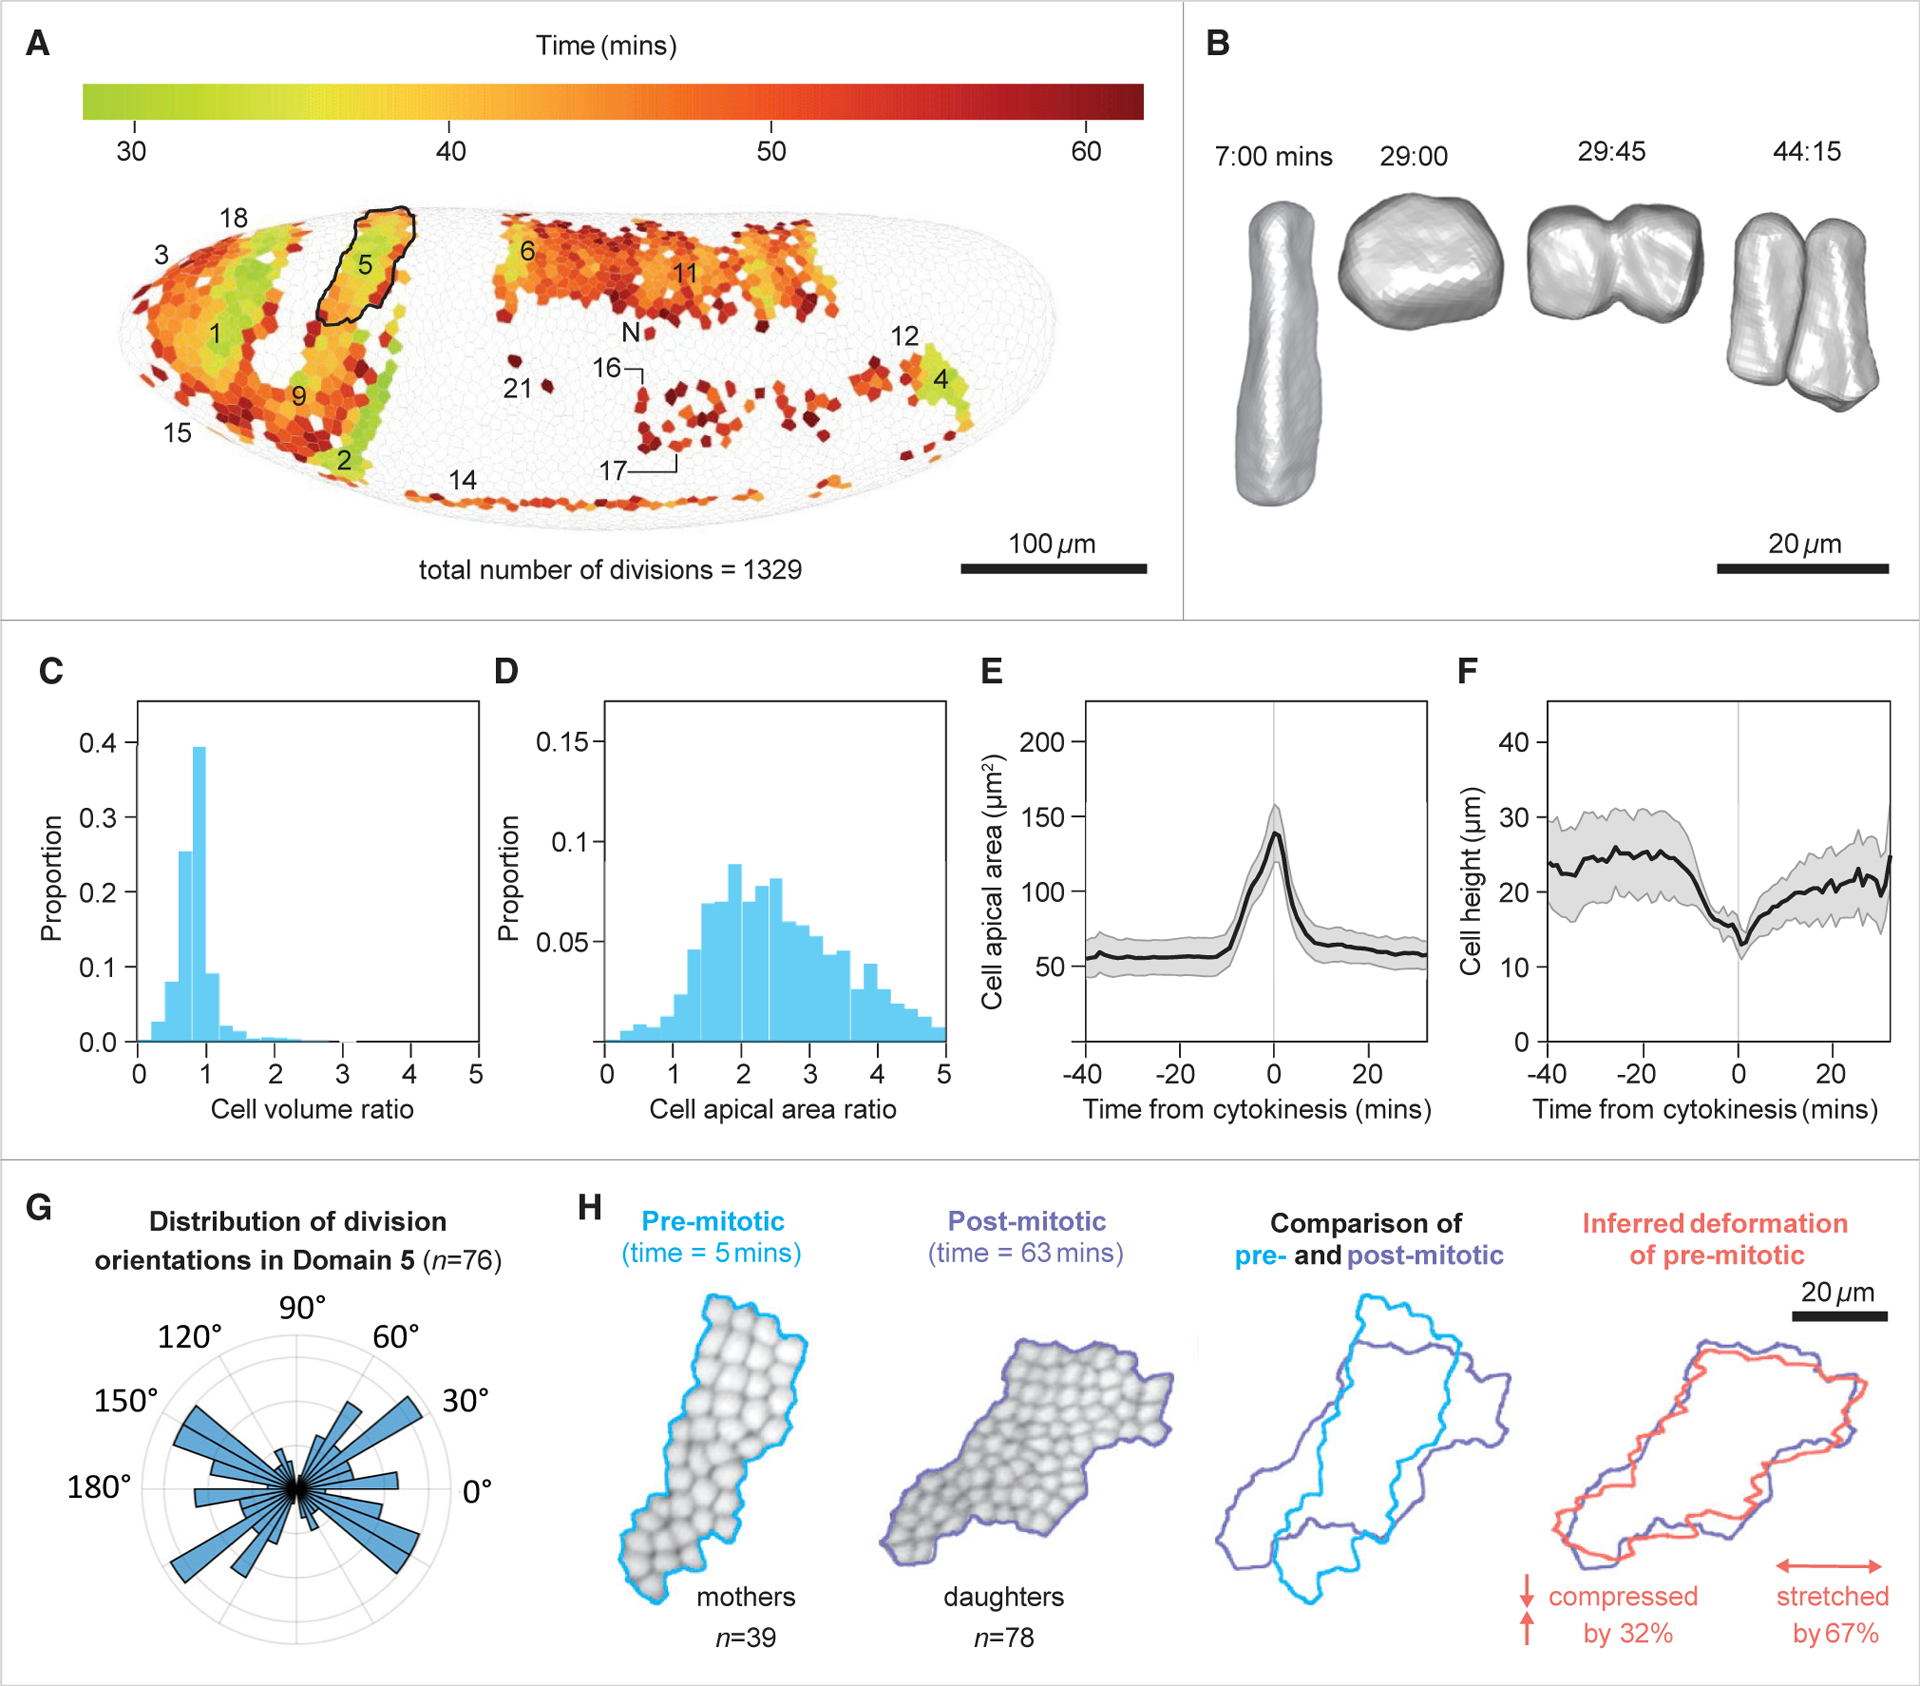
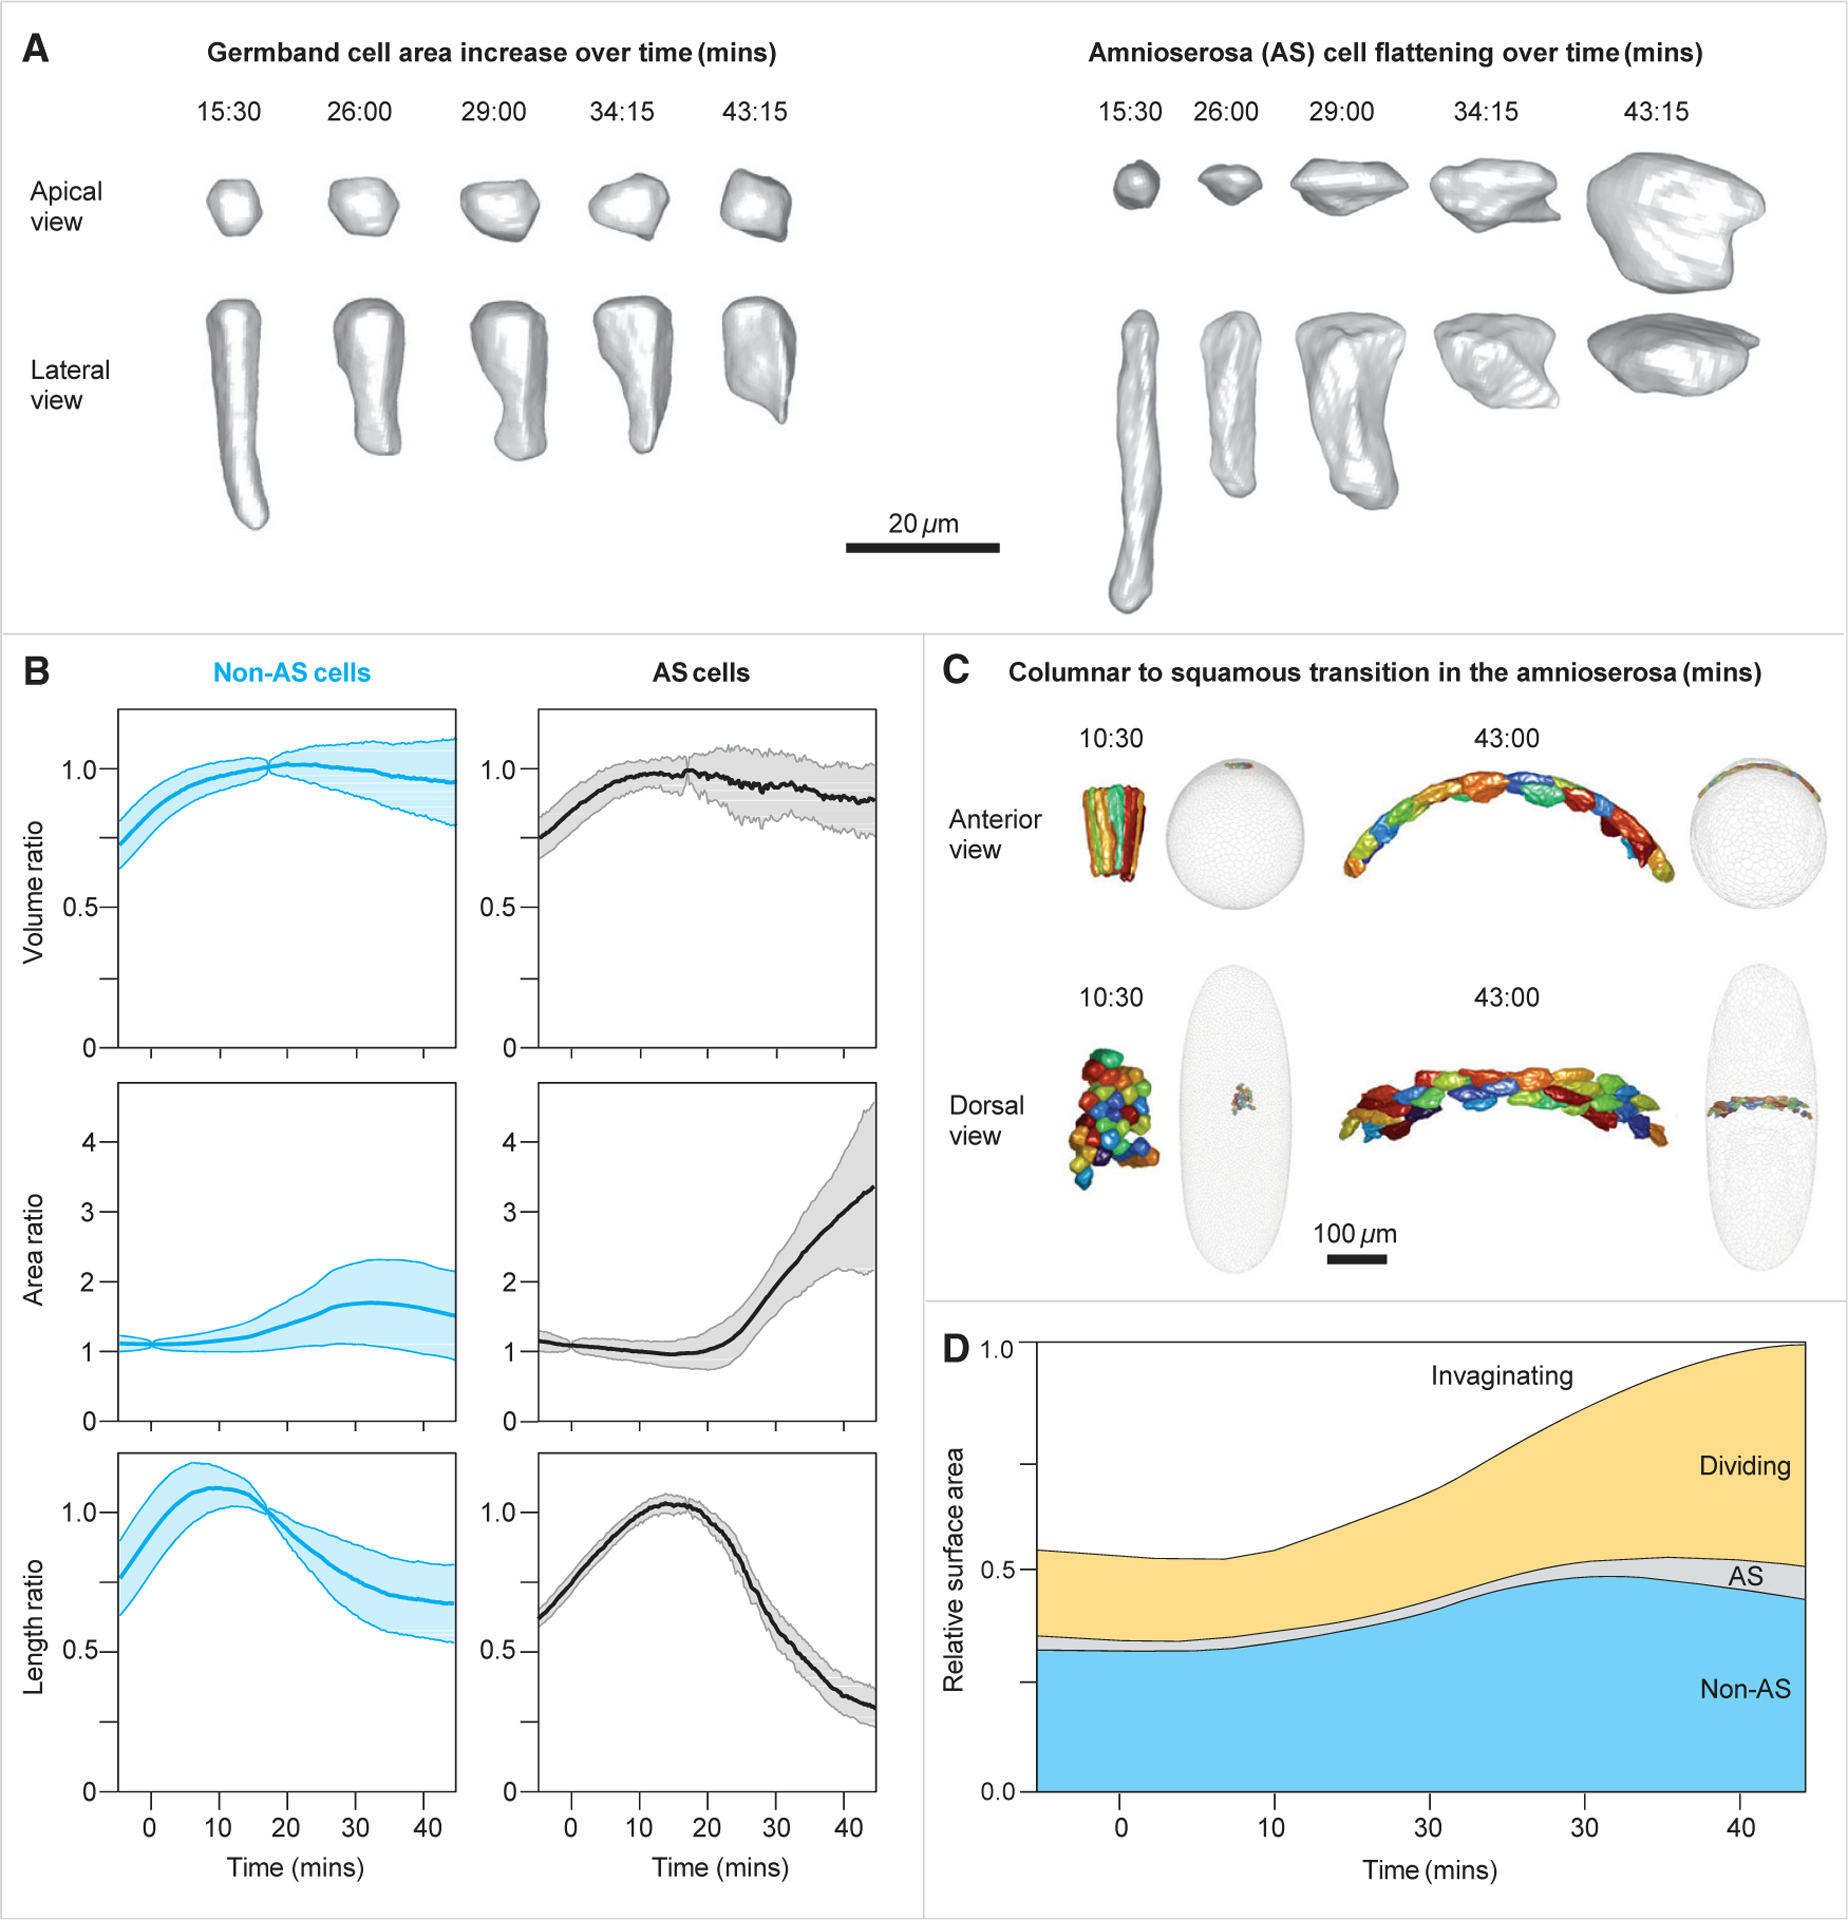
Gastrulation movements in all animal embryos start with regulated deformations of patterned epithelial sheets, which are driven by cell divisions, cell shape changes, and cell intercalations. Each of these behaviors has been associated with distinct aspects of gastrulation1-4 and has been a subject of intense research using genetic, cell biological, and more recently, biophysical approaches.5-14 Most of these studies, however, focus either on cellular processes driving gastrulation or on large-scale tissue deformations.15-23 Recent advances in microscopy and image processing create a unique opportunity for integrating these complementary viewpoints.24-28 Here, we take a step toward bridging these complementary strategies and deconstruct the early stages of gastrulation in the entire Drosophila embryo. Our approach relies on an integrated computational framework for cell segmentation and tracking and on efficient algorithms for event detection. The detected events are then mapped back onto the blastoderm shell, providing an intuitive visual means to examine complex cellular activity patterns within the context of their initial anatomic domains. By analyzing these maps, we identified that the loss of nearly half of surface cells to invaginations is compensated primarily by transient mitotic rounding. In addition, by analyzing mapped cell intercalation events, we derived direct quantitative relations between intercalation frequency and the rate of axis elongation. This work is setting the stage for systems-level dissection of a pivotal step in animal development.


Conflict of interest statement

Declaration of interests The authors declare no competing interests.

Figures

Figure 1.
Figure 1.. A pipeline for whole-embryo cell segmentation and tracking and cell invagination mapping
(A) Demonstration of whole-embryo single-cell segmentation and tracking. Lateral, ventral, and dorsal views of the 3D polygonal mesh at 0 and 30 min. Cells intersecting with the mid-coronal plane, the mid-sagittal plane, and three transverse planes have been distinctly colored to demonstrate cell tracking and to reveal how the embryo deforms over time. (B) Lateral view of the embryo at four time points showing cells that will have invaginated by the end of the movie (gray) and cells that remain on the surface through this time period (white). (C) Quantification of the number and percent of cells (left and right vertical axes, respectively) remaining on the surface of the embryo over time. (D) Left: projection of cells undergoing invagination during the first 45 min of gastrulation over the 3D blastoderm shell in lateral and ventral views. Right: Mercator projection of the invagination sites. Each cell is color-coded for the first time point in which it is no longer visible from the outside of the embryo. t = 0 was set as the beginning of apical constriction in the invaginating mesodermal cells. CF, cephalic furrow; VF, ventral furrow; PDF, posterior dorsal fold; PMG, posterior midgut. Data are derived from embryo #1. See also Figures S1 and S4 and Videos S1, S2, and S3.
Figure 2.
Figure 2.. Cell intercalation distribution and quantitative relation to axis elongation
(A) Three-dimensional reconstructions of a representative T1-transition and a 6-cell rosette. (B) Mercator projection showing the number of intercalary events in which a cell participates over the first 45 min of gastrulation (both T1s and rosettes). (C) Top: a lateral view of the embryo showing the trajectory of a single cell that participates in 10 sequential intercalation events. Each red dot marks the position of the cell at the moment of an event. Bottom: segmented view of this cell with its neighbors throughout tissue elongation. The central vertex at each intercalation is marked by a cyan circle, and numbers indicate cell identities. (D) Top: cells participating in each T1-transition have been mapped to the blastoderm and the centers of the two approaching cells joined by a straight line. Bottom: the distribution function of the angles made by these lines and the ventral midline of the embryo (blue; average ± SD = 91.3° ± 14.7°, n = 1,178). (E) Top: cells participating in each 5-cell rosette have been mapped to the blastoderm, and the centers of the two most distant cells joined by a straight line. Bottom: the distribution function of the angles made by these lines and the ventral midline of the embryo (average ± SD = 89.81° ± 14.8°, n = 455). (F) Comparison of the temporal frequencies of T1 transitions and 5-, 6-, and 7-cell rosettes between left and right sides of the embryo. (G) Lateral view of the 3D surface of the embryo at 0 and 45 min, demonstrating convergence and extension of the germband (gray). The length of the germband is measured as the length of the midline (cyan). (H) Comparison between the actual fractional elongation of the germband plotted as a function of the normalized cumulative number of events (cyan), and fractional elongation predicted by the model (black; see text). (I) Linear regression of the mean-field model (black). Each dot (cyan) is the log fractional elongation of the germband over 1 min as a function of the normalized cumulative number of events during the same time period. (J) Parametric plot of the time dependent germband length constructed based on the mean-field model and measured number of intercalary events. Blue, measured; red, predicted. Data are derived from embryo #1. Data for three additional embryos are supplied in Figures S3C–S3F. See also Figures S1H–S1J.
Figure 3.
Figure 3.. Shape dynamics of dividing cells and the transformations of mitotic domains
(A) Spatial map of divisions, with dividing cells shown in their original positions at the blastoderm stage, and color indicating their time of completion of their division. Mitotic domains indicated by the nomenclature proposed by Victoria Foe. (B) Three-dimensional reconstruction of a dividing cell, showing transient increase in apical area upon rounding up. (C and D) Histograms of the ratios of final to initial cell volume (C) and final to initial cell apical area (D) in dividing cells. In both histograms tfinal = 43:00. For cell areas tinitial = 0:00 and for cell volumes it is the time at which cellularization is completed in the entire embryo (tinitial = 17:00). (E) Average and SD of apical area from domain #1. Values represent the apical area of the mother cell and the summed apical areas of both daughter cells. The sharp increase in area toward t = 0 is followed by decrease to approximately pre-division levels, demonstrating that cell divisions have a significant, yet transient contribution to tissue expansion. (F) Average and SD of apico-basal cell height from domain #1. (G) Polar histogram of the distribution of division orientations within the domain relative to the DV-AP axes of the embryo at the time of the event (90° = dorsal; average = 4.5°, order parameter = 0.31, n = 76; p = 0.004, Rayleigh test for circular uniformity). (H) (Left to right) Shapes of the domain before and after the completion of divisions, and their overlay demonstrates their initial dissimilarity. Overlay of the premitotic domain following a simple area-preserving linear transformation which includes a stretch and a compression factor, and the postmitotic domain, demonstrating a good approximation (right most). Data in (A) and (D) are derived from embryo #2 and in (B) and (C) from embryo #1. See also Figures S1H–S1J, S2, S3A, and S3B.
Figure 4.
Figure 4.. Cell flattening and relative contribution of the three different processes to epithelial expansion
(A) Three-dimensional reconstruction of the geometric transformations of cells from the germband (left) and from the amnioserosa (right). (B) Dynamics of the volume ratios, area ratios, and apico-basal length in non-AS (left) and AS (right) cells. Blue and black lines are averages, and shaded colors are the SDs over time. The completion of cellularization in the non-AS cells (approximately 8 min) and in the AS cells (approximately 11 min) is indicated by peak in the cell length. At that point, volumes remain relatively constant, and apical surface areas begin to increase. (C) Three-dimensional reconstruction of AS cells before and late in the columnar-to-squamous transition, shown as anterior (top) and dorsal (bottom) views. In the gray whole-embryo views, the locations of the colored AS cells are shown viewed from the anterior end (upper images) or from the dorsal side (lower images). (D) The fraction of embryo surface occupied by cells undergoing each of the four behaviors over time, demonstrating the compensation of area loss due to cell invagination. In (B) and (D), the numbers of invaginating cells is 2,808, the number of dividing cells is 1,110, and the numbers of non-AS and AS cells are 1,991 and 176, respectively. Data are derived from embryo #1. See also Figure S4 and Video S4.

References

    1. Irvine KD, and Wieschaus E (1994). Cell intercalation during Drosophila germband extension and its regulation by pair-rule segmentation genes. Development 120, 827–841. - PubMed
    1. Foe VE (1989). Mitotic domains reveal early commitment of cells in Drosophila embryos. Trends Genet. 5, 322. - PubMed
    1. Pope KL, and Harris TJC (2008). Control of cell flattening and junctional remodelling during squamous epithelial morphogenesis in Drosophila. Development 135, 2227–2238. - PubMed
    1. Sweeton D, Parks S, Costa M, and Wieschaus E (1991). Gastrulation in Drosophila: the formation of the ventral furrow and posterior midgut invaginations. Development 112, 775–789. - PubMed
    1. Paré AC, Vichas A, Fincher CT, Mirman Z, Farrell DL, Mainieri A, and Zallen JA (2014). A positional Toll receptor code directs convergent extension in Drosophila. Nature 515, 523–527. - PMC - PubMed

Publication types

LinkOut - more resources