. 2022 Mar 31;185(7):1223-1239.e20.
doi: 10.1016/j.cell.2022.02.015. Epub 2022 Mar 14.

Spatial CRISPR genomics identifies regulators of the tumor microenvironment

Affiliations

Spatial CRISPR genomics identifies regulators of the tumor microenvironment

Maxime Dhainaut et al. Cell. .

Abstract

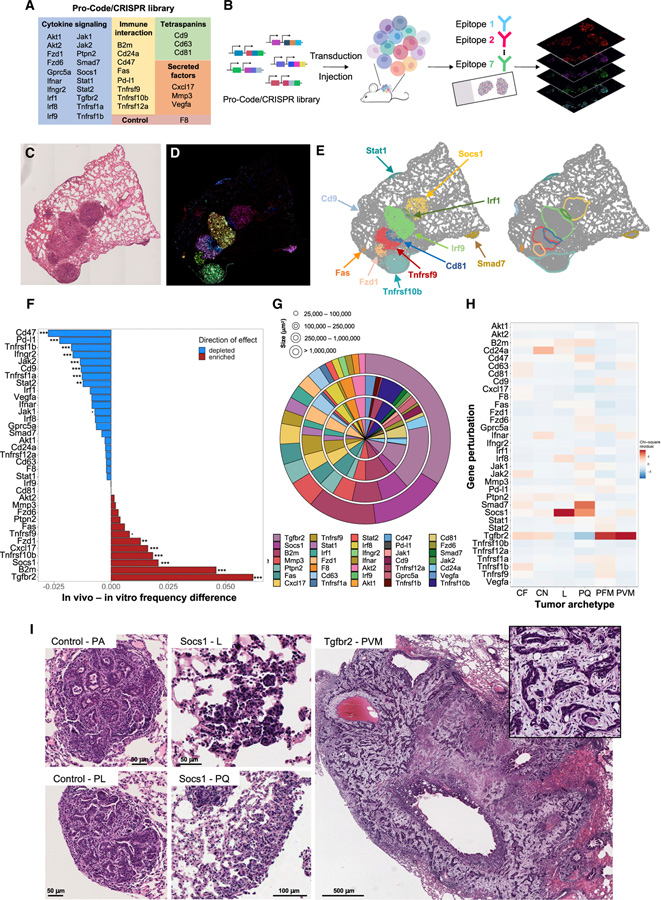
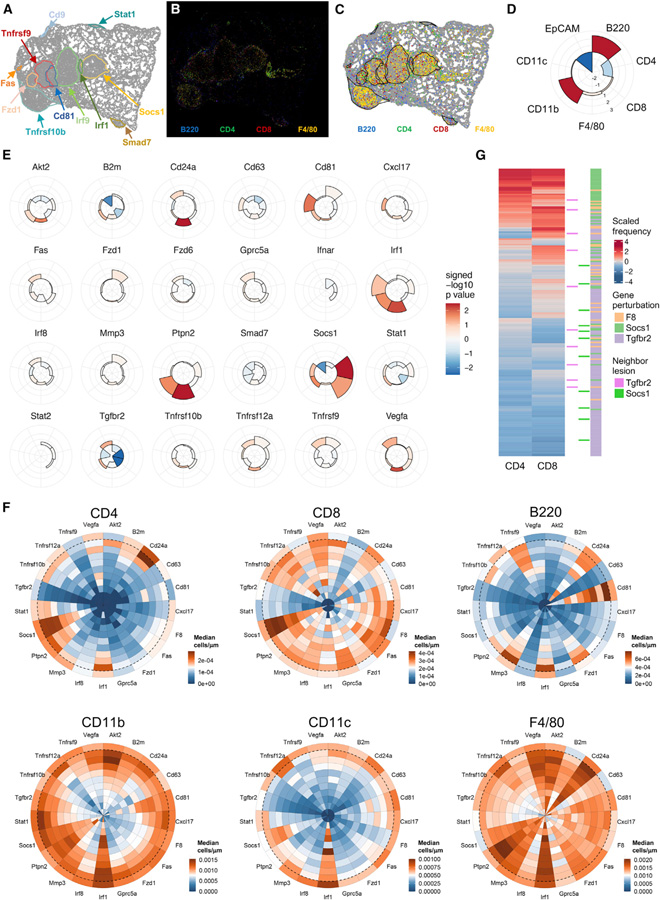
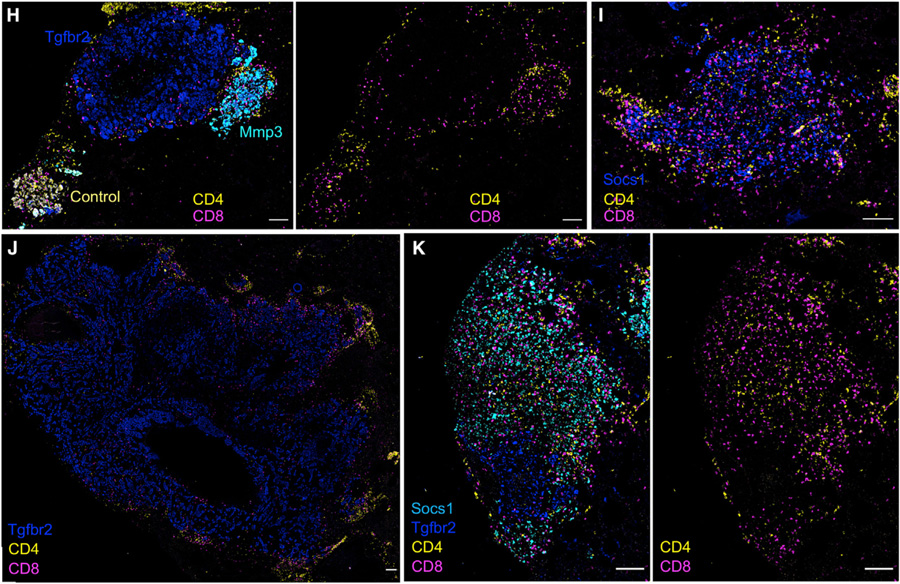
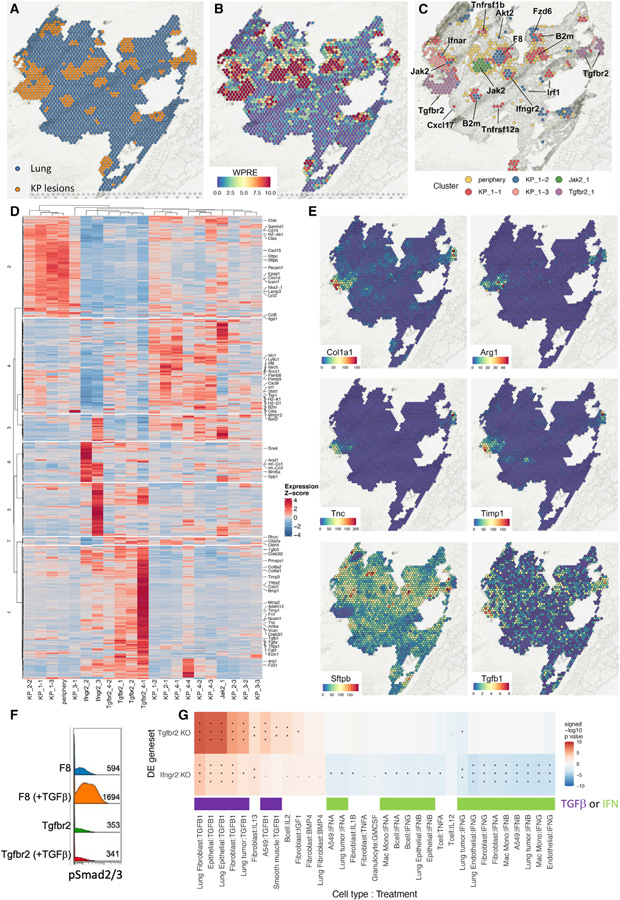
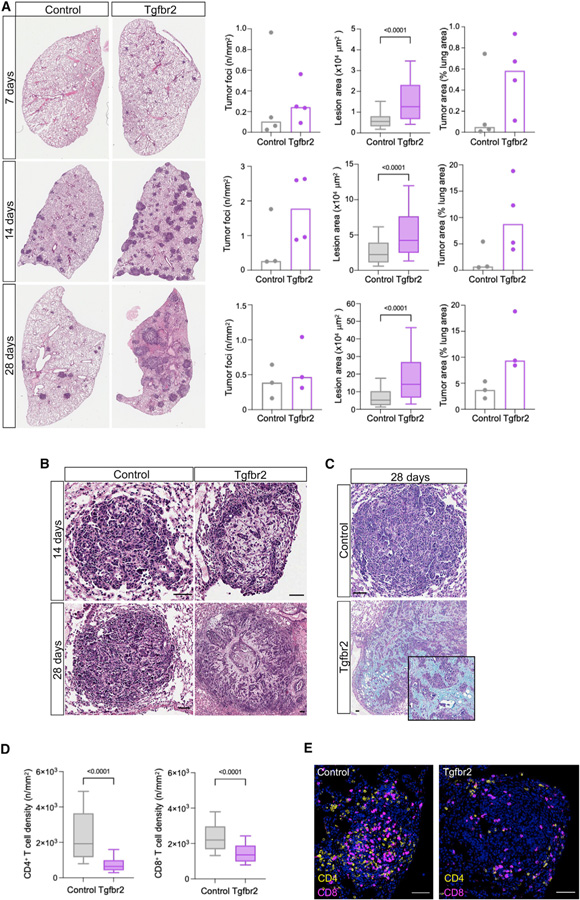
While CRISPR screens are helping uncover genes regulating many cell-intrinsic processes, existing approaches are suboptimal for identifying extracellular gene functions, particularly in the tissue context. Here, we developed an approach for spatial functional genomics called Perturb-map. We applied Perturb-map to knock out dozens of genes in parallel in a mouse model of lung cancer and simultaneously assessed how each knockout influenced tumor growth, histopathology, and immune composition. Moreover, we paired Perturb-map and spatial transcriptomics for unbiased analysis of CRISPR-edited tumors. We found that in Tgfbr2 knockout tumors, the tumor microenvironment (TME) was converted to a fibro-mucinous state, and T cells excluded, concomitant with upregulated TGFβ and TGFβ-mediated fibroblast activation, indicating that TGFβ-receptor loss on cancer cells increased TGFβ bioavailability and its immunosuppressive effects on the TME. These studies establish Perturb-map for functional genomics within the tissue at single-cell resolution with spatial architecture preserved and provide insight into how TGFβ responsiveness of cancer cells can affect the TME.

Keywords: CRISPR screens; Socs1; TGF beta; cancer immunology; interferon gamma; lung cancer; spatial genomics; spatial transcriptomics; tumor clonality; tumor microenvironment.


Conflict of interest statement

Declaration of interests B.D.B. and A.W. have filed a patent application related to the Pro-Code technology.

Figures

Figure 1.
Figure 1.. Multiplex imaging maps Pro-Code labeled breast and lung cancer populations in situ
(A and B) Representative image of memPC-expressing 4T1 breast tumor (84 memPC, 9 tags). Multiplex imaging performed by MICSSS. Seven tags shown simultaneously in (B), color coded as indicated. Image representative of >10 tumors (n = 10 mice), from 2 different experiments with 84 or 120 memPC. (C) Representative image of memPC labeled KP tumor lesions in the lung (120 memPC, 10 tags). Imaging performed by MICSSS. Seven tags represented simultaneously; color coded as indicated. Image representative of 10 mice, from 2 different experiments with different memPC libraries.
Figure 2.
Figure 2.. Analysis of tumor development by Pro-Code mapping reveals tumor clonal heterogeneity
(A) Representative image of nPC-labeled 4T1 breast tumor (120 nPC, 10 tags). Six tags are represented. Image representative of 16 tumors, across 2 different experiments with different nPC libraries. (B) Colocalization analysis quantifying the interactions between nPC populations in a breast tumor (left) or lung tumor lesions (right) (with 120 nPC, 10 tags). Each square represents an interaction between two nPC populations and is color coded based on the significance of the interaction relative to a permuted null distribution generated by swapping Pro-Code labels (1,000 permutations). Shown are a representative tumor from 10 tumors across 5 mice (4T1) and a representative lung lobe from 15 lobes across 3 mice (KP). (C) Density maps of 6 randomly selected nPC populations from the 4T1 breast tumor displayed in 2D. The star corresponds to the example highlighted in Figure 2D. (D) Overlaid image of the 3 tags corresponding to Pro-Code 43 (PC 43), color coded as indicated. Cells expressing the 3 tags (i.e., PC 43) appear white. (E) Representative image of nPC 4T1 breast metastases in the lung (120 nPC, 10 tags), from 8 mice and 40 lung lobes. Six tags are represented. PC 9 (white square) and PC 11 (gold cells in the left square) are highlighted. (F) Comparative clonal analysis of 4T1 primary breast tumors in the mammary fat pad (green), KP tumor lesions in the lung (blue), and 4T1 metastases in the lung (orange). Plotted are the average clustering coefficient and group degree centrality (fraction of alternate nPC neighbors) from a neighbors graph constructed on nPC+ cells (k = 10, maximum cell radius 40 μm). Each point represents one nPC on an individual tissue section. Only nPC present in >20 cells on a tissue section is displayed.
Figure 3.
Figure 3.. Perturb-map identifies genes regulating tumor development and architecture in vivo
(A) Table of the genes targeted in the Pro-Code/CRISPR library. (B) Perturb-map experimental pipeline. For the studies in Figures 3 and 4, KP-Cas9 were transduced with the nPC/CRISPR library in (A) and injected into 11 mice from 2 independent experiments (n = 5 and 6). Lungs were collected after 4 weeks, and Formalin-fixed, paraffin-embedded (FFPE) tissue sections were prepared and stained for 7 tags to detect 35 nPC populations and for specific cell markers (see Figure 4). Sections imaged by whole slide scanning. (C–E) Overview of the Perturb-map analysis pipeline. (C) Representative H&E section of 1 lung lobe from a mouse. (D) Overlay of pseudocolored nPC tag staining for the same tissue section as in (C). Different colored areas correspond to different nPC populations. (E) Debarcoded and reconstituted digital image of the tissue section in (D). (Left panel) Each dot represents a cell, colored based on nPC expression (nPC negative cells in gray). Gene perturbation can be annotated directly on the image based on nPC expression. (Right panel) Tumor boundaries were defined following DBSCAN clustering of nPC+ cells. (F) Relative frequency of nPC/CRISPR KP tumors. The frequency of each nPC/CRISPR KP-Cas9 population was determined pre-injection (by CyTOF) and compared with the relative abundance of corresponding nPC/CRISPR lesions in vivo. Significant differences in tumor engraftment were determined using a one-sample two-tailed Poisson exact test comparing to F8 engraftment as the null hypothesis. Poisson rate parameters were determined by the ratio of formed tumor lesions in vivo to the number of cells in vitro pre-injection for each KO (. = p < 0.1; * = p < 0.05; ** = p < 0.01; *** = p < 0.001). (G) Quantification of tumor lesions’ size across gene perturbations. Shown are percentages of tumors associated with each gene perturbation within discrete tumor size categories. Each ring corresponds to a tumor size range as indicated. Perturbations are organized in clockwise order from Tgfbr2, following the order represented in the figure legend. (H) Histopathology analysis of nPC/CRISPR tumor lesions. Total of ~1,750 tumors was scored on H&E sections (with no Pro-Code staining) and tumor histopathological archetype identified. The heatmap shows the standardized residuals of a chi-squared test between gene perturbation and tumor archetype (chi-squared p value 4.43 × 10⁻¹⁴). (I) Representative example of tumor archetypes associated with Socs1 and Tgfbr2 gene KO. PA, parenchymal; PL, pleural; L, lepidic; PQ, pleural plaque; PVM, perivascular mucinous tumor.
Figure 4.
Figure 4.. Perturb-map analysis of immune composition in gene KO tumor lesions
(A–D) Perturb-map analysis pipeline for the quantification of immune infiltration and EpCAM expression. Analysis was performed on lung tissue collected from mice described in Figure 3 (n = 11 mice, 2 separate experiments, 41 lung lobes, 2 images/lobe, for a total of 8,442,439 cells analyzed). (A) Representative example of an in silico reconstituted image displaying tumor boundaries (the same section as Figures 3C–3E, digital image shown is from the right panel of Figure 3D for perspective). (B) Representative image of immune infiltration in KP lung tumor lesions. Lung tissue sections stained for Pro-Code and B220, CD4, CD8, CD11b, CD11c, F4/80, and EpCAM using MICSSS. Color coded as indicated. (C) Cells positive for each immune markers are displayed in the in silico Pro-Code tumor map and quantified within each tumor lesion. (D) Schematic of a radial plot used to visualize the immune landscape associated with each gene perturbation. Each fraction corresponds to immune cell density, or mean intensity of EpCAM staining, within the tumor border. Bar height represents the Z-score of the difference in medians between control tumors (n = 55) and tumors carrying gene perturbations. Color indicates the −log10 adjusted p value of a Wilcoxon rank-sum test of the same comparison. (E) Analysis of immune infiltration and exclusion in Pro-Code/CRISPR lung tumors. Shown are radial plots indicating immune density (and EpCAM expression) of tumors with the indicated gene perturbation. Radial plots are organized as in (D). Gene perturbations with fewer than 20 lesions were excluded from the analysis. (F) Analysis of the immune cell distribution within tumor lesions. Each slice represents lesions with a specific gene perturbation. The median cell density was calculated in 10% window increments from the tumor border (dashed line) to the tumor core, and in the 10% window expanding outward. Only tumors >100,000 μm2 were used for the median calculation. (G) Examination of T cell density in F8, Socs1, or Tgfbr2 tumors related to their proximity to Socs1 or Tgfbr2 tumors. The heatmap represents the Z-score of log-transformed CD4+ and CD8+ T cell density (censored at the 95th percentile) in control (F8), Socs1, and Tgfbr2 tumors. Tumors neighbored by a Socs1 or Tgfbr2 lesion (boundary distance less than 75 μm) are identified. (H–K) Representative examples of CD4+ (yellow) and CD8+ (purple) T cell infiltration within indicated tumor lesions. Annotated gene perturbations were identified based on Pro-Code expression.
Figure 5.
Figure 5.. Perturb-map with spatial transcriptomics identifies perturbation-specific gene signatures
(A) K-means clustering of KP lesions and noninvolved lung from a representative tissue section profiled by spatial transcriptomics (10× Visium). (B) Unique molecular identifier (UMI) counts of reads mapping to the WPRE region of the Pro-Code transcript in each Visium spot. (C) Leiden clustering of Pro-Code+ spots. Gene perturbations were annotated based on imaging mass cytometry. Additional clusters include spots corresponding to the tumor periphery (periphery) or KP lesions not specific to a particular gene KO (labeled KP followed by tissue section ID and an arbitrary cluster number). (D) Differentially expressed genes (DEGs) in Ifngr2 and Tgfbr2 spot clusters. Genes and spot cluster mean profiles were hierarchically clustered using Pearson correlation distance and average agglomeration. Color corresponds to the row Z-score of log SCTransform corrected counts. (E) UMI counts for indicated transcripts. (F) KP-Cas9 expressing F8 or Tgfbr2 gRNAs were treated for 16 h with TGFβ (20 ng/mL), stained for phosphorylated Smad2 and Smad3 (pSmad2/3), and analyzed by flow cytometry. Numbers indicate the median fluorescence intensity. (G) GSEA using CytoSig derived gene sets for different cell types and treatment conditions. Average log2 fold-change of DEGs (Bonferroni-adjusted p value < 0.01) in the listed signature were used as input. p value sign indicates direction of enrichment (. = p < 0.1; * = p < 0.05; ** = p < 0.01; *** = p < 0.001).
Figure 6.
Figure 6.. Kinetics of Tgfbr2 KO and control KP lung tumor development
(A) Comparison of lung tumor burden between mice bearing control or Tgfbr2 KO KP tumors (n = 3–4 mice/group/time point). Whole lung sections were stained with H&E. A representative lung lobe is shown for each condition. Density of tumor lesion (left graph), lesion size (middle graph), and total tumor area (right graph) were quantified. Lesion area across samples was analyzed using a Mann-Whitney test. (B) Representative examples of control or Tgfbr2 KO tumor lesions stained with H&E. Scale bars, 50 mm. (C) Representative examples of control or Tgfbr2 KO tumor lesions stained with Alcian blue and PAS. Scale bars, 50 mm. (D) Quantification of CD4+ (left) and CD8+ (right) densities in tumor lesions across all samples at 14 day. Statistical significance was determined using a Mann-Whitney test. (E) Representative image of T cell infiltration in a control or Tgfbr2 KO tumor lesion. Scale bars, 50 μm.

Comment in

References

    1. Adamson B, Norman TM, Jost M, Cho MY, Nuñez JK, Chen Y, Villalta JE, Gilbert LA, Horlbeck MA, Hein MY, et al. (2016). A multiplexed single-cell CRISPR screening platform enables systematic dissection of the unfolded protein response. Cell 167, 1867–1882.e21. - PMC - PubMed
    1. Akturk G, Sweeney R, Remark R, Merad M, and Gnjatic S (2020). Multiplexed immunohistochemical consecutive staining on single slide (MICSSS): Multiplexed chromogenic IHC assay for high-dimensional tissue analysis. Methods Mol. Biol. 2055, 497–519. - PMC - PubMed
    1. Bankhead P, Loughrey MB, Ferná ndez JA, Dombrowski Y, McArt DG, Dunne PD, McQuaid S, Gray RT, Murray LJ, Coleman HG, et al. (2017). QuPath: Open source software for digital pathology image analysis. Sci. Rep. 7, 16878. - PMC - PubMed
    1. Batlle E, and Massagué J (2019). Transforming growth factor-β signaling in immunity and cancer. Immunity 50, 924–940. - PMC - PubMed
    1. Benci JL, Johnson LR, Choa R, Xu Y, Qiu J, Zhou Z, Xu B, Ye D, Nathanson KL, June CH, et al. (2019). Opposing functions of interferon coordinate adaptive and innate immune responses to cancer immune checkpoint blockade. Cell 178, 933–948.e14. - PMC - PubMed

Publication types

Substances