[Preprint]. 2024 Mar 15:2022.03.04.483074.
doi: 10.1101/2022.03.04.483074.

SARS-CoV-2 remodels the Golgi apparatus to facilitate viral assembly and secretion

Affiliations

SARS-CoV-2 remodels the Golgi apparatus to facilitate viral assembly and secretion

Jianchao Zhang et al. bioRxiv. .

Update in

Abstract

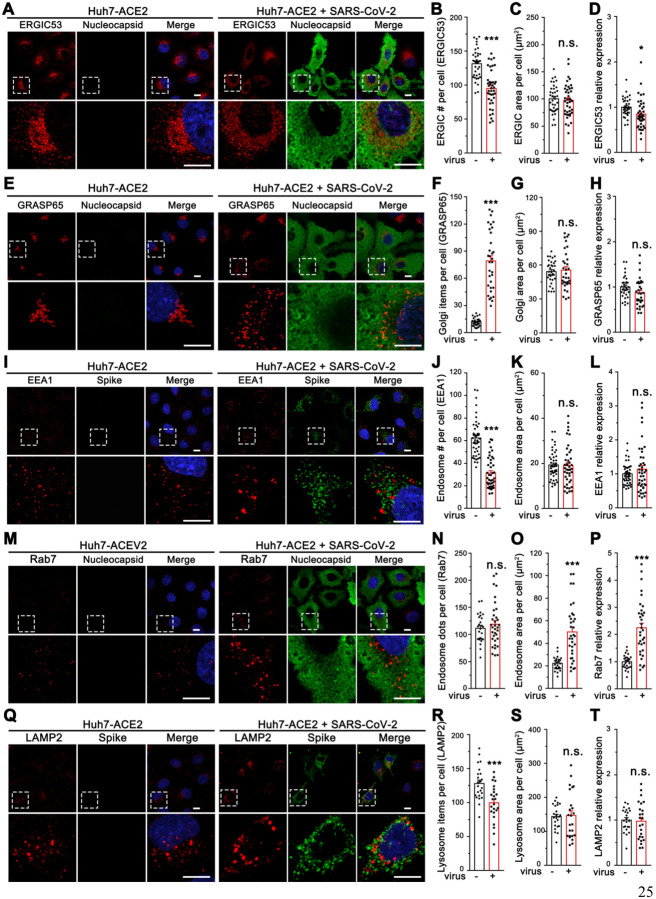
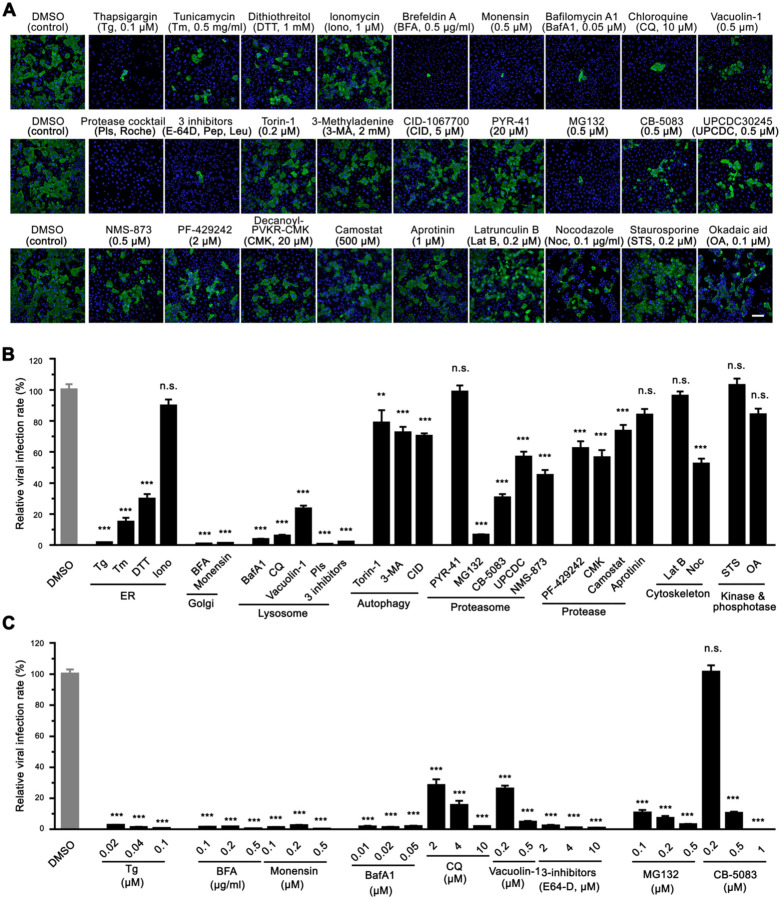
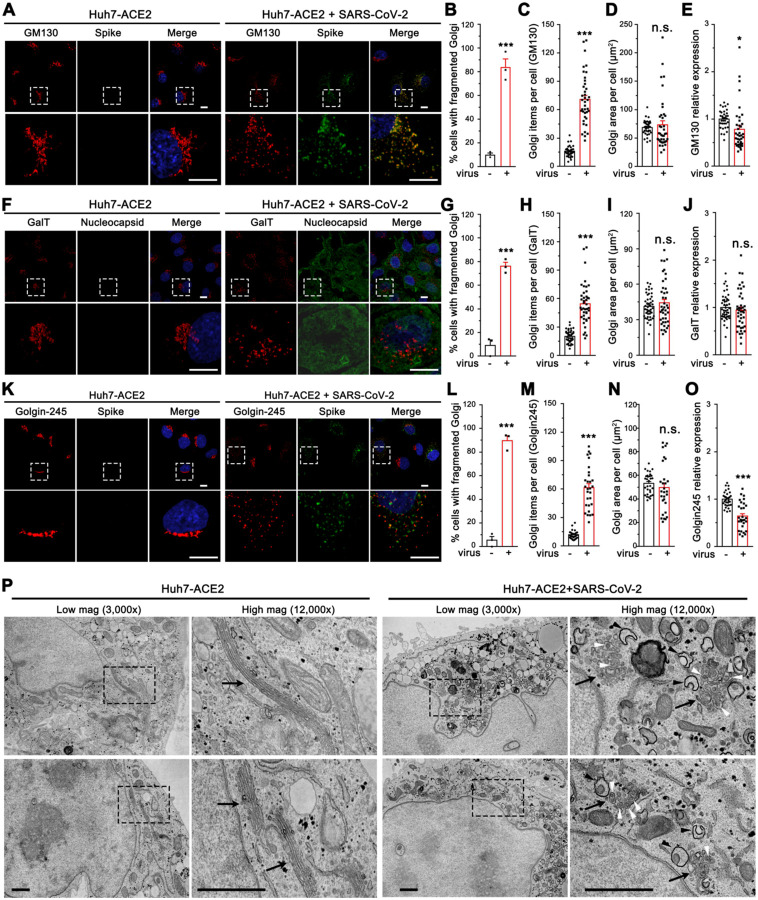
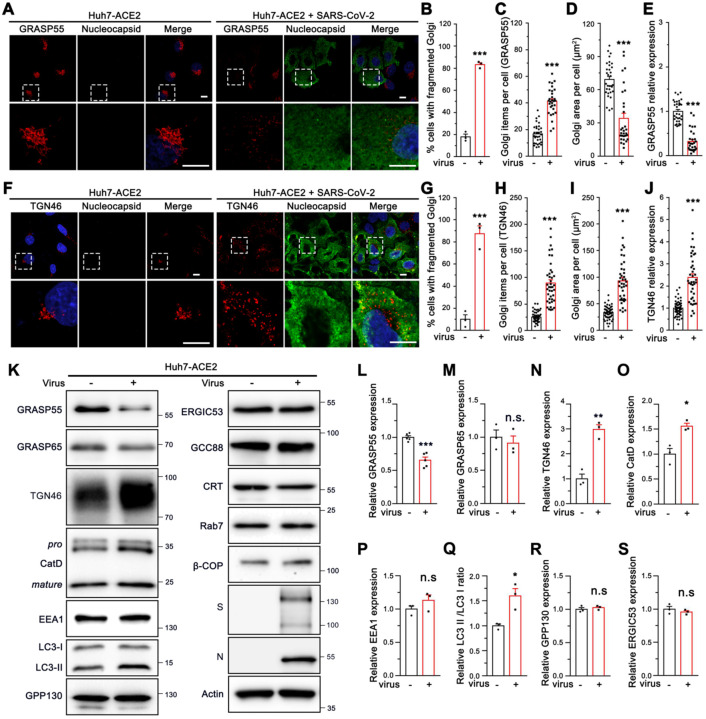
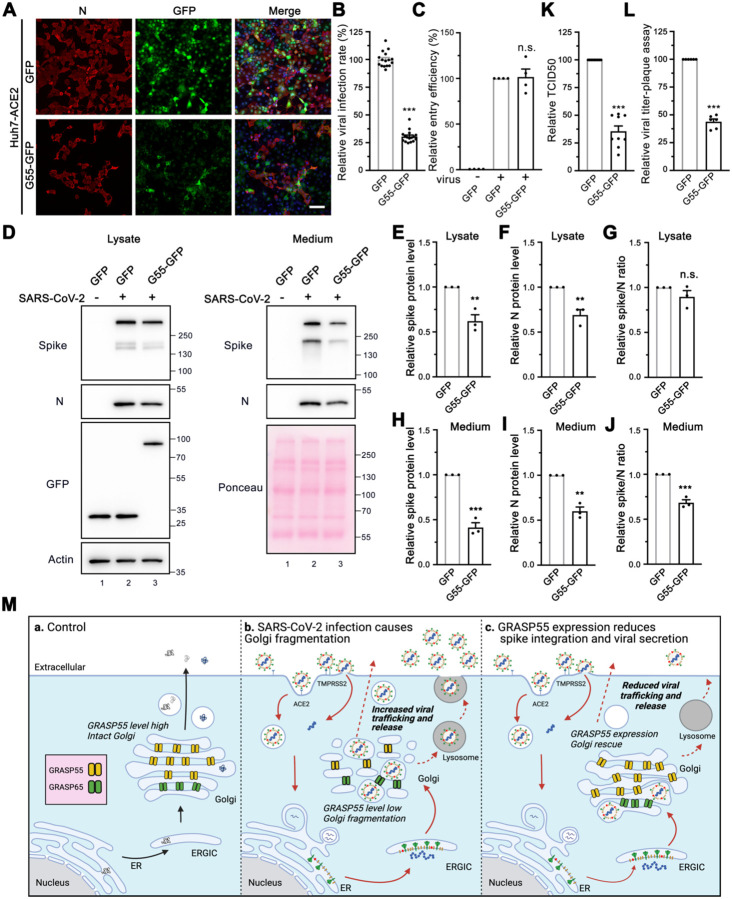
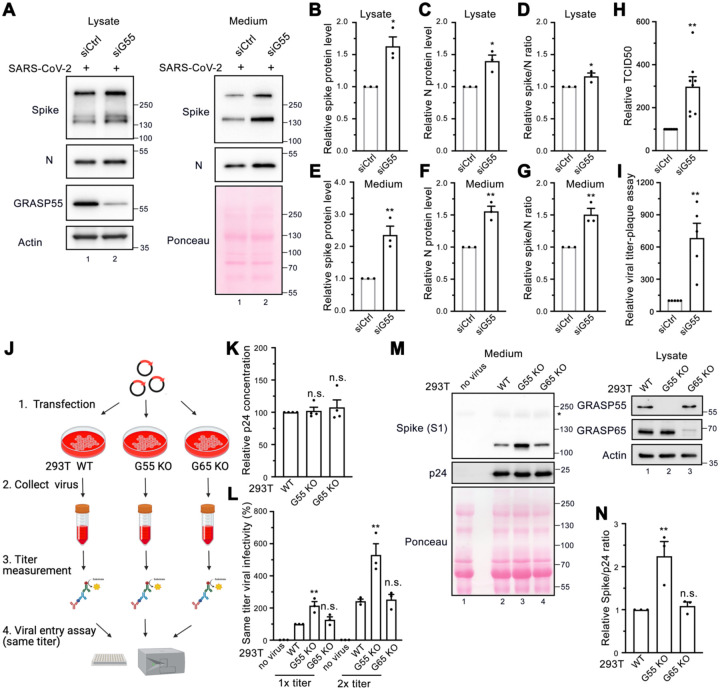
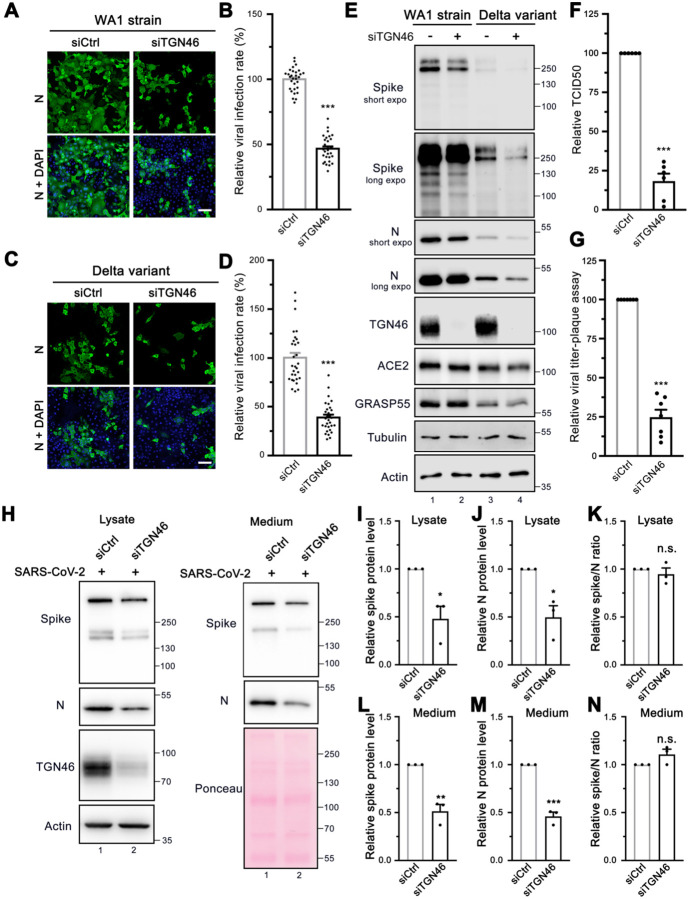
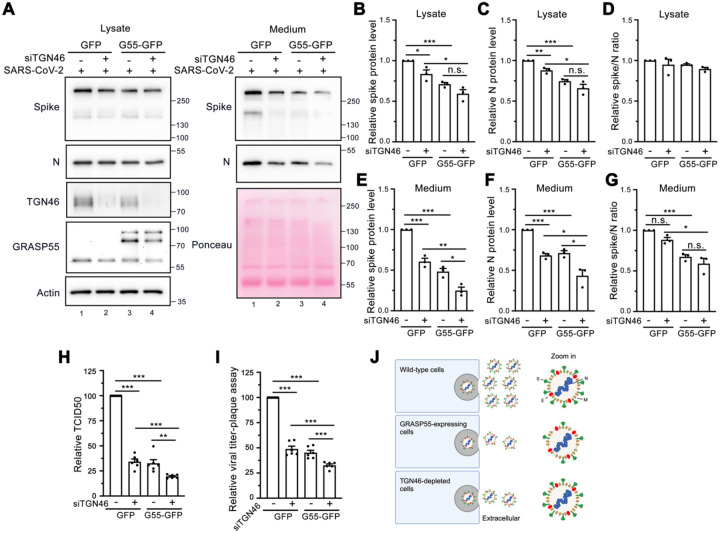
The COVID-19 pandemic is caused by SARS-CoV-2, an enveloped RNA virus. Despite extensive investigation, the molecular mechanisms for its assembly and secretion remain largely elusive. Here, we show that SARS-CoV-2 infection induces global alterations of the host endomembrane system, including dramatic Golgi fragmentation. SARS-CoV-2 virions are enriched in the fragmented Golgi. Disrupting Golgi function with small molecules strongly inhibits viral infection. Significantly, SARS-CoV-2 infection down-regulates GRASP55 but up-regulates TGN46 protein levels. Surprisingly, GRASP55 expression reduces both viral secretion and spike number on each virion, while GRASP55 depletion displays opposite effects. In contrast, TGN46 depletion only inhibits viral secretion without affecting spike incorporation into virions. TGN46 depletion and GRASP55 expression additively inhibit viral secretion, indicating that they act at different stages. Taken together, we show that SARS-CoV-2 alters Golgi structure and function to control viral assembly and secretion, highlighting the Golgi as a potential therapeutic target for blocking SARS-CoV-2 infection.

Keywords: GRASP55; Golgi fragmentation; SARS-CoV-2; TGN46; trafficking; viral assembly.


Conflict of interest statement

DECLARATION OF INTERESTS The authors declare no competing interests.

Figures

Figure 1.
Figure 1.. SARS-CoV-2 infection induces global morphological changes of host cell membrane organelles.
(A) Representative confocal images of Huh7-ACE2 cells incubated with or without SARS-CoV-2 (MOI = 1) for 24 h and stained for ERGIC53 and nucleocapsid. (B-D) Quantification of ERGIC53 for the number of puncta (B), area (C), and relative expression (D) in A. (E) Representative confocal images of Huh7-ACE2 cells incubated with or without SARS-CoV-2 (MOI = 1) for 24 h and stained for a cis-Golgi marker GRASP65 and nucleocapsid. (F-H) Quantification of GRASP65 item number (F), area (G), and relative expression (H) in E. (I) Representative confocal images of Huh7-ACE2 cells incubated with or without SARS-CoV-2 (MOI = 1) for 24 h and stained for an early endosome marker EEA1 and spike. (J-L) Quantification of EEA1 item number (J), area (K), and relative expression (L) in I. (M) Representative confocal images of Huh7-ACE2 cells incubated with or without SARS-CoV-2 (MOI = 1) for 24 h and stained for a late endosome marker Rab7 and nucleocapsid. (N-P) Quantification of Rab7 in M. (Q) Representative confocal images of Huh7-ACE2 cells incubated with or without SARS-CoV-2 (MOI = 1) for 24 h and stained for a late endosome/lysosome marker LAMP2 and spike. (R-T) Quantification of Rab7 in Q. Boxed areas in the upper panels are enlarged and shown underneath. Scale bars in all panels, 10 μm. All quantitation data are shown as mean ± SEM from three independent experiments. Statistical analyses are performed using two-tailed Student’s t-test. *, p < 0.05; **, p < 0.01; ***, p < 0.001; n.s., not significant.
Figure 2.
Figure 2.. Chemicals disrupting Golgi functions inhibit SARS-CoV-2 infection.
(A) Representative immunofluorescence images of Huh7-ACE2 cells infected with SARS-CoV-2 (MOI = 1) for 24 h in the presence of indicated chemicals and stained for nucleocapsid and DNA. The concentrations of the chemical are shown on the figure or as follows: protease inhibitor cocktails (PIs), 100 ml/tablet; 3 inhibitors, 10 μM E-64D, 20 μM pepstatin, 100 μM leupeptin. Scale bar, 100 μm. (B) Quantification of the viral infection rate in A, with the control normalized to 100%. Data are shown as mean ± SEM from 20–30 random images from two or three independent experiments. (C) Quantification of the viral infection rate in the presence of indicated chemicals with different concentrations (images are shown in Figure S3), with the control normalized to 100%. Data are shown as mean ± SEM from 10 representative images. Statistical analyses are performed using one-way ANOVA, Tukey’s multiple comparison test. *, p < 0.05; ***, p < 0.001; n.s., not significant.
Figure 3.
Figure 3.. SARS-CoV-2 infection dramatically disrupts the Golgi structure.
(A) Representative confocal images of Huh7-ACE2 cells incubated with or without SARS-CoV-2 (MOI = 1) for 24 h and stained for a cis-Golgi marker GM130 and nucleocapsid. (B-E) Quantification of A for the percentage of cells with fragmented Golgi (B), GM130 punctum number (C), area (D), and relative expression level (E). (F) Representative confocal images of Huh7-ACE2 cells incubated with or without SARS-CoV-2 (MOI = 1) for 24 h and stained for a trans-Golgi marker GalT and nucleocapsid. (G-J) Quantification of GalT in F. (K) Representative confocal images of Huh7-ACE2 cells incubated with or without SARS-CoV-2 (MOI = 1) for 24 h and stained for a TGN marker Golgin-245 and spike. Boxed areas in the upper panels of A, F and K are enlarged and shown underneath. Scale bars in all fluorescence images, 10 μm. (L-O) Quantification of Golgin-245 in K. (P) Electron micrographs of Huh7-ACE2 incubated with or without SARS-CoV-2 (MOI = 1) for 24 h under two different magnifications. Boxed areas on the left images are enlarged on the right. Black arrows, white arrowheads, and black arrowheads indicate Golgi membranes, viral particles, and DMVs, respectively. Scale bars, 500 nm. Data are shown as mean ± SEM from three independent experiments. Statistical analyses are performed using two-tailed Student’s t-test. *, p < 0.05; ***, p < 0.001; n.s., not significant.
Figure 4.
Figure 4.. SARS-CoV-2 down-regulates GRASP55 and up-regulates TGN46 expression in Huh7-ACE2 cells.
(A) SARS-CoV-2 infection reduces GRASP55 expression. Representative confocal images of Huh7-ACE2 cells incubated with or without SARS-CoV-2 (MOI = 1) for 24 h and stained for GRASP55 and nucleocapsid. (B-E) Quantification of the percentage of cells with fragmented Golgi (B), GRASP55 item number (C), area (D), and relative expression level (E) in A. (F) SARS-CoV-2 infection increases TGN46 expression. Representative confocal images of Huh7-ACE2 cells incubated with or without SARS-CoV-2 (MOI = 1) for 24 h and stained for TGN46 and nucleocapsid. Boxed areas in the upper panels of A and F are enlarged and shown underneath. Scale bars, 10 μm. (G-J) Quantification of the percentage of cells with fragmented Golgi (G), TGN46 item number (H), area (I), and relative expression level (J) in F. (K) Immunoblots of Huh7-ACE2 cells incubated with or without SARS-CoV-2 (MOI = 2) for 24 h for indicated proteins. (L-S) Quantification of the relative expression of GRASP55 (L), GRASP65 (M), TGN46 (N), CatD (O), EEA1 (P), LC3-II/LC3-I ratio (Q), GPP130 (R) and ERGIC53 (S). Data are shown as mean ± SEM from at least three independent experiments. Statistical analyses are performed using two-tailed Student’s t-test. *, p < 0.05; **, p < 0.01; ***, p < 0.001; n.s., not significant.
Figure 5.
Figure 5.. Expression of GRASP55 reduces SARS-CoV-2 assembly and secretion.
(A) GRASP55 expression reduces SARS-CoV-2 infection. Stable Huh7-ACE2 cells expressing GFP or GRASP55-GFP were infected with SARS-CoV-2 (MOI = 3) for 24 h and stained for nucleocapsid. Shown are representative fluorescence images from 15 random images of one representative replicate from three independent experiments. Scale bars, 100 μm. (B) Quantification of the viral infection rate in A. (C) Cell entry assay of stable 293T-ACE2 cells expressing either GFP or GRASP55-GFP by SARS-CoV-2 Spike pseudotyped lentivirus. (D) Immunoblots of cell lysates and PEG-precipitated culture media of stable Huh7-ACE2 cells expressing GFP or GRASP55-GFP infected with SARS-CoV-2 (MOI = 3) for 24 h for indicated proteins. (E-J) Quantification of the relative expression of spike (E, H), N (F, I), and relative spike/N ratio (G, J) from cell lysates and culture media, respectively. (K-L) TCID50 assay (K) and plaque assay (L) of viruses collected from stable Huh7-ACE2 cells expressing GFP or GRASP55-GFP after SARS-CoV-2 infection (MOI = 3) for 24 h. (M) Proposed working model for a role of GRASP55 in SARS-CoV-2 infection. In brief, under normal conditions (a) GRASP55 is expressed at a high level and maintains the Golgi in an intact structure. After SARS-CoV-2 infection (b), GRASP55 level is reduced, resulting in Golgi fragmentation that may facilitate viral assembly and trafficking. Conversely, when GRASP55 is exogenously expressed (c), the Golgi structure is reinforced and the viral assembly and trafficking speed is limited, thus inhibiting spike incorporation and viral release. Data are shown as mean ± SEM. Statistical analyses are performed using two-tailed Student’s t-test. **, p < 0.01; ***, p < 0.001; n.s., not significant.
Figure 6.
Figure 6.. Depletion of GRASP55 accelerates SARS-CoV-2 assembly and secretion.
(A) Immunoblots of cell lysates and PEG-precipitated culture media of Huh7-ACE2 transfected with siControl or siGRASP55 oligos for 48 h followed by SARS-CoV-2 infection (MOI = 3) for 24 h for indicated proteins. (B-G) Quantification of the relative expression of spike (B, E), N (C, F), and relative spike/N ratio (D, G) from cell lysates and culture media, respectively. (H-I) TCID50 assay (H) and plaque assay (I) of viruses collected from Huh7-ACE2 transfected with siControl or siGRASP55 oligos for 48 h followed by infection with SARS-CoV-2 (MOI = 3) for 24 h. (J-L) Diagram of a simplified protocol (J) of p24 titer measurement (K) and same-titer viral infectivity assay (L) of two different titers from SARS-CoV-2 Spike pseudotyped lentiviruses collected from wild-type (WT), GRASP55 KO, and GRASP65 KO 293T cells. (M) Immunoblots of virus pellets prepared from wild-type, GRASP55 KO, and GRASP65 KO 293T cells for indicated proteins. GRASP55 and GRASP65 proteins are blotted from cell lysates on the right panel. (N) Quantification of the relative spike/p24 ratio of same-titer virus pellets prepared from wild-type, GRASP55 KO, and GRASP65 KO 293T cells. Data are shown as mean ± SEM. Statistical analyses are performed using two-tailed Student’s t-test (B-I) and one-way ANOVA, Tukey’s multiple comparison test (K-L, N), respectively. *, p < 0.05; **, p < 0.01; n.s., not significant.
Figure 7.
Figure 7.. TGN46 is required for SARS-CoV-2 trafficking.
(A, C) TGN46 depletion reduces SARS-CoV-2 infection. Huh7-ACE2 cells were transfected with siControl or siTGN46 oligos for 48 h followed by infection (MOI = 1) with the WA1 strain (A) or Delta variant (C) of SARS-CoV-2 for 24 h and stained for nucleocapsid. Shown are representative fluorescence images from 30 random images from two independent experiments. Scale bars, 100 μm. (B, D) Quantification of the viral infection rate in A and C, respectively. (E) TGN46 depletion reduces viral protein expression in host cells. Huh7-ACE2 cells were transfected with siControl or siTGN46 oligos for 48 h followed by infection with SARS-CoV-2 WA1 strain and Delta variant (MOI = 3) for 24 h. Cell lysates were blotted for indicated proteins. Long and short exposures are shown for spike and N proteins. (F-G) TCID50 assay (F) and plaque assay (G) of viruses collected from Huh7-ACE2 transfected with siControl or siTGN46 oligos for 48 h followed by infection with SARS-CoV-2 for 24 h. (H) Immunoblots of cell lysates and PEG-precipitated culture media of Huh7-ACE2 transfected with siControl or siTGN46 oligos for 48 h followed by SARS-CoV-2 infection (MOI = 3) for 24 h for indicated proteins. (I-N) Quantification of the relative expression of spike (I, L), N (J, M), and relative spike/N ratio (K, N) from cell lysates and culture media, respectively. Data are shown as mean ± SEM. Statistical analyses were performed using two-tailed Student’s t-test. *, p < 0.05; **, p < 0.01; ***, p < 0.001; n.s., not significant.
Figure 8.
Figure 8.. Expression of GRASP55 and depletion of TGN46 additively inhibit viral trafficking.
(A) Immunoblots of cell lysates and PEG-precipitated culture media of Huh7-ACE2 cells stably expressing GFP or GRASP55-GFP and transfected with either siControl or siTGN46 oligos for 48 h followed by SARS-CoV-2 infection (MOI = 3) for 24 h for indicated proteins. (B-G) Quantification of the relative expression of spike (B, E), N (C, F), and the relative spike/N ratio (D, G) from cell lysates and culture media, respectively. (H-I) TCID50 assay (H) and plaque assay (I) of viruses collected from Huh7-ACE2 cells stably expressing GFP or GRASP55-GFP and transfected with either siControl or siTGN46 oligos with SARS-CoV-2 for 24 h. (J) A simplified working model illustrating the effects of GRASP55 and TGN46 expression levels on SARS-CoV-2 assembly and secretion. In brief, GRASP55 expression inhibits both SARS-CoV-2 spike incorporation into virions and viral trafficking, while TGN46 depletion only affects viral trafficking, with no impact on viral assembly. Data are shown as mean ± SEM. Statistical analyses were performed using two-tailed Student’s t-test. *, p < 0.05; **, p < 0.01; ***, p < 0.001; n.s., not significant.

References

    1. Ahat E., Bui S., Zhang J., da Veiga Leprevost F., Sharkey L., Reid W., Nesvizhskii A.I., Paulson H.L., and Wang Y. (2022a). GRASP55 regulates the unconventional secretion and aggregation of mutant huntingtin. J Biol Chem 298, 102219. - PMC - PubMed
    1. Ahat E., Song Y., Xia K., Reid W., Li J., Bui S., Zhang F., Linhardt R.J., and Wang Y. (2022b). GRASP depletion-mediated Golgi structural defect impairs glycosaminoglycan synthesis, sulfation, and secretion. Cellular and Molecular Life Sciences In press. - PMC - PubMed
    1. Ahat E., Xiang Y., Zhang X., Bekier M.E. 2nd, and Wang Y. (2019). GRASP depletion-mediated Golgi destruction decreases cell adhesion and migration via the reduction of alpha5beta1 integrin. Mol Biol Cell 30, 766–777. - PMC - PubMed
    1. Aviner R., and Frydman J. (2020). Proteostasis in Viral Infection: Unfolding the Complex Virus-Chaperone Interplay. Cold Spring Harb Perspect Biol 12. - PMC - PubMed
    1. Bekier M.E. 2nd, Wang L., Li J., Huang H., Tang D., Zhang X., and Wang Y. (2017). Knockout of the Golgi stacking proteins GRASP55 and GRASP65 impairs Golgi structure and function. Mol Biol Cell 28, 2833–2842. - PMC - PubMed

Publication types