

Expression of IER3 in hepatocellular carcinoma: clinicopathology, prognosis, and potential regulatory pathways
- PMID: 35291486
- PMCID: PMC8918148
- DOI: 10.7717/peerj.12944
Expression of IER3 in hepatocellular carcinoma: clinicopathology, prognosis, and potential regulatory pathways
Abstract
Background: Immediate early response 3 (IER3) is correlated to the prognosis of several cancers, but the precise mechanisms underlying the regulation by IER3 of the occurrence and development of hepatocellular carcinoma (HCC) remain unknown.
Methods: The expression level of IER3 was examined by using in-house immunohistochemistry (IHC), public gene chip, and public RNA-sequencing (RNA-seq). The standardized mean difference (SMD) was calculated to compare the expression levels of IER3 between HCC patients and controls. The summary receiver operating characteristics (sROC) was plotted to comprehensively understand the discriminatory capability of IER3 between HCC and non-HCC group. The Kaplan-Meier curves and the combined hazard ratios (HRs) were used to determine the prognostic value of IER3 in HCC. Moreover, differentially expressed genes (DEGs) and co-expression genes (CEGs) were used to explored the molecular mechanisms of IER3 underlying HCC. hTFtarget was used to predict the transcription factors (TFs) of IER3. The binding site of TFs and the IER3 promoter region was forecasted using the JASPAR website. The relevant ChIP-seq data were used to determine whether TF peaks were present in the IER3 transcription initiation.
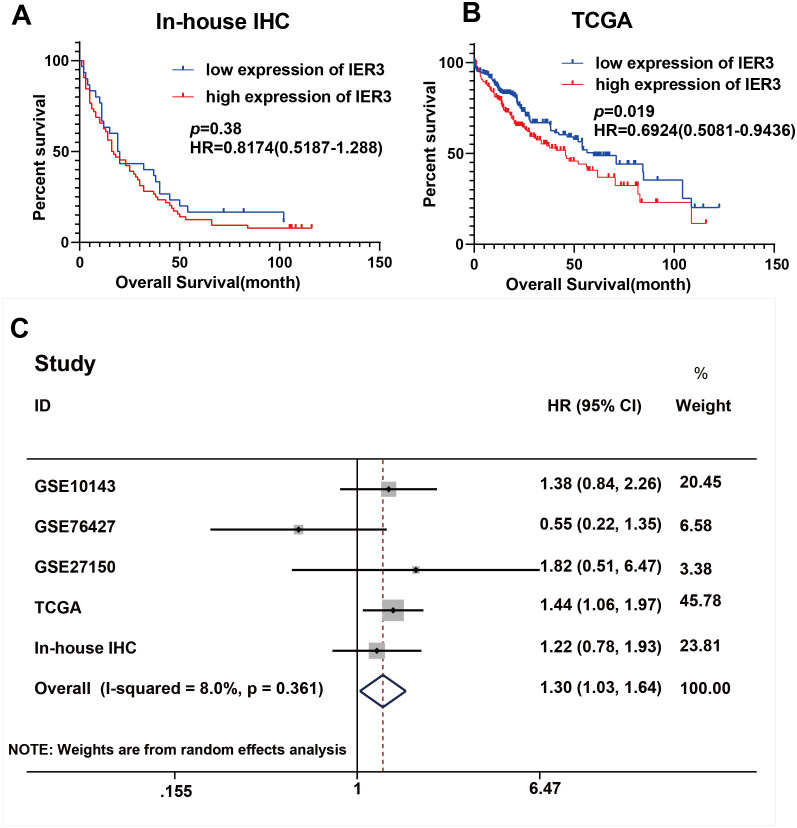
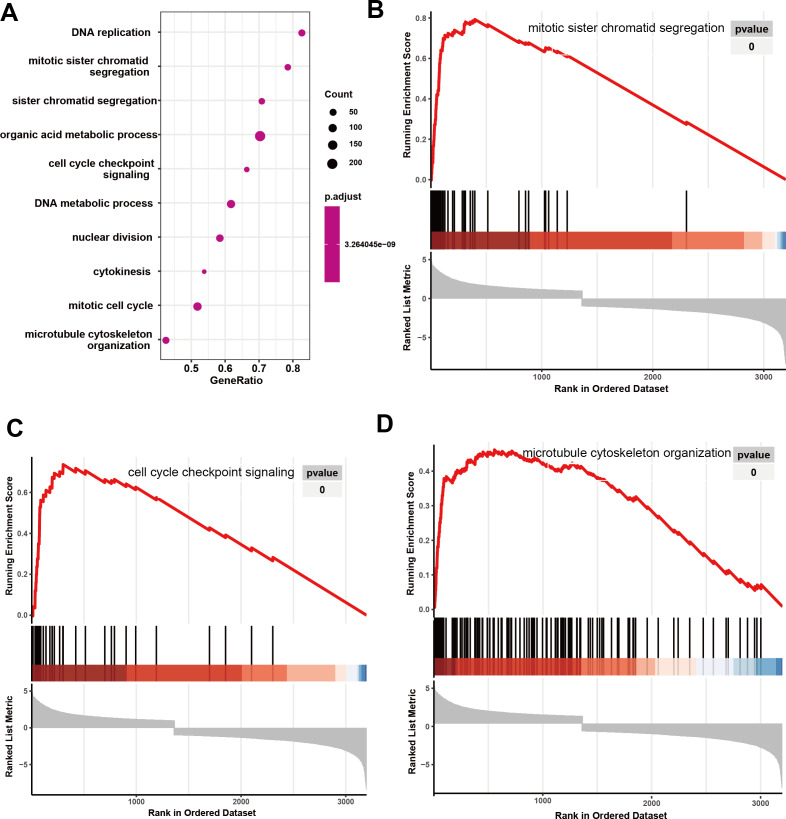
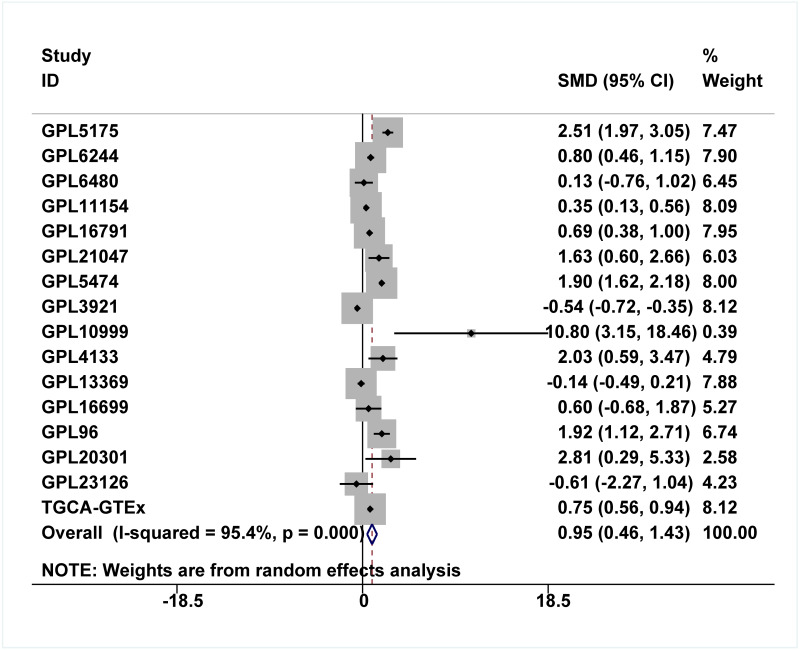
Results: A significantly increased expression of IER3 protein was found in HCC tissue relative to non-HCC tissue as detected by IHC (p < 0.001). Compared to 1,263 cases of non-HCC tissues, IER3 in 1483 cases of HCC tissues was upregulated (SMD = 0.42, 95% confidence interval [CI] [0.09-0.76]). The sROC showed that IER3 had a certain ability at differentiating HCC tissues (area under the curve (AUC) = 0.65, 95% CI [0.61-0.69]). Comprehensive analysis of the effect of IER3 on the prognosis of patients with HCC demonstrated that higher IER3 expression was associated with poor prognosis in HCC (HRs = 1.30, 95% CI [1.03-1.64]). Pathway enrichment analysis revealed that IER3-related genes were mostly enriched in the PI3K-Akt signaling pathway, cancer-related signaling pathways, the p53 signaling pathway, and other signaling pathways. Regulatory factor X5 (RFX5) was identified as a possible regulator of IER3-related TF.
Conclusion: IER3 may be a potential prognostic marker for HCC. The molecular mechanisms of IER3 in HCC warrant further study.
Keywords: Gene chip; Hazard ratios (HRs); Hepatocellular carcinoma (HCC); Immediate early response 3 (IER3); Immunohistochemistry; RNA-sequencing.
©2022 He et al.
Conflict of interest statement
Gang Chen is an Academic Editor for PeerJ.
Figures


Similar articles
-
A prognostic model for hepatocellular carcinoma based on apoptosis-related genes.World J Surg Oncol. 2021 Mar 12;19(1):70. doi: 10.1186/s12957-021-02175-9. World J Surg Oncol. 2021. PMID: 33712023 Free PMC article.
-
Clinical and prognostic value of chaperonin containing T-complex 1 subunit 3 in hepatocellular carcinoma: A Study based on microarray and RNA-sequencing with 4272 cases.Pathol Res Pract. 2019 Jan;215(1):177-194. doi: 10.1016/j.prp.2018.11.006. Epub 2018 Nov 10. Pathol Res Pract. 2019. PMID: 30473171
-
Regulatory factor X5 promotes hepatocellular carcinoma progression by transactivating tyrosine 3-monooxygenase/tryptophan 5-monooxygenase activation protein theta and suppressing apoptosis.Chin Med J (Engl). 2019 Jul 5;132(13):1572-1581. doi: 10.1097/CM9.0000000000000296. Chin Med J (Engl). 2019. PMID: 31188160 Free PMC article.
-
A novel prognostic models for identifying the risk of hepatocellular carcinoma based on epithelial-mesenchymal transition-associated genes.Bioengineered. 2020 Dec;11(1):1034-1046. doi: 10.1080/21655979.2020.1822715. Bioengineered. 2020. PMID: 32951492 Free PMC article.
-
Mining prognostic markers of Asian hepatocellular carcinoma patients based on the apoptosis-related genes.BMC Cancer. 2021 Feb 18;21(1):175. doi: 10.1186/s12885-021-07886-6. BMC Cancer. 2021. PMID: 33602168 Free PMC article.
Cited by
-
Explore the impact of hypoxia-related genes (HRGs) in Cutaneous melanoma.BMC Med Genomics. 2023 Jul 8;16(1):160. doi: 10.1186/s12920-023-01587-8. BMC Med Genomics. 2023. PMID: 37422626 Free PMC article.
-
RFX5 promotes the progression of triple-negative breast cancer through transcriptional activation of JAG1.Hum Cell. 2025 Apr 12;38(3):86. doi: 10.1007/s13577-025-01216-9. Hum Cell. 2025. PMID: 40220043
-
Knockdown of IER3 Promotes Osteogenic Differentiation of Human Mesenchymal Stem Cells.Biomedicines. 2025 Apr 12;13(4):947. doi: 10.3390/biomedicines13040947. Biomedicines. 2025. PMID: 40299640 Free PMC article.
-
Structural basis of nucleosome binding and destabilization by the extended DNA binding domain of RFX5.Nucleic Acids Res. 2025 Jul 19;53(14):gkaf734. doi: 10.1093/nar/gkaf734. Nucleic Acids Res. 2025. PMID: 40744500 Free PMC article.
-
Construction and validation of a novel IGFBP3-related signature to predict prognosis and therapeutic decision making for Hepatocellular Carcinoma.PeerJ. 2023 Jun 27;11:e15554. doi: 10.7717/peerj.15554. eCollection 2023. PeerJ. 2023. PMID: 37397026 Free PMC article.
References
-
- Aguirre-Gamboa R, Gomez-Rueda H, Martinez-Ledesma E, Martinez-Torteya A, Chacolla-Huaringa R, Rodriguez-Barrientos A, Tamez-Pena JG, Trevino V. SurvExpress: an online biomarker validation tool and database for cancer gene expression data using survival analysis. PLOS ONE. 2013;8(9):e74250. doi: 10.1371/journal.pone.0074250. - DOI - PMC - PubMed
Publication types
MeSH terms
Substances
LinkOut - more resources
Full Text Sources
Medical
Research Materials
Miscellaneous
