. 2022 Mar 14;156(10):104106.
doi: 10.1063/5.0082969.

Origin of thiocyanate spectral shifts in water and organic solvents

Affiliations

Origin of thiocyanate spectral shifts in water and organic solvents

Ruoqi Zhao et al. J Chem Phys. .

Abstract

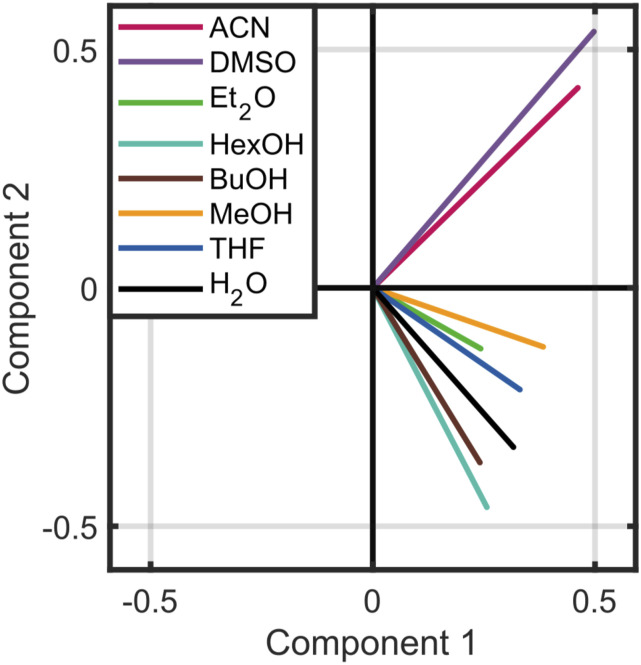
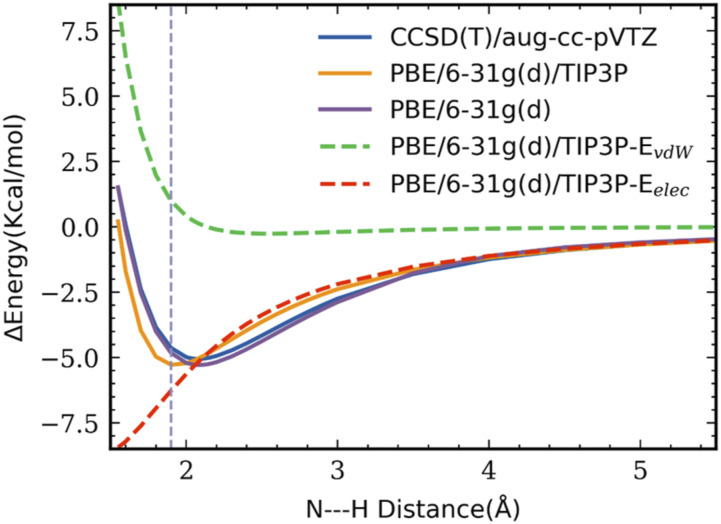
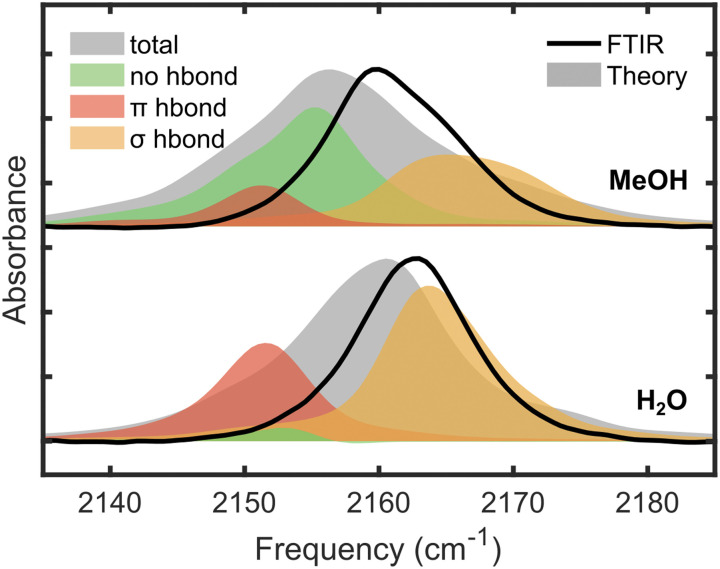
Vibrational spectroscopy is a useful technique for probing chemical environments. The development of models that can reproduce the spectra of nitriles and azides is valuable because these probes are uniquely suited for investigating complex systems. Empirical vibrational spectroscopic maps are commonly employed to obtain the instantaneous vibrational frequencies during molecular dynamics simulations but often fail to adequately describe the behavior of these probes, especially in its transferability to a diverse range of environments. In this paper, we demonstrate several reasons for the difficulty in constructing a general-purpose vibrational map for methyl thiocyanate (MeSCN), a model for cyanylated biological probes. In particular, we found that electrostatics alone are not a sufficient metric to categorize the environments of different solvents, and the dominant features in intermolecular interactions in the energy landscape vary from solvent to solvent. Consequently, common vibrational mapping schemes do not cover all essential interaction terms adequately, especially in the treatment of van der Waals interactions. Quantum vibrational perturbation (QVP) theory, along with a combined quantum mechanical and molecular mechanical potential for solute-solvent interactions, is an alternative and efficient modeling technique, which is compared in this paper, to yield spectroscopic results in good agreement with experimental FTIR. QVP has been used to analyze the computational data, revealing the shortcomings of the vibrational maps for MeSCN in different solvents. The results indicate that insights from QVP analysis can be used to enhance the transferability of vibrational maps in future studies.


Figures

FIG. 1.
FIG. 1.
Schematic illustration of the multisite model to represent the electrostatic potential around methyl thiocyanate for the vibrational map. Groups 6 and 7 indicate a set of eight equally spaced points around nitrogen and the nitrile carbon, respectively.
FIG. 2.
FIG. 2.
Optimized geometries and interaction energies of MeSCN–H2O and MeSCN–MeOH complexes. CCSD(T)/aug-cc-pVTZ//MP2/aug-cc-pVTZ values are given along with the PBE/6-31G(d)/MM results in parentheses. (a) and (c) represent the linear type σ-hydrogen bonding interactions and (b) and (d) feature the π-type polarization. Distances are given in angstroms, angles in degrees, and energies in kcal/mol. (a) ΔE = −5.05(−5.29). (b) ΔE = −5.10(−5.49). (c) ΔE = −5.37(−5.64). (d) ΔE = −5.70(−5.75).
FIG. 3.
FIG. 3.
The mean distribution of charge around MeSCN in eight solvents. All solvents and contour lines use the same scale.
FIG. 4.
FIG. 4.
Electrostatic environments of the eight solvents in Fig. 2 projected along the first two principal components. Components 1 and 2 of the PCA correspond to 71.7% and 14.5% of the variance of the data, respectively. Component 3 (not plotted) corresponds to an additional 7.7% of the total variance. The scores of the coordinates in the principal components are plotted in Fig. S2 of the supplementary material.
FIG. 5.
FIG. 5.
Area-normalized FTIR spectra of MeSCN in methanol, butanol, and hexanol (solid lines). Filled areas represent spectra generated from MD simulations and individual vibrational maps.
FIG. 6.
FIG. 6.
Plot of the experimental and calculated spectra resulting from case 2, a single vibrational map fit to all spectra represented in Table I simultaneously. Solid lines are experimental spectra and filled areas are calculated infrared spectra. These spectra are area-normalized.
FIG. 7.
FIG. 7.
Amplitude-normalized IR lineshapes of the CN stretch mode of MeSCN in different solvents. The experimental spectra are given in (a) along with the computed lineshape functions in shaded areas, obtained using the quantum vibration perturbation (QVP) method. (b) displays the computed lineshape functions without van der Waals forces between the solute MeSCN and solvents. (c) gives the Fourier transform lineshapes from the dipole–dipole autocorrelation functions. Note that the intrinsic vibrational frequency is underestimated by −7.7 cm−1 using the PBE/6-31G(d) method relative to the experimental value of MeSCN, which is systematically reflected in all solvents in the computed values in all results. If this systematic shift is corrected (see Fig. S5 of the supplementary material), the computed and experimental spectra are well-superimposed in (a). The spectra in MeOH are depicted, showing that the right-hand side of the line-shape is broader than that on the left-hand side.
FIG. 8.
FIG. 8.
Rigid potential energy scan along the bond vector between nitrogen of MeSCN and the donor hydrogen of water.
FIG. 9.
FIG. 9.
For this figure, the hydrogen bond is defined when the distance between N(MeSCN) and H(H2O) is less than 2.5 Å. For the σ-type, the hydrogen bond angle (∠N⋯HO) is over 130°. All other angles are categorized as π-type hydrogen bonds. Calculated spectra are shifted positively by 7.7 cm−1 to better overlay with experimental FTIR.

Similar articles

References

    1. Chabal Y. J., Surf. Sci. Rep. 8, 211 (1988).10.1016/0167-5729(88)90011-8 - DOI
    1. L. G. Wade, Jr., Organic Chemistry, 8th ed. (Pearson Education, Inc., 2016).
    1. Ramos S. and Thielges M. C., J. Phys. Chem. B 123, 3551 (2019).10.1021/acs.jpcb.9b00969 - DOI - PMC - PubMed
    1. Buhrke D., Oppelt K. T., Heckmeier P. J., Fernández-Terán R., and Hamm P., J. Chem. Phys. 153, 245101 (2020).10.1063/5.0033107 - DOI - PubMed
    1. Park J. Y., Mondal S., Kwon H.-J., Sahu P. K., Han H., Kwak K., and Cho M., J. Chem. Phys. 153, 164309 (2020).10.1063/5.0025289 - DOI - PubMed