. 2022 Mar 15;20(1):134.
doi: 10.1186/s12951-022-01346-4.

Early diagnosis of breast cancer lung metastasis by nanoprobe-based luminescence imaging of the pre-metastatic niche

Affiliations

Early diagnosis of breast cancer lung metastasis by nanoprobe-based luminescence imaging of the pre-metastatic niche

Hanwen Zheng et al. J Nanobiotechnology. .

Abstract

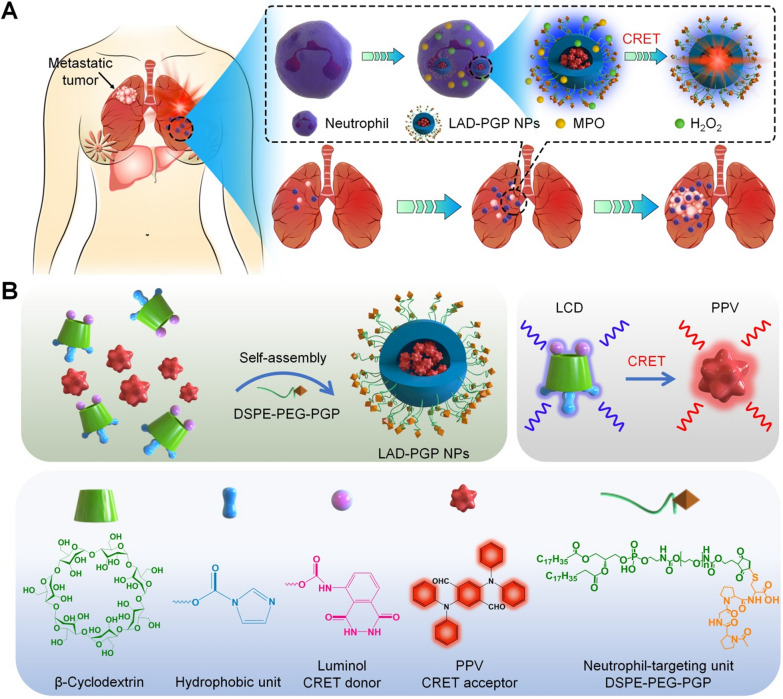
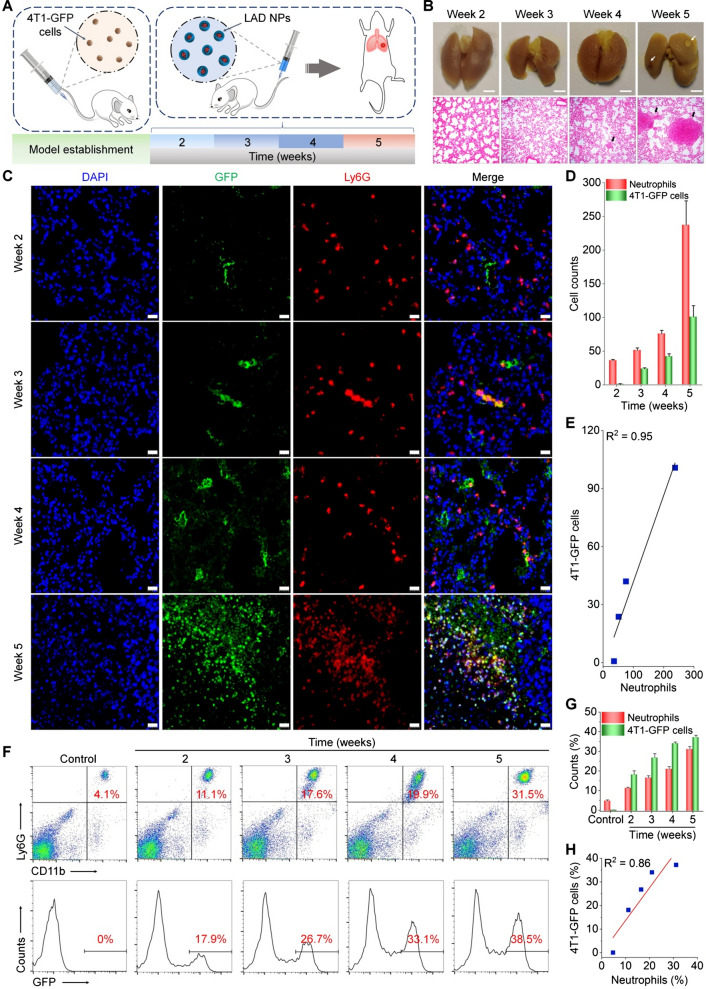
Background: Early detection of breast cancer lung metastasis remains highly challenging, due to few metastatic cancer cells at an early stage. Herein we propose a new strategy for early diagnosis of lung metastasis of breast cancer by luminescence imaging of pulmonary neutrophil infiltration via self-illuminating nanoprobes.

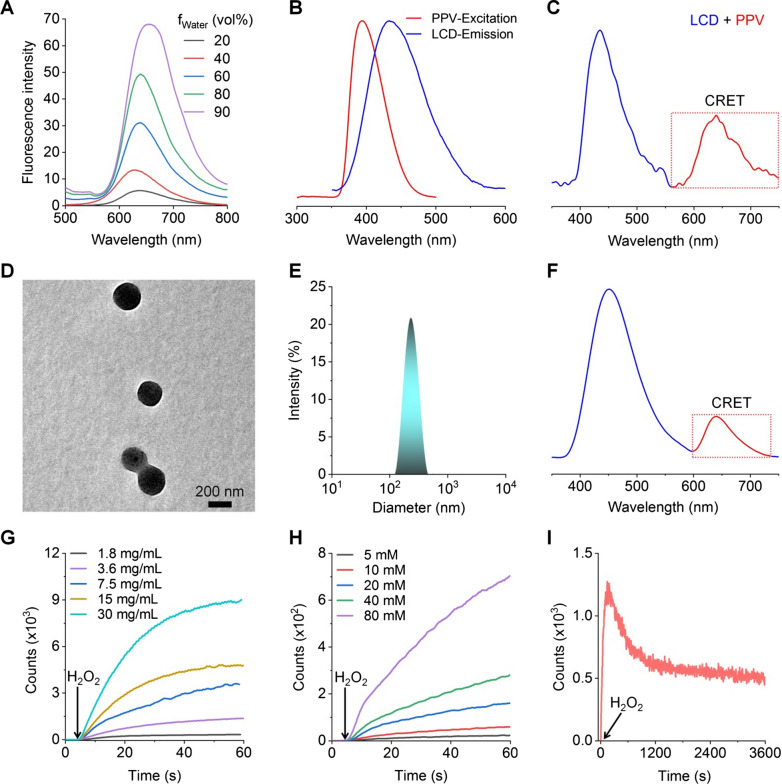
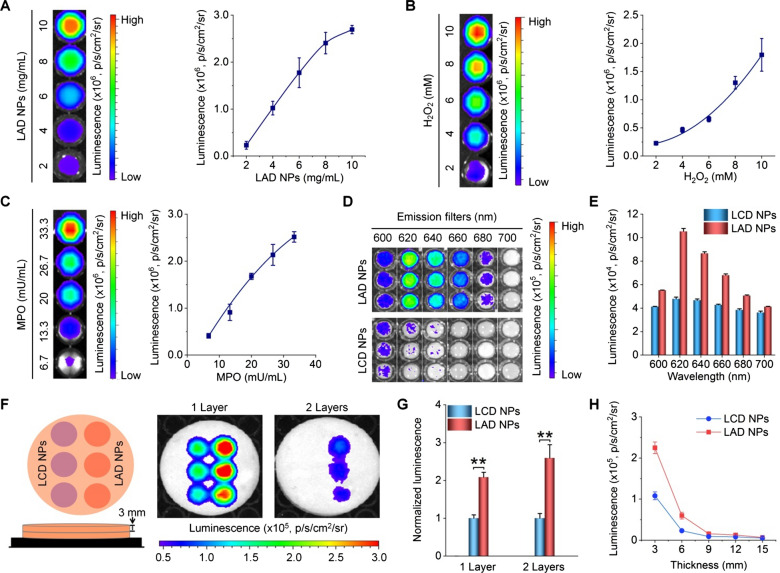
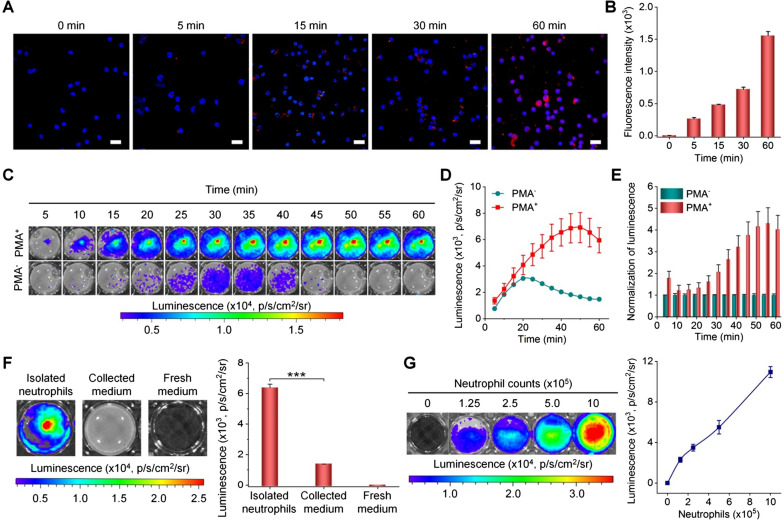
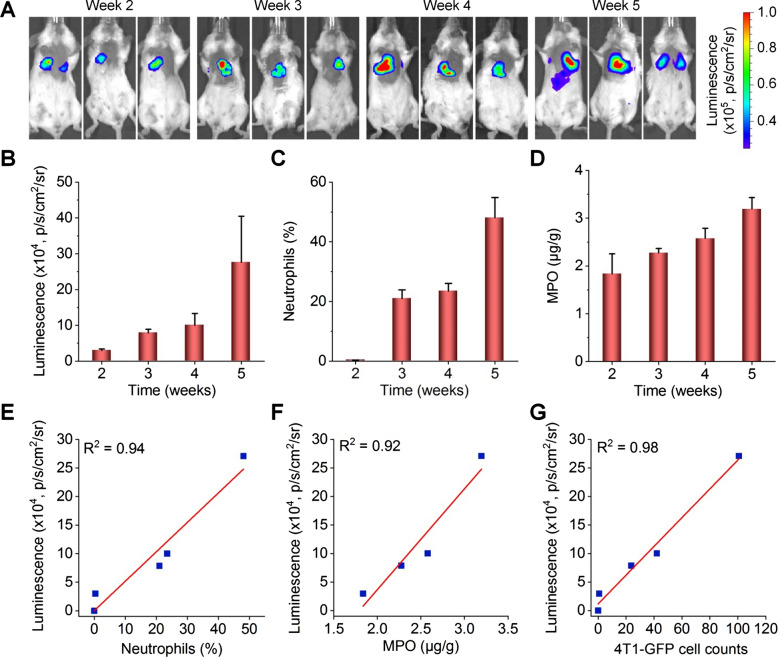
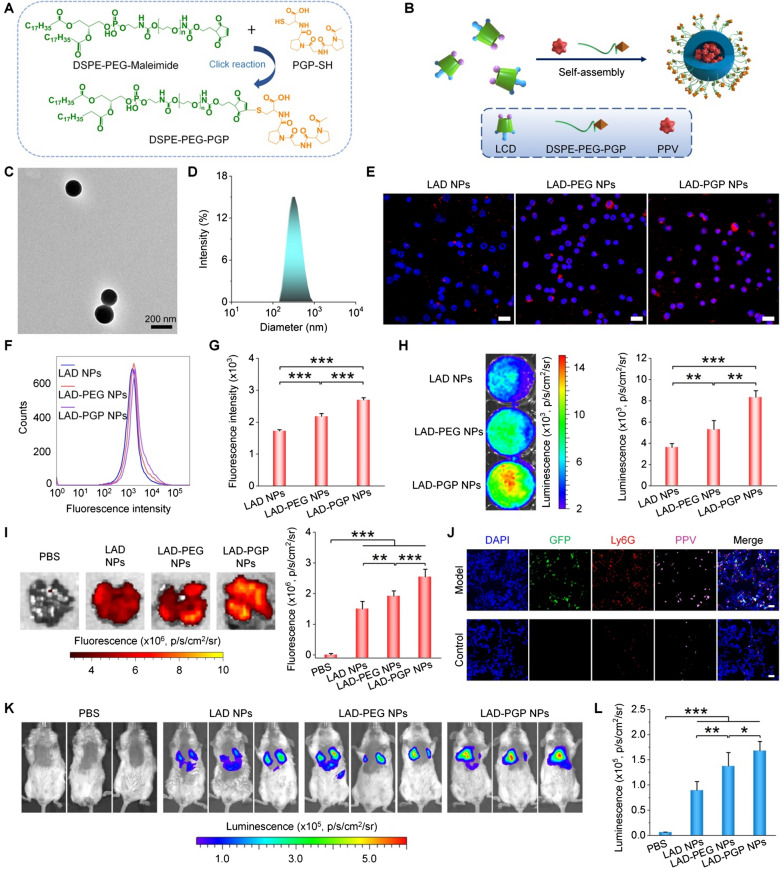
Methods: Luminescent nanoparticles (LAD NPs) were engineered using a biocompatible, neutrophil-responsive self-illuminating cyclodextrin material and an aggregation-induced emission agent. The chemiluminescence resonance energy transfer (CRET) effect and luminescence properties of LAD NPs were fully characterized. Using mouse peritoneal neutrophils, in vitro luminescence properties of LAD NPs were thoroughly examined. In vivo luminescence imaging and correlation analyses were performed in mice inoculated with 4T1 cancer cells. Moreover, an active targeting nanoprobe was developed by surface decoration of LAD NPs with a neutrophil-targeting peptide, which was also systemically evaluated by in vitro and in vivo studies.

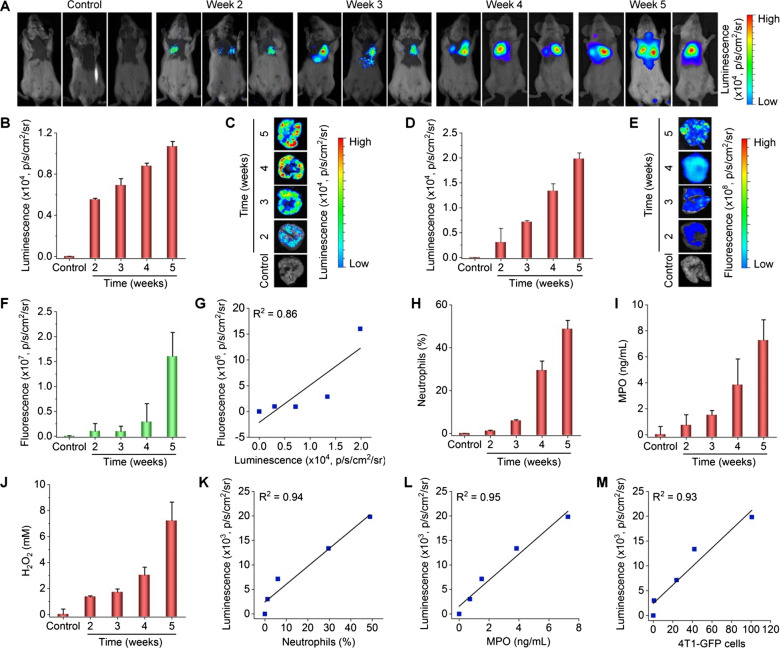
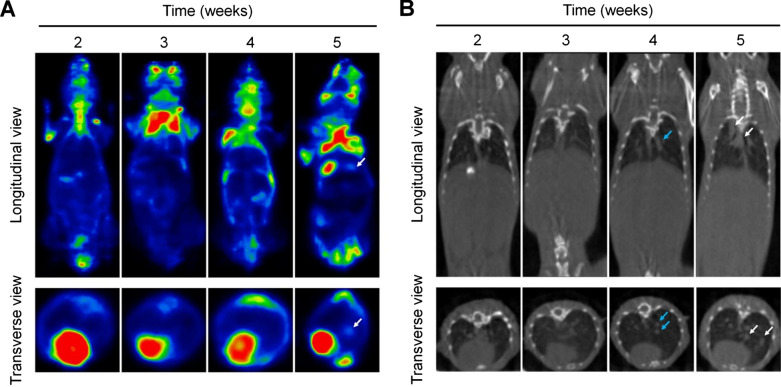
Results: LAD NPs can generate long-wavelength and persistent luminescence due to the CRET effect. In a mouse model of 4T1 breast cancer lung metastasis, we found desirable correlation between neutrophils and tumor cells in the lungs, demonstrating the effectiveness of early imaging of the pre-metastatic niche by the newly developed LAD NPs. The active targeting nanoprobe showed further enhanced luminescence imaging capability for early detection of pulmonary metastasis. Notably, the targeting nanoprobe-based luminescence imaging strategy remarkably outperformed PET/CT imaging modalities in the examined mouse model. Also, preliminary tests demonstrated good safety of LAD NPs.

Conclusions: The neutrophil-targeting imaging strategy based on newly developed luminescence nanoparticles can serve as a promising modality for early diagnosis of lung metastasis of breast cancers.

Keywords: Breast cancer; Luminescence imaging; Lung metastasis; Neutrophils; Targeting nanoprobe.


Conflict of interest statement

The authors declare no competing interests.

Figures

Fig. 1
Fig. 1
Schematic illustration of early imaging of pulmonary metastasis of breast cancer by a self-luminescence nanoprobe. A Neutrophil-dependent luminescence imaging of lung micrometastasis of breast cancer based on MPO/H2O2-mediated chemiluminescence resonance energy transfer (CRET) using a self-illuminating and neutrophil-targeting nanoprobe (LAD-PGP NPs). B A sketch shows engineering of LAD-PGP NPs composed of a self-luminescent material of luminol-conjugated β-cyclodextrin (LCD, a CRET donor), an aggregation-induced emission compound (PPV, a CRET acceptor), and a neutrophil-targeting unit DSPE-PEG-PGP
Fig. 2
Fig. 2
Characterization of luminescent properties of LCD and LCD/PPV NPs. A Fluorescence spectra of PPV in a solvent mixture of H2O/THF with different proportions of water (fWater) at an excitation wavelength (λex) of 425 nm. B The emission spectrum of LCD in the presence of hypochlorite (ClO) and the excitation spectrum of PPV (λem = 650 nm). C The luminescence spectrum of LCD/PPV mixture in DMF/H2O at 100 mM ClO. D, E TEM image (D) and size distribution (E) of LAD NPs. F The luminescence spectrum of LAD NPs at 100 mM ClO. G Time-dependent luminescence signals of various concentrations of LAD NPs upon incubation with 10 mM H2O2. H Time-lapse luminescence curves of 10 mg/mL LAD NPs upon incubation with various levels of H2O2. I A typical time-resolved luminescence curve showing sustained luminescence of LAD NPs in presence of H2O2. The photon counts were acquired immediately after 10 mg/mL LAD NPs were incubated with 80 mM H2O2
Fig. 3
Fig. 3
Luminescent properties and tissue penetration ability of LAD NPs. A Dose-dependent luminescent intensities of LAD NPs at 80 mM H2O2. B Effects of H2O2 levels on luminescent signals of 20 mg/mL LAD NPs. C MPO-dependent luminescence profiles of 20 mg/mL LAD NPs at 5 mM H2O2. In all cases, the left panels show luminescence images, while the right panels indicate quantitative data. D, E Typical luminescent images (D) and corresponding quantitative data of the same concentration of LAD NPs and LCD NPs at 80 mM H2O2 in the presence of emission filters of different wavelengths. F, G Luminescence images (F) and quantitative results (G) of the same concentration of LAD NPs and LCD NPs (at 15 mg/mL) in a black 96-well plate covered by 1 or 2 layers of 3-mm pork ham slices upon incubation with 80 mM H2O2. H Quantified luminescence intensities of LCD NPs or LAD NPs at 80 mM H2O2 and in the presence of different thicknesses of ham slices. Data are presented means ± SD (n = 3). **P < 0.01
Fig. 4
Fig. 4
In vitro luminescence imaging of neutrophils with LAD NPs. A, B Confocal microscopy images (A) and flow cytometric analysis (B) showing time-dependent uptake of LAD NPs in peritoneal neutrophils. Nuclei were stained with DAPI. Scale bars, 20 μm. C, D Typical time-resolved images (C) and quantitative analysis (D) of luminescence signals in neutrophils treated with LAD NPs. Neutrophils (5 × 105 cells per well) with (PMA+) or without (PMA) stimulation with phorbol 12-myristate 13-acetate for 1 h were incubated with 3 mg/mL LAD NPs, followed by imaging at predetermined time points. E Normalized luminescence intensities in neutrophils. F Quantification of intracellular or extracellular luminescence intensities after neutrophils were incubated with 3 mg/mL LAD NPs for 1 h. G Luminescence intensities of different numbers of neutrophils immediately after incubation with 3 mg/mL LAD NPs. In both cases, the left panels show representative luminescence images, while the right panels denote quantitative data. Data are expressed as means ± SD (n = 3). ***P < 0.001
Fig. 5
Fig. 5
Correlation analyses of neutrophil and tumor cell counts in the lungs of mice subjected to intravenous inoculation with 4T1-GFP tumor cells. A Schematic illustration of experimental regimens. B Digital photos (upper) and microscopic images of H&E-stained histological sections of lungs (lower) at different time points after intravenous inoculation of 4T1-GFP tumor cells. Scale bars, 2 mm. Both white and black arrows indicate metastatic pulmonary nodules. C Immunofluorescence analyses of GFP-positive tumor cells (green) and Ly6G-positive neutrophils (red) in lung tissues of mice. Scale bars, 20 μm. D Quantitative analysis of the counts of 4T1-GFP tumor cells and neutrophils. E Correlation analysis of tumor cell and neutrophil counts in the lungs. F Representative flow cytometric profiles showing neutrophils (upper) and 4T1-GFP tumor cells (lower) in lung tissues. G, H Quantified cell populations of neutrophils and tumor cells by flow cytometry (G) and their correlation analysis (H). Data are expressed as means ± SD (D, n = 4; G, n = 5)
Fig. 6
Fig. 6
Luminescence imaging of pulmonary micrometastasis in mice with intravenously inoculated 4T1-GFP tumor cells by LAD NPs. A In vivo luminescence images showing pulmonary metastasis in mice. At various time points after i.v. inoculation of 4T1-GFP cells in mice, 3 mg LAD NPs was administered in each mouse by i.v. injection, immediately followed by luminescence imaging. B Quantitative analysis of pulmonary luminescence intensities in mice at various time points. C Percentages of neutrophils in bronchoalveolar lavage fluid (BALF) of mice after i.v. inoculation of 4T1-GFP cells for different time periods. D Quantified MPO levels in the lungs. EG Correlation analyses of the luminescence intensity and the number of neutrophils in BALF (E), the MPO level in the lungs (F), or the 4T1-GFP cell counts in the lungs (G). Data are expressed as means ± SD (B, n = 3; C, n = 5; D, n = 6)
Fig. 7
Fig. 7
Engineering of a neutrophil-targeting self-luminescent nanoprobe for imaging of pulmonary micrometastasis in mice. A A scheme illustrating the synthesis of PGP peptide-conjugated DSPE-PEG (DSPE-PEG-PGP) capable of targeting neutrophils by binding to the CXCR2 receptor. B A sketch showing preparation of the neutrophil-targeting nanoprobe (LAD-PGP NPs). C, D A typical TEM image (C) and size distribution (D) of LAD-PGP NPs. E Fluorescence microscopic images of neutrophils at 1 h after incubation with the same dose of LAD NPs, LAD-PEG NPs, or LAD-PGP NPs. Nuclei were labeled with DAPI (blue). Scale bars, 20 μm. F, G Typical flow cytometry profiles (F) and quantitative data (G) of fluorescence intensities in neutrophils after 1 h of incubation with different NPs. H Luminescence images (left) and quantitative analysis (right) of PMA-stimulated neutrophils after treatment with different NPs. I Ex vivo fluorescence images (left) and quantified intensities (right) showing the accumulation of three NPs in lung tissues of mice at week 3 after i.v. inoculation of 4T1-GFP cells. Diseased mice injected with PBS served as a control. J Immunofluorescence images of lung tissue sections of healthy mice and diseased mice at week 3 after inoculation of 4T1-GFP cells. Lung tissues were isolated for analyses at 12 h after i.v. injection of 3 mg LAD-PGP NPs in each mouse. K, L Comparison of in vivo luminescence intensities in lung tissues after i.v. injection of 3 mg different nanoprobes in mice at week 3 after inoculation of 4T1-GFP cells. K Representative in vivo luminescence images. L Quantitative analysis of luminescence intensities. Data are expressed as means ± SD (G, I, L, n = 4; H, n = 3). *P < 0.05, **P < 0.01, ***P < 0.001
Fig. 8
Fig. 8
Luminescence imaging of early lung micrometastasis using LAD-PGP NPs in mice with inoculated 4T1-GFP cells. A, B Luminescence images (A) and quantitative analysis of luminescence intensities (A) of mice at different time periods after inoculation of 4T1-GFP cells. Images were acquired at 5 min after i.v. injection of 3 mg LAD-PGP NPs in each mouse. C, D Ex vivo luminescence images (C) and quantified intensities (D) for lung tissues isolated at different time points. E, F Ex vivo images (E) and quantitative analysis (F) of fluorescence intensities in isolated lung tissues. G Analysis of the correlation between GFP fluorescence and LAD-PGP NPs luminescence intensities in lung tissues. HJ Quantified neutrophil counts (H), MPO levels (I), and H2O2 concentrations (J) in BALF from mice at different time points after inoculation with 4T1-GFP cells. KM Correlations between in vivo luminescence intensities of LAD-PGP NPs and neutrophil counts (K), MPO levels (L), or tumor cell counts (M). Data are expressed as mean ± SD (B, D, F, n = 3; HJ, n = 4)
Fig. 9
Fig. 9
PET and CT imaging of lung metastasis in mice. A, B Representative PET (A) and CT (B) images of mice at different time periods after inoculation of 4T1-GFP cells. Metastatic pulmonary nodules are indicated with white arrows, while blue arrows indicate lung consolidation and enlarged lymph nodes. For PET imaging, 18F-FDG (200–300 µCi in each mouse) was used as a radiotracer, with the exposure time of 20 min

Similar articles

Cited by

References

    1. Duggan C, Trapani D, Ilbawi AM, Fidarova E, Laversanne M, Curigliano G, et al. National health system characteristics, breast cancer stage at diagnosis, and breast cancer mortality: a population-based analysis. Lancet Oncol. 2021;22:1632–42. - PubMed
    1. DeSantis CE, Ma J, Gaudet MM, Newman LA, Miller KD, Goding Sauer A, et al. Breast cancer statistics, 2019. Cancer J Clin. 2019;69:438–51. - PubMed
    1. Harbeck N, Penault-Llorca F, Cortes J, Gnant M, Houssami N, Poortmans P, et al. Breast cancer. Nat Rev Dis Primers. 2019;5:66. - PubMed
    1. Peinado H, Zhang H, Matei IR, Costa-Silva B, Hoshino A, Rodrigues G, et al. Pre-metastatic niches: organ-specific homes for metastases. Nat Rev Cancer. 2017;17:302–17. - PubMed
    1. Wculek SK, Malanchi I. Neutrophils support lung colonization of metastasis-initiating breast cancer cells. Nature. 2015;528:413–7. - PMC - PubMed