. 2022 Mar 15;20(1):31.
doi: 10.1186/s12964-021-00807-x.

CYP1B1-catalyzed 4-OHE2 promotes the castration resistance of prostate cancer stem cells by estrogen receptor α-mediated IL6 activation

Affiliations

CYP1B1-catalyzed 4-OHE2 promotes the castration resistance of prostate cancer stem cells by estrogen receptor α-mediated IL6 activation

Qimei Lin et al. Cell Commun Signal. .

Abstract

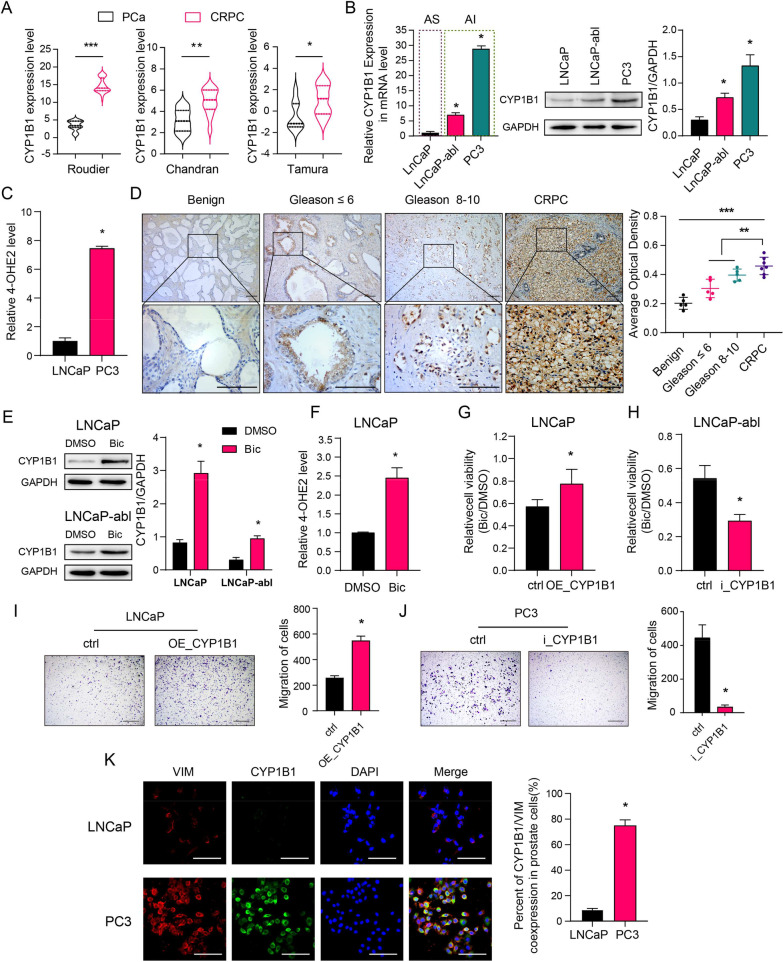
Background: Resistance to androgen deprivation therapy remains a major challenge for the clinical treatment of patients with castration-resistant prostate cancer (CRPC). CYP1B1, a critical enzyme that catalyzes the conversion of estradiol to 4-Hydroxy-17β-estradiol (4-OHE2), has been reported to promote the development and progression of hormone-related cancer, but its role in CRPC is unclear.

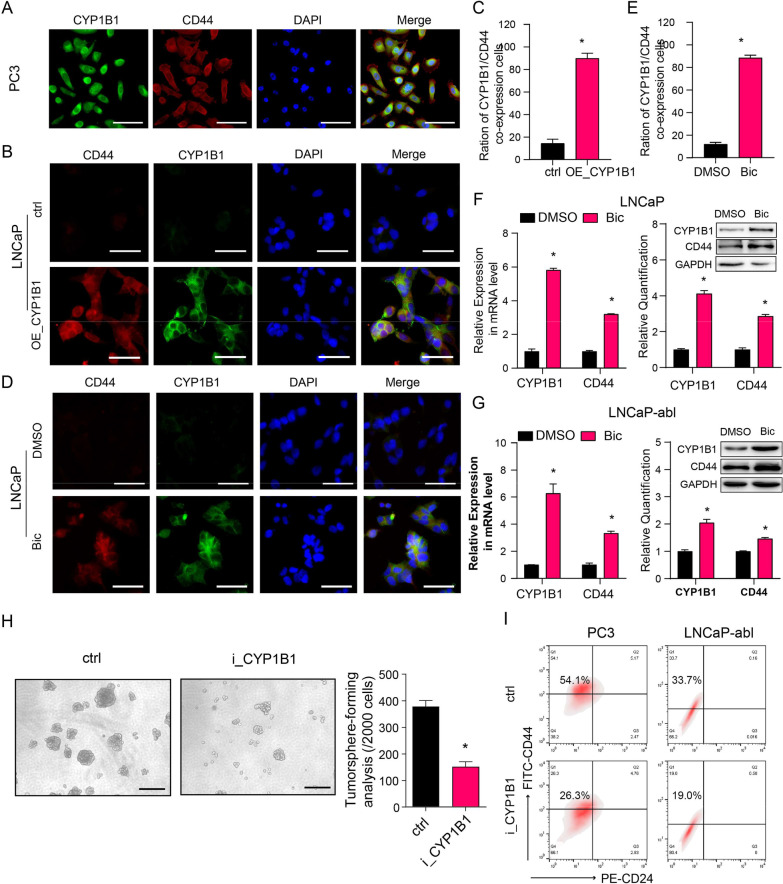
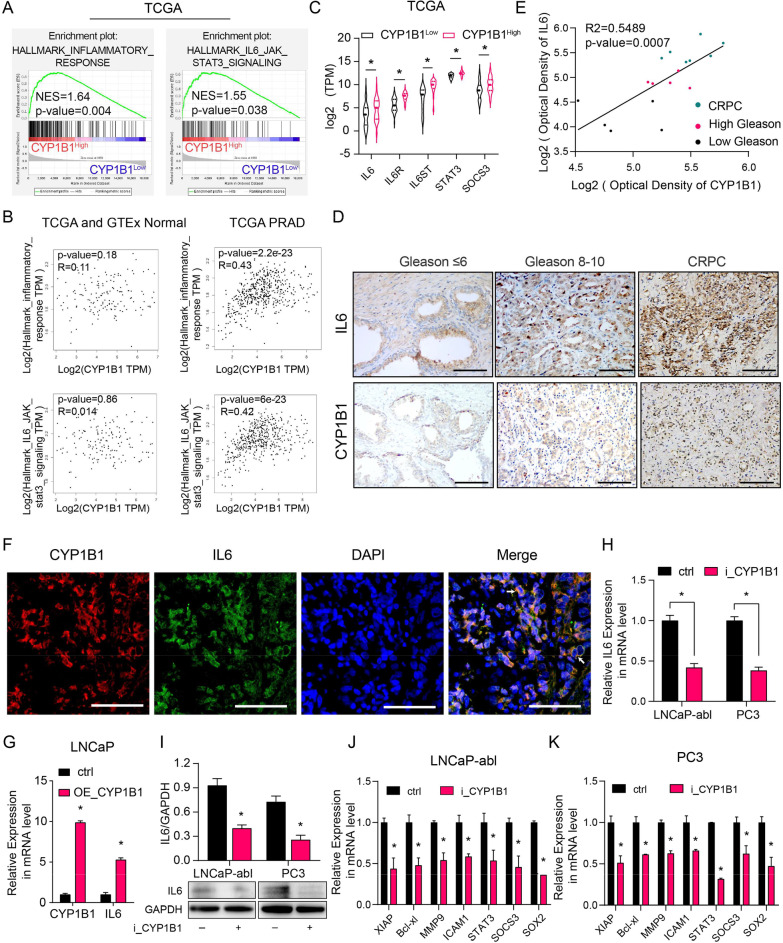
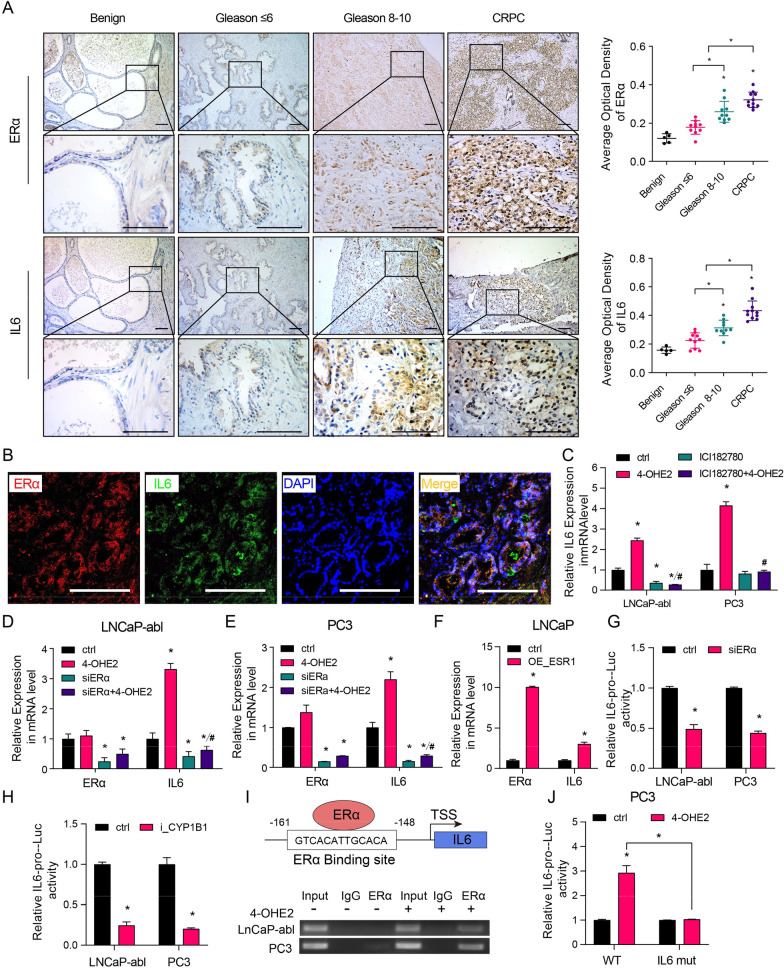
Methods: To explore the underlying mechanism which CYP1B1 promotes the prostate cancer stem cells (PCSCs) characteristics, bioinformatics analyses of human clinical prostate cancer (PCa) datasets were performed. CYP1B1, IL6, and estrogen receptor-α (ERα) expression levels were evaluated in PCa and CRPC tissues via immunohistochemistry. The high-performance liquid chromatography-mass spectrometry assay was carried out to examine intracellular 4-OHE2 levels. Serum-free suspension culture and flow cytometry assays were performed to evaluate PCSCs. Chromatin immunoprecipitation was used to validate that 4-OHE2 recruited ERα to the IL6 promoter.

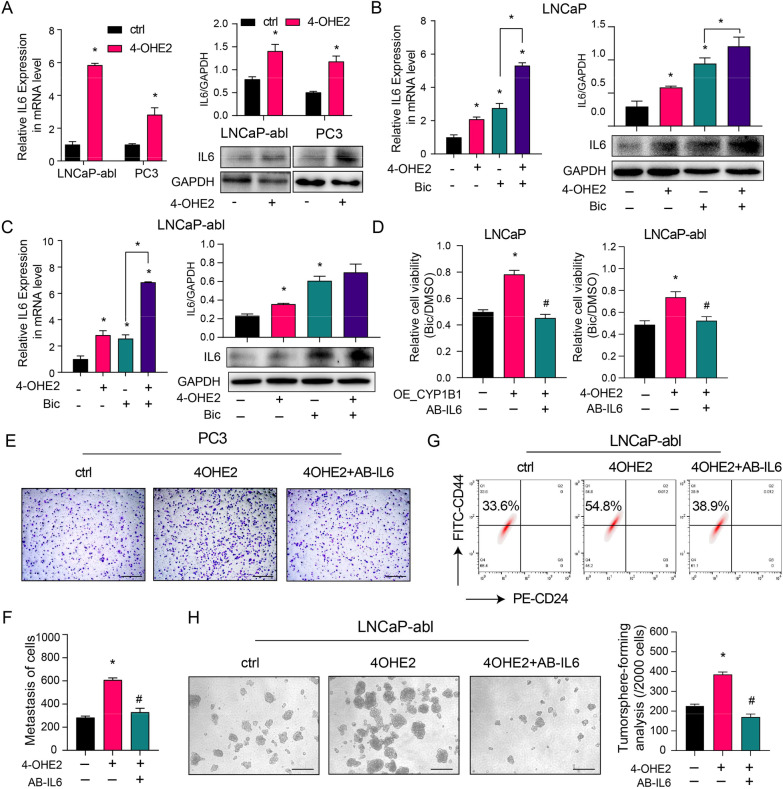
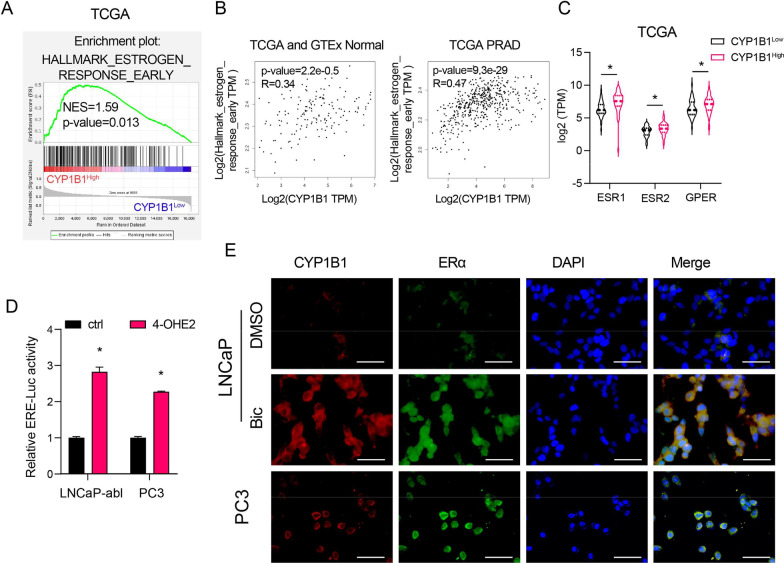
Results: CYP1B1 expression was significantly increased in CRPC tissues and androgen-independent PCa cell lines. CYP1B1+ PCa cells were significantly enriched in bicalutamide-treated LNCaP cells, and CYP1B1 knockdown reduced the cell viability under bicalutamide treatment. In addition, CYP1B1 knockdown decreased the intracellular 4-OHE2 concentration, accompanied by reduced PCSC characteristics. In PCa cells, 4-OHE2 stimulated ERα transcriptional activity and upregulated the expression of IL6 and downstream genes of the IL6-STAT3 signaling. 4-OHE2 increased cell viability under bicalutamide treatment and promoted PCSC characteristics, while IL6 neutralizing antibody reversed these effects. Mechanistically, siERα and the ER antagonist ICI182780 significantly attenuated 4-OHE2-induced IL6 expression, and 4-OHE2 promoted the binding of ERα to the estrogen response element of the IL6 promoter.

Conclusions: Our findings indicate that CYP1B1-catalyzed 4-OHE2 enhanced PCSC characteristics and attenuated bicalutamide sensitivity by ERα-mediated the IL6-STAT3 pathway activation. Our study further emphasizes the role of CYP1B1 in castration resistance and illustrates a novel mechanism of CRPC development. Video Abstract.

Keywords: 4-OHE2; CYP1B1; Castration-resistant prostate cancer; ERα; IL6-STAT3 pathway; PCSC.


Conflict of interest statement

The authors declare that they have no competing interests.

Figures

Fig. 1
Fig. 1
CYP1B1 is highly expressed and involved in the regulation of bicalutamide sensitivity in CRPC. A Scatter dot plots present CYP1B1 mRNA expression in prostate tumor and CRPC tissues from 3 publicly available datasets (Roudier, n(PCa) = 11, n(CRPC) = 45; Chandran, n(PCa) = 10, n(CRPC) = 13; Tamura, n(PCa) = 8, n(CRPC) = 17) (t-test). B Basal mRNA and protein levels of CYP1B1 in different PCa cell lines (one-way ANOVA). C The concentration of intracellular 4-OHE2 in LNCaP and PC3 cells (t-test). D Left: Representative IHC staining of CYP1B1 protein in benign prostate tissues, primary PCa and CRPC tissues. Right: Quantification of the average optical density for CYP1B1 IHC staining (one-way ANOVA). Scale bar = 100 μm. E–F LNCaP and LNCaP-abl cells were treated with 20 μM bicalutamide for 3 days. CYP1B1 expression was examined by western blotting (E), and intracellular 4-OHE2 concentration was examined by HPLC–MS (F). G, The cell viability of CYP1B1-overexpressing and control LNCaP cells treated with bicalutamide was determined by MTT assay (t-test). H The cell viability of CYP1B1 knockdown and control LNCaP-abl cells treated with bicalutamide was determined by MTT assay (t-test). I Left: Cell invasion capability was assayed in CYP1B1-overexpressing or control LNCaP cells after bicalutamide treatment. Right: Quantitative result of the left panel(t-test). Scale bar = 500 μm. J Left: Cell invasion capability was assayed in CYP1B1 knockdown or control PC3 cells (t-test). Right: Quantitative result of the left panel. Scale bar = 500 μm. K Left: Representative IF staining of VIM (red) and CYP1B1 (green) in LNCaP and PC3 cells. Right: Quantitative result of the left panel. Scale bar = 100 μm. AS, androgen sensitivity; AI, androgen insensitivity; Bic, bicalutamide; VIM, vimentin. All values represent the means ± SD from three independent experiments. *p < 0.05, **p < 0.01, **p < 0.001
Fig. 2
Fig. 2
CYP1B1 is critical to maintaining the PCSC subpopulation in PCa. A Representative IF staining of CYP1B1 (green) and CD44 (red) in PC3 cells. Scale bar = 50 μm. B–E Colocalization of CD44 and CYP1B1 (t-test). B, D Representative IF staining of CD44 (red) and CYP1B1 (green) in LNCaP cells after the indicated treatment. Scale bar = 50 μm. D Quantification of (B). E Quantification of (C). F, G mRNA (left) and protein (right) levels of CYP1B1 and CD44 in bicalutamide- or DMSO-treated PCa cells (t-test). H Representative image and quantification of tumorsphere formation in CYP1B1 knockdown or control LNCaP-abl cells (t-test). Scale bar = 100 μm. I A representative flow cytometric analysis of the proportion of PCSCs (CD44+/CD24) in CYP1B1 knockdown or control PCa cells. All values represent the means ± SD from three independent experiments. *p < 0.05
Fig. 3
Fig. 3
CYP1B1 regulates the IL6-STAT3 signaling by inducing IL6 expression. A Gene signatures associated with the inflammatory response and IL6-jak-stat3 signaling were analyzed by GSEA in CYP1B1High and CYP1B1low PRAD samples from the TCGA. B Correlation analysis of CYP1B1, IL6-JAK-STAT3 signaling gene set and inflammatory response gene set in normal prostate and PRAD patients from TCGA (TCGA and GTEx normal, n = 152; PRAD, n = 498). C, Mean mRNA levels of IL6, IL6R, IL6ST, STAT3 and SOCS3 for CYP1B1High samples versus CYP1B1low samples in the PRAD dataset from TCGA. D–E Representative images of CYP1B1 and IL6 expression measured by IHC in PCa samples with low and high Gleason scores and in CRPC tissues (D). Scale bar = 100 μm. E The average optical densities of CYP1B1 and IL6 were calculated, followed by correlation analysis of CYP1B1 and IL6 expression in primary PCa and CRPC tissues. F IF staining of CYP1B1 (red) and IL6 (green) in PCa tissue. Scale bar = 50 μm. G–I IL6 expression in CYP1B1-overexpressing LNCaP cells (G) and CYP1B1 knockdown PCa cells (H, I) (t-test). J, K Relative expression of the indicated IL6-STAT3 pathway downstream genes in CYP1B1 knockdown LNCaP-abl (J) and PC3 (K) cells by qRT-PCR analysis (t-test). All values represent the means ± SD from three independent experiments. *p < 0.05
Fig. 4
Fig. 4
4-OHE2 promotes PCSC characteristics by upregulating IL6 expression. A The mRNA (left) and protein (right) levels of IL6 in LNCaP-abl and PC3 cells treated with 4-OHE2 (t-test). B–C The mRNA (left) and protein (right) levels of IL6 in LNCaP (B) and LNCaP-abl (C) cells after the indicated treatments (one-way ANOVA). D Cell viability was assayed in LNCaP (left) and LNCaP-abl (right) cells after the indicated treatments (one-way ANOVA). E–F, (E) The cell invasion capability was assayed in PC3 cells after the indicated treatments. (F) Quantitative result of the (E) (one-way ANOVA). Scale bar = 500 μm. G A representative flow cytometric analysis of the CD44+/CD24 subpopulation of LNCaP-abl cells treated with 4-OHE2 and/or AB-IL6. H Representative image (left) and quantification (right) of tumorsphere formation assay from LNCaP-abl cells treated with 4-OHE2 and/or AB-IL6. Scale bar = 100 μm (one-way ANOVA). Bic, bicalutamide; AB-IL6, IL6 neutralizing antibody. All values represent the means ± SD from three independent experiments. *p < 0.05 versus ctrl. #p < 0.05 versus 4-OHE2 or OE_CYP1B1
Fig. 5
Fig. 5
4-OHE2 enhances ER transcriptional activity. A Identification of gene signatures related to an early estrogen response by GSEA in CYP1B1High and CYP1B1low PRAD samples from the TCAG. B Correlation analysis of CYP1B1 and the early estrogen response gene set in normal prostate tissues and PRAD tissues from TCGA (TCGA and GTEx normal, n = 152, PRAD, n = 498). C Mean mRNA levels of ESR1, ESR2 and GPER for CYP1B1High sample versus CYP1B1Low samples in the PRAD dataset from the TCGA (t-test). D Luciferase reporter assays in LNCaP-abl and PC3 cells transfected with estrogen receptor promoter reporter (ERE-LUC) after 4-OHE2 treatment (t-test). E Representative IF staining of CYP1B1 (red) and ERα (green) in LNCaP and PC3 cells after the indicated treatments. Scale bar = 50 μm. Bic, bicalutamide. PRAD, prostate adenocarcinoma. All values represent the means ± SD from three independent experiments. *p < 0.05
Fig. 6
Fig. 6
4-OHE2 upregulates IL6 expression via ERα. A Left: Representative IHC staining of ERα and IL6 protein in benign prostate tissues, primary PCa and CRPC tissues. Right: Quantification of the average optical density of ERα and IL6 by IHC staining. Scale bar = 100 μm (one-way ANOVA). B IF staining of ERα (red) and IL6 (green) in PCa tissue. Scale bar = 100 μm. C The mRNA level of IL6 in LNCaP-abl and PC3 cells after the indicated treatments (one-way ANOVA). DE The mRNA level of IL6 was assayed in ERα knockdown or control LNCaP-abl (D) and PC3 (E) cells after 4-OHE2 treatment (one-way ANOVA). F qRT-PCR analysis of IL6 levels in ERα-overexpressing or control LNCaP cells (t-test). G–H Luciferase reporter assays in LNCaP-abl and PC3 cells transfected with IL6 promoter reporter (IL6-pro) together with ERα knockdown (G) or CYP1B1 knockdown (H) (t-test). I Top: Predicted ERα-binding site in the proximal promoter region of IL6. Bottom: PC3 and LNCaP-abl cells treated with or without 10 nM 4-OHE2 were subjected to ChIP analysis using an anti-ERα antibody or isotype-matched IgG control. J Luciferase reporter assays in PC3 cells transfected with the IL6 promoter containing wild-type (WT) or mutated ERα-binding site (IL6 mut) together with DMSO or 4-OHE2 treatment (t-test). All values represent the means ± SD from three independent experiments. *p < 0.05 versus ctrl. #p < 0.05 versus 4-OHE2

Similar articles

Cited by

References

    1. Siegel RL, Miller KD, Fuchs HE, Jemal A. Cancer statistics, 2021. CA Cancer J Clin. 2021;71:7–33. doi: 10.3322/caac.21654. - DOI - PubMed
    1. Zhou L, Song Z, Hu J, Liu L, Hou Y, Zhang X, Yang X, Chen K. ACSS3 represses prostate cancer progression through downregulating lipid droplet-associated protein PLIN3. Theranostics. 2021;11:841–860. - PMC - PubMed
    1. Zhou Y, Bolton EC, Jones JO. Androgens and androgen receptor signaling in prostate tumorigenesis. J Mol Endocrinol. 2015;54:R15–29. - PubMed
    1. Konoshenko MY, Bryzgunova OE, Laktionov PP. miRNAs and androgen deprivation therapy for prostate cancer. Biochim Biophys Acta Rev Cancer. 2021;1876:188625. - PubMed
    1. Beebe-Dimmer JL, Ruterbusch JJ, Bylsma LC, Gillezeau C, Fryzek J, Schultz NM, Flanders SC, Barlev A, Heath E, Quek RGW. Patterns of bicalutamide use in prostate cancer treatment: a U.S. real-world analysis using the SEER-medicare database. Adv Ther. 2018;35:1438–1451. - PMC - PubMed

Publication types

LinkOut - more resources