. 2022 Jun 1;30(6):2274-2297.
doi: 10.1016/j.ymthe.2022.03.008. Epub 2022 Mar 12.

IL-4 polarized human macrophage exosomes control cardiometabolic inflammation and diabetes in obesity

Affiliations

IL-4 polarized human macrophage exosomes control cardiometabolic inflammation and diabetes in obesity

Tuan Anh Phu et al. Mol Ther. .

Abstract

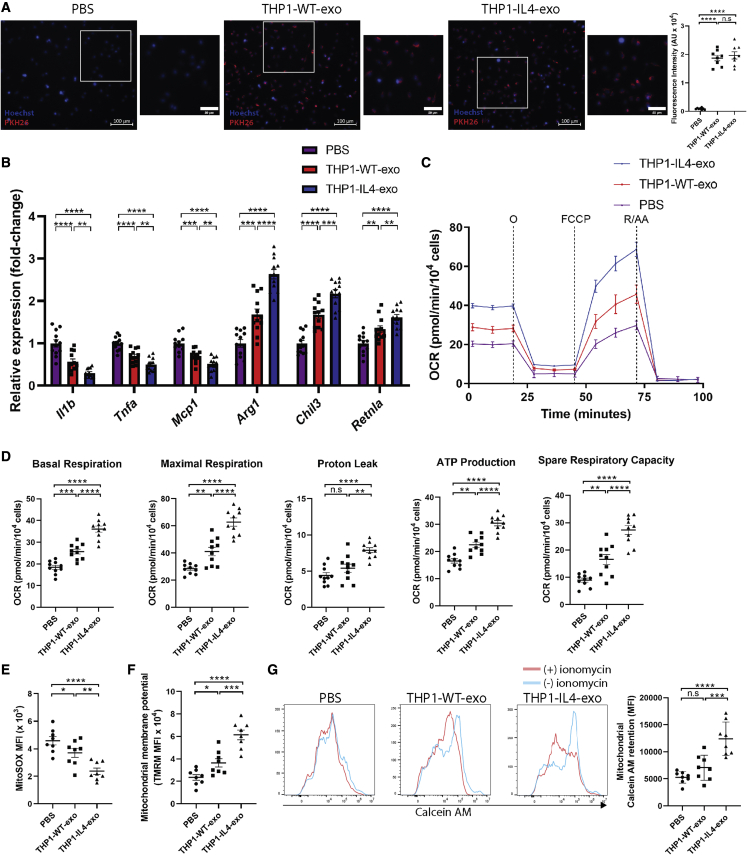
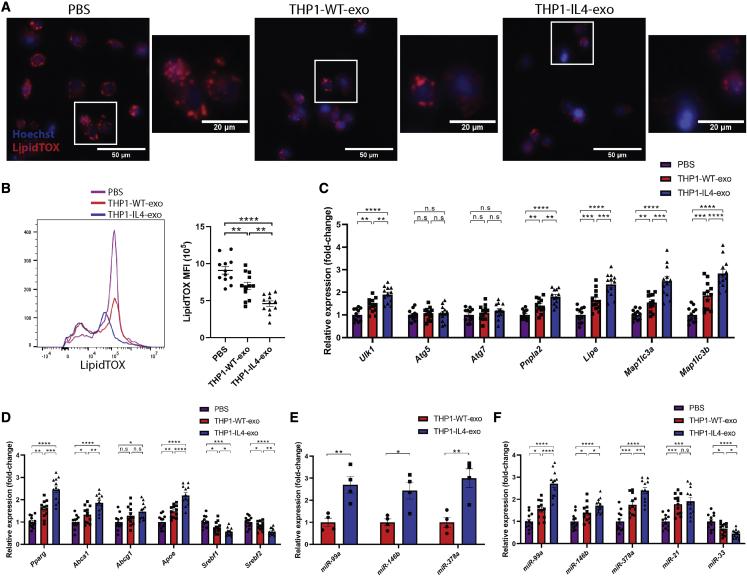
Cardiometabolic disease is an increasing cause of morbidity and death in society. While M1-like macrophages contribute to metabolic inflammation and insulin resistance, those polarized to an M2-like phenotype exert protective properties. Building on our observations reporting M2-like macrophage exosomes in atherosclerosis control, we tested whether they could serve to control inflammation in the liver and adipose tissue of obese mice. In thinking of clinical translation, we studied human THP-1 macrophages exposed to interleukin (IL)-4 as a source of exosomes (THP1-IL4-exo). Our findings show that THP1-IL4-exo polarized primary macrophages to an anti-inflammatory phenotype and reprogramed their energy metabolism by increasing levels of microRNA-21/99a/146b/378a (miR-21/99a/146b/378a) while reducing miR-33. This increased lipophagy, mitochondrial activity, and oxidative phosphorylation (OXPHOS). THP1-IL4-exo exerted a similar regulation of these miRs in cultured 3T3-L1 adipocytes. This enhanced insulin-dependent glucose uptake through increased peroxisome proliferator activated receptor gamma (PPARγ)-driven expression of GLUT4. It also increased levels of UCP1 and OXPHOS activity, which promoted lipophagy, mitochondrial activity, and beiging of 3T3-L1 adipocytes. Intraperitoneal infusions of THP1-IL4-exo into obese wild-type and Ldlr-/- mice fed a Western high-fat diet reduced hematopoiesis and myelopoiesis, and favorably reprogramed inflammatory signaling and metabolism in circulating Ly6Chi monocytes. This also reduced leukocyte numbers and inflammatory activity in the circulation, aorta, adipose tissue, and the liver. Such treatments reduced hepatic steatosis and increased the beiging of white adipose tissue as revealed by increased UCP1 expression and OXPHOS activity that normalized blood insulin levels and improved glucose tolerance. Our findings support THP1-IL4-exo as a therapeutic approach to control cardiometabolic disease and diabetes in obesity.

Keywords: PPARγ; adipocyte; beiging; cardiometabolic inflammation; exosomes; macrophage; microRNA-33; mitochondrial respiration; obesity; type II diabetes.


Conflict of interest statement

Declaration of interests T.A.P., M.N., N.K.V., L.B., and R.L.R. have filed an invention disclosure related to some aspects of this work with the University of California, San Francisco, and the US Department of Veterans Affairs.

Figures

None
Graphical abstract
Figure 1
Figure 1
Biophysical parameters of THP-1 macrophage exosomes (A) Representative concentration and size distributions of THP1-WT-exo and THP1-IL-4-exo purified from THP-1 cell culture supernatants after a 24-h period of culture as determined using nanoparticle tracking analysis. (B and C) Average concentration of purified exosomes in particles per milliliter (B) and mode of particle diameter in nanometers (C) (n = 4 samples per group). (D) Electron micrograph of purified exosomes from THP-1 cells. Scale bar: 100 nm. (E) Western blot analysis of Calnexin, GM130, CD9, CD63, and CD81 in exosome-free medium (EFM), cell lysate, and 1.5 × 109 particles of THP-1-derived exosomes (representative of three independent experiments). Data are represented as mean ± SEM.
Figure 2
Figure 2
THP1-IL4-exo modulate inflammation and energy expenditure in recipient macrophages by inducing mitochondrial respiration (A) Merged images showing quantification of the internalization of PKH26-labeled THP-1-derived exosomes by naive primary BMDMs counterstained with Hoechst (blue). BMDMs were co-incubated with 2 × 109 PKH26-labeled exosomes for 2 h at 37°C and washed repeatedly to remove unbound exosomes. All images were acquired using a Zeiss Axio microscope system with a 20× objective (n = 8 samples per group, pooled from two independent experiments). Scale bar: 100 μm and 50 μm (micrograph). (B) qRT-PCR analysis of Il1b, Tnf, Mcp1, Arg1, Chil3, and Retnla mRNA expression in BMDMs treated with PBS (control), THP1-WT-exo, or THP1-IL-4-exo for 24 h. Results were normalized to B2m and Gapdh mRNA and are presented relative to control (n = 12 per group, pooled from three independent experiments). (C) Graph showing representative Seahorse mitochondrial stress tests. O, oligomycin (1 μM); F, FCCP (2 μM); R/AA, rotenone/antimycin A (0.5 μM). One representative experiment out of two experiments is shown; n = 5 per group. (D) Graphs showing quantified cell-normalized mitochondrial OCR from stress tests; n = 10 per group, pooled from two independent experiments. (E–G) Graphs showing MFI of MitoSOX (E), TMRM (F), and calcein AM (G) signals in BMDMs treated with 4 × 109 particles/mL of THP1-WT-exo, THP1-IL4-exo, or PBS (control) as measured by flow cytometric analysis; n = 8 in each group, pooled from two independent experiments. ∗p < 0.05, ∗∗p < 0.01, ∗∗∗p < 0.001, and ∗∗∗∗p < 0.0001 as determined using one-way ANOVA and Holm-Sidak post-test. Data are represented as mean ± SEM.
Figure 3
Figure 3
THP1-IL4-exo regulate lipid homeostasis, induce lipophagy, and control the expression of distinct microRNAs in recipient macrophages (A) Merged images showing LipidTOX staining of neutral lipids in naive cultured BMDMs counterstained with Hoechst (blue). BMDM were co-incubated with 4 × 109 particles/mL of THP1-WT-exo, THP1-IL4-exo, or PBS for 24 h at 37°C and subsequently stained with LipidTOX for 30 min. All images were acquired using a Zeiss microscope system with a 20× objective. Scale bars: 50 μm and 20 μm (micrograph). (B) Representative flow cytometric plot and graph showing average mean fluorescent intensity (MFI) of LipidTOX signals in BMDMs treated with 4 × 109 particles/mL of THP1-WT-exo, THP1-IL4-exo, or PBS for 24 h at 37°C; n = 12 per group, pooled from three independent experiments. (C) qRT-PCR analysis of Ulk1, Atg5, Atg7, Pnpla2, Lipe, Map1lc3a, and Map1lc3b mRNA expression in BMDMs treated with PBS (control), THP1-WT-exo, or THP1-IL-4-exo for 24 h. (D) qRT-PCR analysis of Pparg, Abca1, Abcg1, Apoe, Srebf1, and Srebf2 expression in BMDMs treated with PBS (control), THP1-WT-exo, or THP1-IL-4-exo for 24 h. Results were normalized to B2m and Gapdh mRNA and are presented relative to control (n = 12 per group, pooled from three independent experiments). (E) qRT-PCR analysis of miR-99a-5p, miR-146b-5p, and miR-378a-3p microRNA expression in THP1-WT-exo and THP1-IL-4-exo. Results were normalized to U6 snRNA and miR-16-5p expression, with UniSp6 used as a spike-in control. Data are presented relative to THP1-WT-exo (n = 4 per group). (F) qRT-PCR analysis of miR-99a-5p, miR-146b-5p, miR-378a-3p, miR-21-5p, and miR-33-5p microRNA expression in BMDMs treated with PBS (control), THP1-WT-exo, or THP1-IL-4-exo for 24 h. Results were normalized to U6 snRNA and miR-16-5p expression, with UniSp6 used as a spike-in control. Data are presented relative to control (n = 12 per group, pooled from three independent experiments). ∗p < 0.05, ∗∗p < 0.01, ∗∗∗p < 0.001, and ∗∗∗∗p < 0.0001 as determined using either unpaired Student’s t test (for two-group comparison) or one-way ANOVA followed by Holm-Sidak post-test (for multiple-group comparison). Data are represented as mean ± SEM.
Figure 4
Figure 4
THP1-IL4-exo induce energy expenditure and control expression of distinct microRNAs in recipient 3T3-L1 adipocytes (A) Merged images showing and quantification of the internalization of PKH26-labeled THP-1-derived exosomes by 3T3-L1 adipocytes counterstained with Hoechst (blue). 3T3-L1 adipocytes were co-incubated with 2 × 109 PKH26-labeled exosomes for 2 h at 37°C and washed repeatedly to remove unbound exosomes. All images were acquired using a Zeiss Axio microscope system with a 20× objective (n = 8 samples per group, pooled from two independent experiments). Scale bar: 500 μm and 250 μm (micrograph). (B) qRT-PCR analysis of Pparg, Slc2a4, Srebf1, Srebf2, and Ucp1 mRNA expression in 3T3-L1 adipocytes treated with PBS (control), THP1-WT-exo, or THP1-IL-4-exo for 24 h. Results were normalized to B2m and Gapdh mRNA and are presented relative to control (n = 12 per group, pooled from three independent experiments). (C and D) Western blot analysis (C) and quantification (D) of GLUT4, PPARγ, and UCP1 protein levels in cell lysates of 3T3-L1 adipocytes treated with PBS (control), THP1-WT-exo, or THP1-IL-4-exo for 24 h. Quantification was performed using ImageJ and data normalized to loading controls β-Actin or GAPDH (n = 6 per group, pooled from two independent experiments). (E) Graph showing representative Seahorse mitochondrial stress tests. O, oligomycin (1 μM); F, FCCP (0.25 μM); R/AA, rotenone/antimycin A (0.5 μM). One representative experiment out of two experiments is shown; n = 6 per group. (F) Graphs showing quantified cell-normalized mitochondrial OCR from stress tests; n = 12 in each group, pooled from two independent experiments. qRT-PCR analysis of miR-99a-5p, miR-146b-5p, miR-378a-3p, miR-21-5p, and miR-33-5p expression levels in 3T3-L1 adipocytes treated with PBS (control), THP1-WT-exo, or THP1-IL-4-exo for 24 h. Results were normalized to U6 snRNA and miR-16-5p expression, with UniSp6 used as a spike-in control. Data are presented relative to control (n = 12 per group, pooled from three independent experiments). ∗p < 0.05, ∗∗p < 0.01, ∗∗∗p < 0.001, and ∗∗∗∗p < 0.0001 as determined using one-way ANOVA and Holm-Sidak post-test. Data are represented as mean ± SEM.
Figure 5
Figure 5
THP1-IL4-exo enhance mitochondrial activity, induce lipophagy, and promote beiging during 3T3-L1 adipocyte differentiation (A) Merged images showing LipidTOX staining of 3T3-L1 adipocytes counterstained with Hoechst (blue). 3T3-L1 adipocytes were treated with 4 × 109 particles/mL of THP1-WT-exo, THP1-IL4-exo, or PBS every 2 days following a 2-day induction period by IBMX, DEX, and bovine insulin. By day 15, cells were stained with LipidTOX for 30 min. All images were acquired using a Zeiss microscope system with a 20× objective. Scale bars: 50 μm and 50 μm (micrograph). (B) Representative flow cytometric plot and graph showing average MFI of LipidTOX signals in 3T3-L1 adipocytes treated with 4 × 109 particles/mL of THP1-WT-exo, THP1-IL4-exo, or PBS every 2 days following the induction period; n = 12 per group, pooled from three independent experiments. (C–E) Graphs showing MFI of MitoSOX (C), TMRM (D), and calcein AM (E) signals in 3T3-L1 adipocytes treated with 4 × 109 particles/mL of THP1-WT-exo, THP1-IL4-exo, or PBS every 2 days following the induction period; n = 8 per group, pooled from two independent experiments. (F) qRT-PCR analysis of Ucp1, Ppargc1a, Tbx1, Dio2, Zfp516, Prdm16, and Slc25a25 mRNA expression in 3T3-L1 adipocytes treated with 4 × 109 particles/mL of THP1-WT-exo, THP1-IL4-exo, or PBS every 2 days following the induction period. (G) qRT-PCR analysis of Ulk1, Atg5, Atg7, Pnpla2, Lipe, Map1lc3a, and Map1lc3b mRNA expression in 3T3-L1 adipocytes treated with 4 × 109 particles/mL of THP1-WT-exo, THP1-IL4-exo, or PBS every 2 days following the induction period. (H) qRT-PCR analysis of Adipoq and Lep in 3T3-L1 adipocytes treated with 4 × 109 particles/mL of THP1-WT-exo, THP1-IL4-exo, or PBS every 2 days following the induction period. Results were normalized to B2m and Gapdh mRNA and are presented relative to control (n = 12 per group, pooled from three independent experiments). ∗p < 0.05, ∗∗p < 0.01, ∗∗∗p < 0.001, and ∗∗∗∗p < 0.0001 as determined using one-way ANOVA and Holm-Sidak post-test. Data are represented as mean ± SEM.
Figure 6
Figure 6
THP1-IL4-exo resolve systemic inflammation and hematopoiesis in mice with diet-induced obesity and hyperlipidemia (A and B) Images of DiR fluorescence in blood (A) and organs (B) 6 h post injection from 20-week-old Western-diet-fed Apoeh/hLdlr−/− mice injected i.p. with PBS as control or 1 × 1010 particles of THP1-WT-exo or THP1-IL4-exo. (C) Schematic diagram detailing the duration of Western diet feeding and injection strategy in 26-week-old Apoeh/hLdlr−/− mice. (D) Quantification of circulating CD11b+ cells, neutrophils, Ly6Chi monocytes, and Ly6Clo monocytes in mice injected with PBS or THP1-IL4-exo by flow cytometry; n = 10 per group, pooled from three independent experiments. (E) Quantification of splenic CD11b+ cells, neutrophils, Ly6Chi monocytes, and Ly6Clo monocytes in mice injected with PBS or THP1-IL4-exo by flow cytometry; n = 10 per group, pooled from three independent experiments. (F) Quantification of bone marrow LSK, MPP1, MPP2, MPP3, MPP4, CMP, GMP, and MEP cell populations by flow cytometry; n = 8 per group, pooled from two independent experiments. (G) Quantification of splenic LSK, MPP1, MPP2, MPP3, MPP4, CMP, GMP, and MEP cell populations by flow cytometry; n = 8 per group, pooled from two independent experiments. (H) qRT-PCR analysis of Tnf, Il1b, and Mcp1 mRNA expression in circulating Ly6Chi monocytes. (I) qRT-PCR analysis of Pparg, Abca1, Abcg1, Srebf1, and Srebf2 mRNA expression in circulating Ly6Chi monocytes. (J) qRT-PCR analysis of miR-99a-5p, miR-146b-5p, miR-378a-3p, miR-21-5p, and miR-33-5p microRNA expression levels in circulating Ly6Chi monocytes isolated by FACS. Results were normalized to B2m and Gapdh for mRNA analysis and U6 snRNA, miR-16-5p, and UniSp6 (spike-in control) for miRNA analysis. Data are presented relative to control (n = 8 per group, pooled from two independent experiments). (K) Multiplex immunoassay analysis of plasma TNF-α, IFN-γ, IL-6, and IL-1β; n = 10 per group, pooled from three independent experiments. Data are taken in 26-week-old Apoeh/hLdlr−/− mice fed with a Western diet and injected with PBS or THP1-IL-4-exo (1 × 1010 particles/mouse every 2 days for 6 weeks while on Western diet). ∗p < 0.05, ∗∗p < 0.01, ∗∗∗p < 0.001, and ∗∗∗∗p < 0.0001 as determined using either unpaired Student’s t test (for two-group comparison) or one-way ANOVA followed by Holm-Sidak post-test (for multiple-group comparison). Data are represented as mean ± SEM.
Figure 7
Figure 7
Infusions of THP1-IL4-exo suppress aortic, hepatic, and adipose tissue inflammation in obese hyperlipidemic mice (A and B) Representative flow cytometry plots of leukocyte subsets from aorta (A) and quantification of aortic CD45+ cells, macrophages, CD11b+ cells, neutrophils, Ly6Chi monocytes, and Ly6Clo monocytes (B). (C and D) Representative flow cytometry plots of leukocyte subsets from livers (C) and quantification of hepatic CD45+ cells, infiltrating macrophages/monocytes, Kupffer cells, neutrophils, and Ly6Chi monocytes (D). (E) qRT-PCR analysis of Adgre1, Tnf, Il1b, Mcp1, Nos2, Arg1, Chil3, and Retnla mRNA expression in livers. Results were normalized to B2m and Gapdh mRNA and are presented relative to control. Data are pooled from three independent experiments, n = 10 per group. (F) Representative images and quantification of F4/80+ cells that formed crown-like structures (CLSs) in eWAT; n = 8 per group, pooled from two independent experiments. Scale bar: 200 μm. (G) Quantification of eWAT CD45+ cells, macrophages, CD11b+ cells, neutrophils, and Ly6Chi monocytes measured by flow cytometry. (H) qRT-PCR analysis of Adgre1, Tnf, Il1b, Mcp1, Nos2, Arg1, Chil3, and Retnla mRNA expression in eWAT. Results were normalized to B2m and Gapdh mRNA and are presented relative to control. Data are pooled from three independent experiments, n = 10 per group. All data are taken from 26-week-old Apoeh/hLdlr−/− mice fed with a Western diet and injected with PBS or THP1-IL-4-exo (1 × 1010 particles/mouse every 2 days for 6 weeks while on Western diet). ∗p < 0.05, ∗∗p < 0.01, ∗∗∗p < 0.001, and ∗∗∗∗p < 0.0001 as determined using either unpaired Student’s t test (for two-group comparison) or one-way ANOVA followed by Holm-Sidak post-test (for multiple-group comparison). Data are represented as mean ± SEM.
Figure 8
Figure 8
Infusions of THP1-IL4-exo enhance energy expenditure and induce eWAT beiging, which improves glucose disposal and normalizes fasting blood glucose and insulin levels in hyperlipidemic and obese mice (A) Fasting glucose and insulin levels measured from mouse plasma; insulin was measured by ELISA. (B and C) Plot showing blood glucose levels in mice during GTT (B) and values of area under the curve in GTT (C). Data are pooled from two independent experiments, n = 8 per group. (D) Detection of 2-DG uptake in differentiated 3T3-L1 adipocytes treated with 4 × 109 particles/mL of THP1-IL4-exo, THP1-WT-exo, or PBS for 24 h; n = 10 per group, pooled from two independent experiments. (E) Graph showing representative Seahorse mitochondrial stress tests. O, oligomycin (10 μM); F, FCCP (10 μM); R/AA, rotenone/antimycin A (5 μM). One representative experiment out of two experiments is shown; n = 4 per group. (F) Graphs showing quantified protein-normalized mitochondrial OCR from stress tests; n = 8 in each group, pooled from two independent experiments. (G) Representative images of hematoxylin and eosin staining and quantification of adipocyte sizes in eWAT; n = 8 per group, pooled from two independent experiments. Scale bar: 300 μm. (H) qRT-PCR analysis of Pparg and Slc2a4 mRNA expression in eWAT; n = 10 per group, pooled from three independent experiments. (I) Western blot analysis and quantification of GLUT4 protein levels in eWAT tissue lysates. Quantification was performed using ImageJ and data normalized to loading controls Vinculin (n = 8 per group, pooled from two independent experiments). (J) qRT-PCR analysis of Ucp1, Ppargc1a, Tbx1, Dio2, Zfp516, Prdm16, and Slc25a25 mRNA expression in eWAT; n = 10 per group, pooled from three independent experiments. (K) Images of UCP1 staining in eWAT; two representative images are shown from n = 8 per group. Scale bar: 500 μm. (L) qRT-PCR analysis of Ulk1, Atg5, Atg7, Pnpla2, Lipe, Map1lc3a, and Map1lc3b mRNA expression in eWAT; n = 10 per group, pooled from three independent experiments. (M) qRT-PCR analysis of Adipoq and Lep mRNA expression in eWAT; n = 10 per group, pooled from three independent experiments. (N) Adiponectin:leptin ratio as measured by ELISA from plasma of fasted mice; n = 8 per group, pooled from three independent experiments. Data are taken from 26-week-old Apoeh/hLdlr−/− mice fed with a Western diet and injected with PBS or THP1-IL-4-exo (1 × 1010 particles/mouse every 2 days for 6 weeks while on Western diet), or 26-week-old chow-fed wild-type C57BL/6 mice. Results were normalized to B2m and Gapdh mRNA and are presented relative to control. ∗p < 0.05, ∗∗p < 0.01, ∗∗∗p < 0.001, and ∗∗∗∗p < 0.0001 as determined using either unpaired Student’s t test (for two-group comparison) or one-way ANOVA followed by Holm-Sidak post-test (for multiple-group comparison). Data are represented as mean ± SEM.

References

    1. Leon B.M., Maddox T.M. Diabetes and cardiovascular disease: epidemiology, biological mechanisms, treatment recommendations and future research. World J. Diabetes. 2015;6:1246–1258. - PMC - PubMed
    1. Kirk E.P., Klein S. Pathogenesis and pathophysiology of the cardiometabolic syndrome. J. Clin. Hypertens. 2009;11:761–765. - PMC - PubMed
    1. Donath M.Y., Meier D.T., Boni-Schnetzler M. Inflammation in the pathophysiology and therapy of cardiometabolic disease. Endocr. Rev. 2019;40:1080–1091. - PMC - PubMed
    1. Lumeng C.N., Deyoung S.M., Bodzin J.L., Saltiel A.R. Increased inflammatory properties of adipose tissue macrophages recruited during diet-induced obesity. Diabetes. 2007;56:16–23. - PubMed
    1. Lumeng C.N., DelProposto J.B., Westcott D.J., Saltiel A.R. Phenotypic switching of adipose tissue macrophages with obesity is generated by spatiotemporal differences in macrophage subtypes. Diabetes. 2008;57:3239–3246. - PMC - PubMed

Publication types