. 2022 Mar 15;12(1):104.
doi: 10.1038/s41398-022-01870-9.

Distinct neurocognitive bases for social trait judgments of faces in autism spectrum disorder

Affiliations

Distinct neurocognitive bases for social trait judgments of faces in autism spectrum disorder

Hongbo Yu et al. Transl Psychiatry. .

Abstract

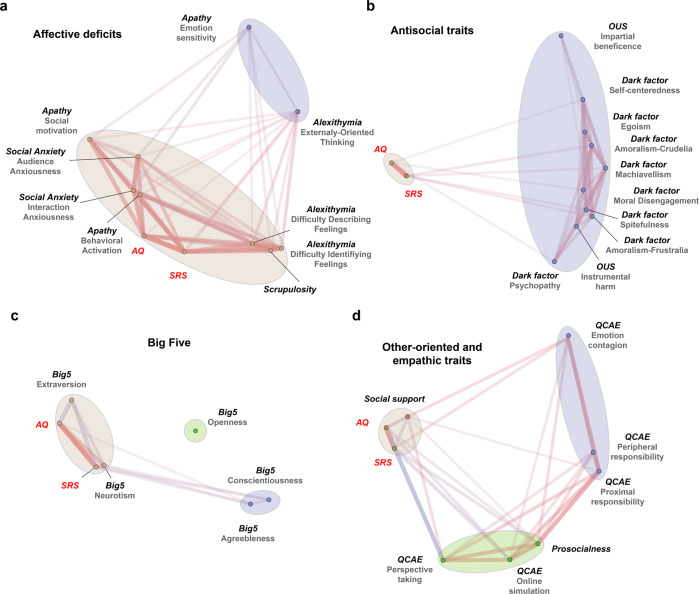
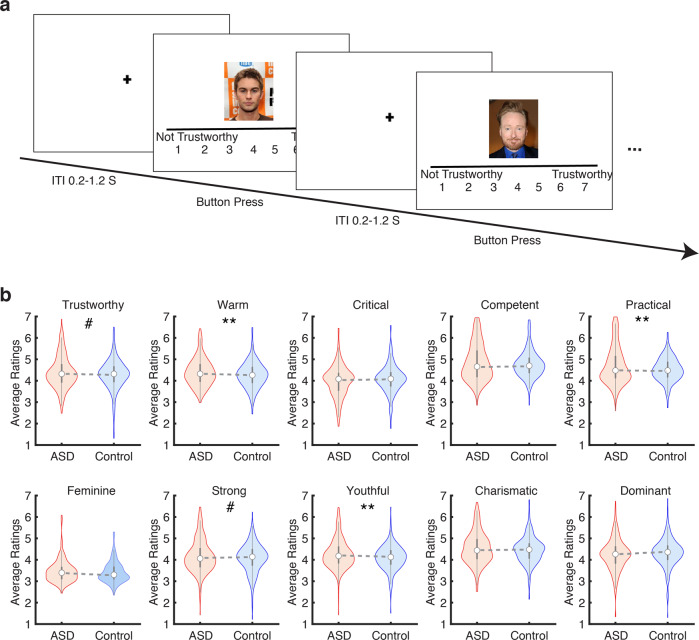
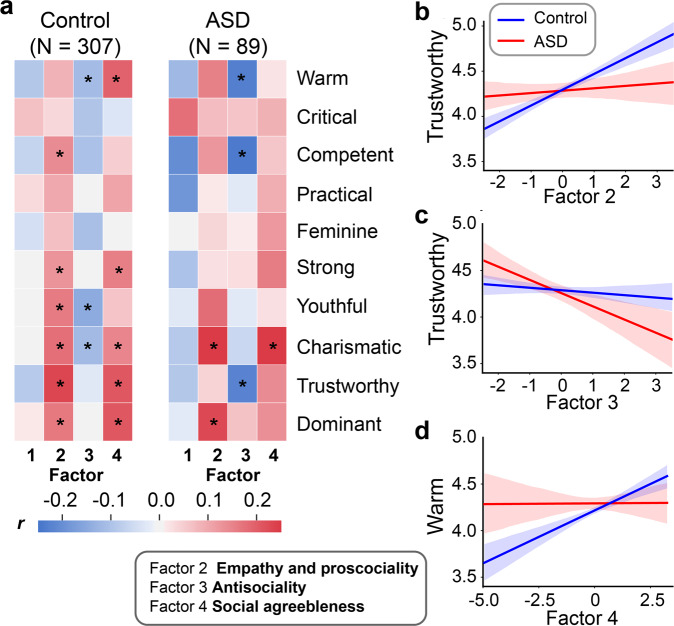
Autism spectrum disorder (ASD) is characterized by difficulties in social processes, interactions, and communication. Yet, the neurocognitive bases underlying these difficulties are unclear. Here, we triangulated the 'trans-diagnostic' approach to personality, social trait judgments of faces, and neurophysiology to investigate (1) the relative position of autistic traits in a comprehensive social-affective personality space, and (2) the distinct associations between the social-affective personality dimensions and social trait judgment from faces in individuals with ASD and neurotypical individuals. We collected personality and facial judgment data from a large sample of online participants (N = 89 self-identified ASD; N = 307 neurotypical controls). Factor analysis with 33 subscales of 10 social-affective personality questionnaires identified a 4-dimensional personality space. This analysis revealed that ASD and control participants did not differ significantly along the personality dimensions of empathy and prosociality, antisociality, or social agreeableness. However, the ASD participants exhibited a weaker association between prosocial personality dimensions and judgments of facial trustworthiness and warmth than the control participants. Neurophysiological data also indicated that ASD participants had a weaker association with neuronal representations for trustworthiness and warmth from faces. These results suggest that the atypical association between social-affective personality and social trait judgment from faces may contribute to the social and affective difficulties associated with ASD.


Conflict of interest statement

The authors declare no competing interests.

Figures

Fig. 1
Fig. 1. Visualization of personality trait networks.
We categorized the personality measures (other than the autistic trait measures) into four groups. We then illustrated the networks consisting of autistic traits (highlighted in red) on the one hand, and each of these groups of personality measures on the other hand: a Affective deficits (including Social Anxiety, Apathy, Alexithymia, and Moral Scrupulosity), b Antisocial traits (including the Dark Factors, and utilitarianism), c the Big Five, and d Other-oriented and empathic traits (including QCAE, Perceived Social Support, and Prosocialness). Each dot in the figure indicates a personality subscale. Length of edges connecting the dots indicates the statistical distance (i.e., absolute correlation coefficient) between the subscales. Color of the edges indicates the sign of the relationship (i.e., warm color = positive association, cool color = negative association). Ellipses were drawn to reflect potential clusters in each network, which were formally examined in the factor analysis below.
Fig. 2
Fig. 2. Results of factor analysis.
a The correlation matrix of 33 questionnaire subscales and loadings of each subscale for the 4 factors. b–e Group differences in factor scores. The ASD group was significantly higher on Factor 1, which was primarily associated with standard autistic trait measures (i.e., AQ and SRS), social anxiety, and alexithymia. ***p < 0.001.
Fig. 3
Fig. 3. Procedure of the face judgment task and behavioral results.
a Sample trials of the face judgment task. b Distributions of trait ratings across groups. Violin plots present the median value as the white circle and the interquartile range as the gray vertical bars. **p < 0.01, ***p < 0.001.
Fig. 4
Fig. 4. A stronger neural-rating correspondence in controls than participants with ASD.
a Neuronal dissimilarity matrix (DM) constructed across face examples. b, c, e, f Social DM constructed across ratings of face examples in a single trait. b, e DM of trustworthiness and warmth from neural typical participants. c, f DM from participants with ASD. d, g Observed vs. permuted difference in DM correspondence between participant groups. The magenta line indicates the observed difference in DM correspondence between participant groups. The null distribution of difference in DM correspondence (shown in gray histogram) was calculated by permutation tests of shuffling the participant labels (1000 runs).
Fig. 5
Fig. 5. Results of the regression analysis.
Correlations between factor scores and social trait judgments (a). Scores of Factor 2 (b) and Factor 3 (c) are differentially associated with the Trustworthy judgment in the control group relative to the ASD group. Scores of Factor 4 (d) are differentially associated with the Warm judgment in the control group relative to the ASD group.
Fig. 6
Fig. 6. Results of the representational-similarity analysis.
a The structure of the dissimilarity regression model. The dissimilarity matrix structure of the social trait judgments (Trustworthy and Warm) was predicted by the dissimilarity matrices of the four personality dimensions or factors. Each cell represents the Euclidean distance between a pair of participants in the respective social trait judgment or personality dimension. Note that the matrices shown here are for illustration purposes only. b Regression coefficients of each personality dimension (factor) for Trustworthy (left) and Warm (right) judgments. The asterisks on the margins indicate significant main effect of a personality dimension in predicting the social trait judgments, while the asterisks with curly brackets indicate significant group by factor interaction, or in other words, significant group difference in the predictive power of a given personality dimension. R code for generating the figure was adapted from [90].

References

    1. Association AP. Diagnostic and Statistical Manual of Mental Disorders. American Psychiatric Publishing; 2013.
    1. Martinez‐Murcia FJ, Lai M, Gorriz JM, Ramírez J, Young AMH, Deoni SCL, et al. On the brain structure heterogeneity of autism: parsing out acquisition site effects with significance‐weighted principal component analysis. Hum Brain Mapp. 2017;38:1208–23. - PMC - PubMed
    1. Mottron L, Bzdok D. Autism spectrum heterogeneity: fact or artifact? Mol Psychiatry. 2020;25:3178–85. - PMC - PubMed
    1. Brewer R, Biotti F, Catmur C, Press C, Happé F, Cook R, et al. Can neurotypical individuals read autistic facial expressions? Atypical production of emotional facial expressions in autism spectrum disorders. Autism Res. 2016;9:262–71. - PMC - PubMed
    1. Grynberg D, Chang B, Corneille O, Maurage P, Vermeulen N, Berthoz S, et al. Alexithymia and the processing of emotional facial expressions (EFEs): systematic review, unanswered questions and further perspectives. PLoS ONE. 2012:7;e42429. https://journals.plos.org/plosone/article?id=10.1371/journal.pone.0042429. - PMC - PubMed

Publication types