. 2022 Mar 16;7(1):74.
doi: 10.1038/s41392-022-00894-3.

Exploration and functionalization of M1-macrophage extracellular vesicles for effective accumulation in glioblastoma and strong synergistic therapeutic effects

Affiliations

Exploration and functionalization of M1-macrophage extracellular vesicles for effective accumulation in glioblastoma and strong synergistic therapeutic effects

Xiaojun Wang et al. Signal Transduct Target Ther. .

Abstract

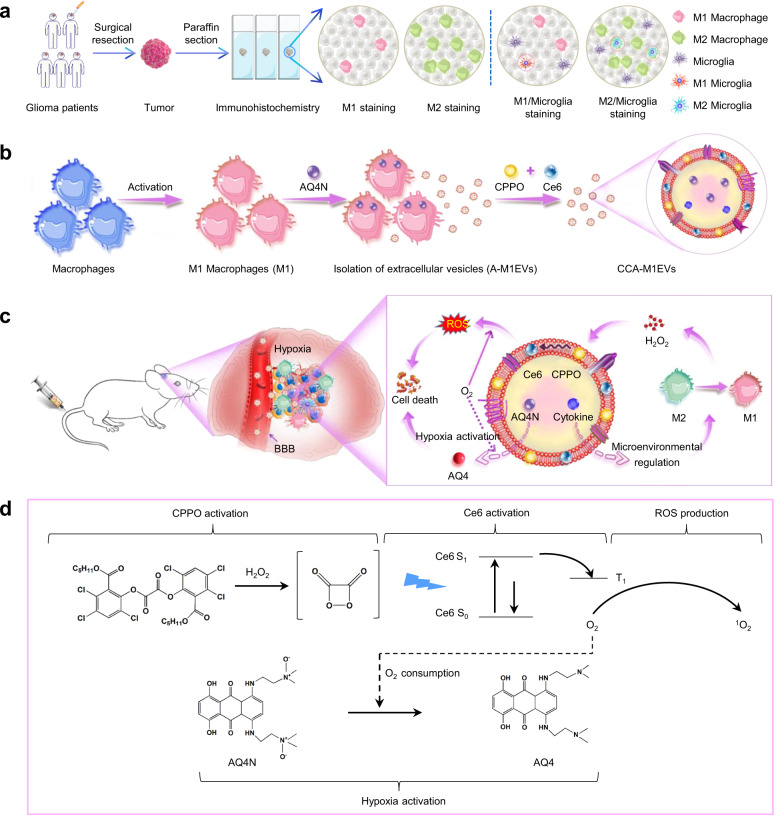
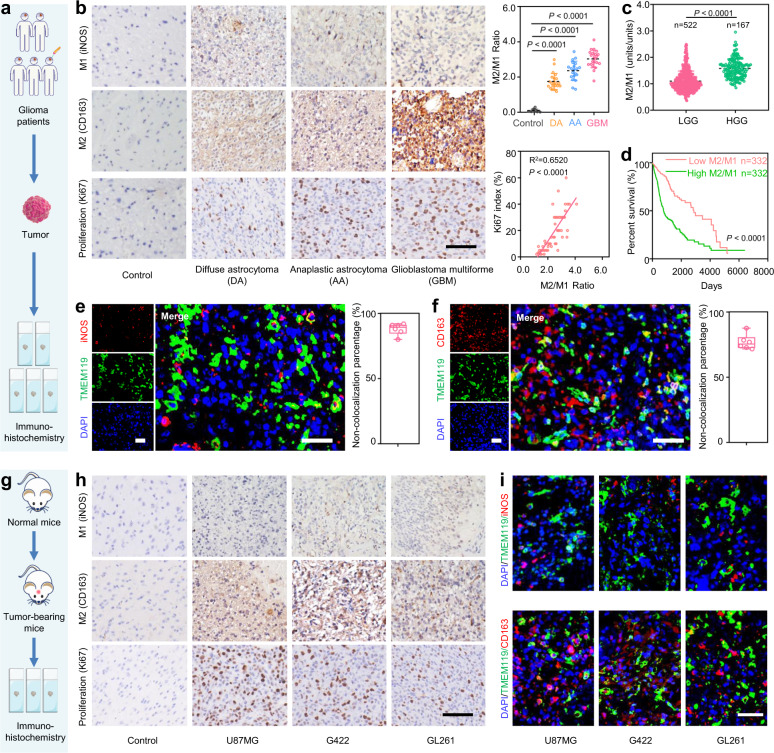
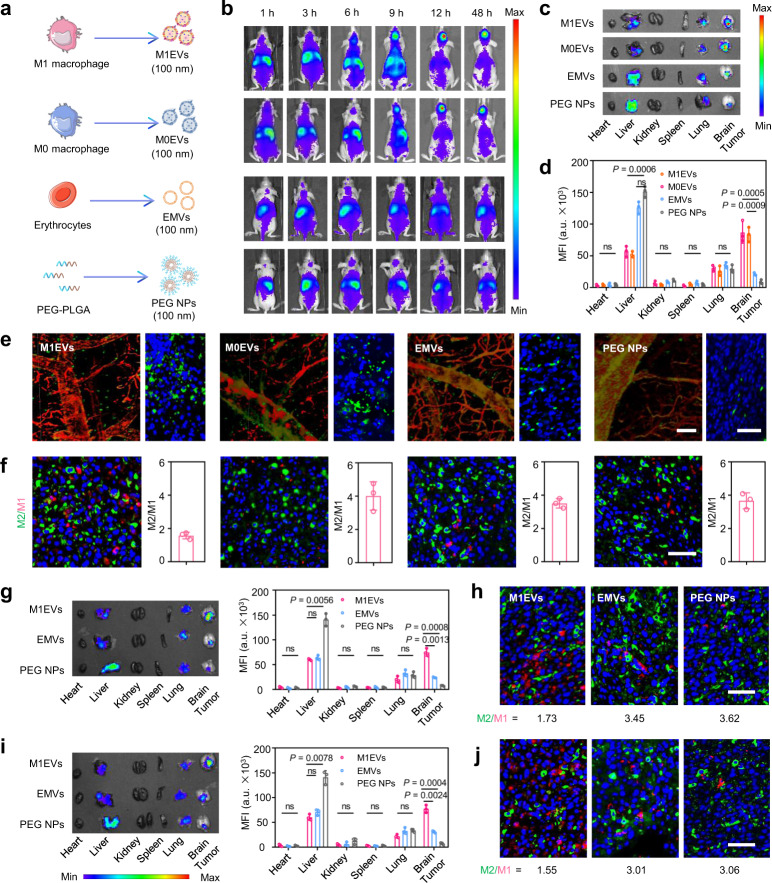
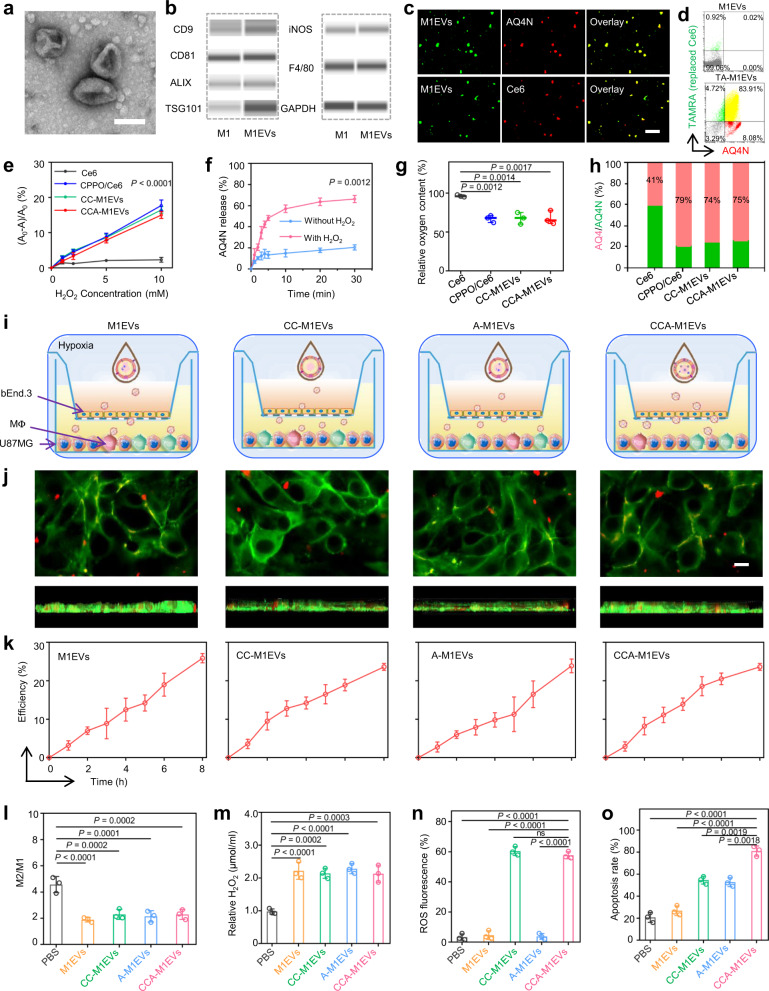
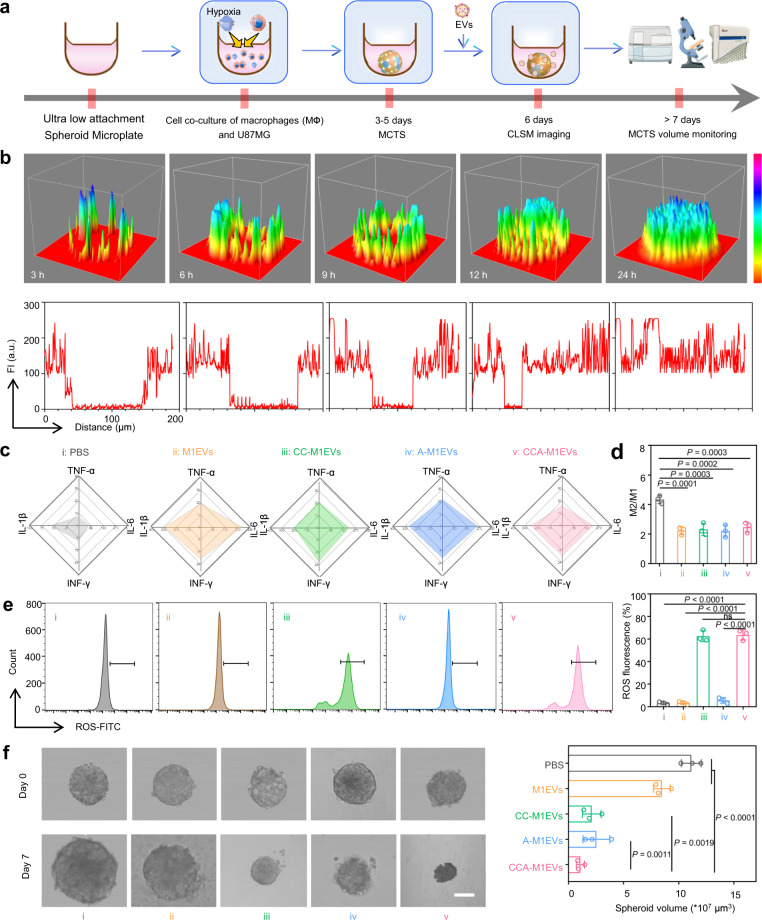
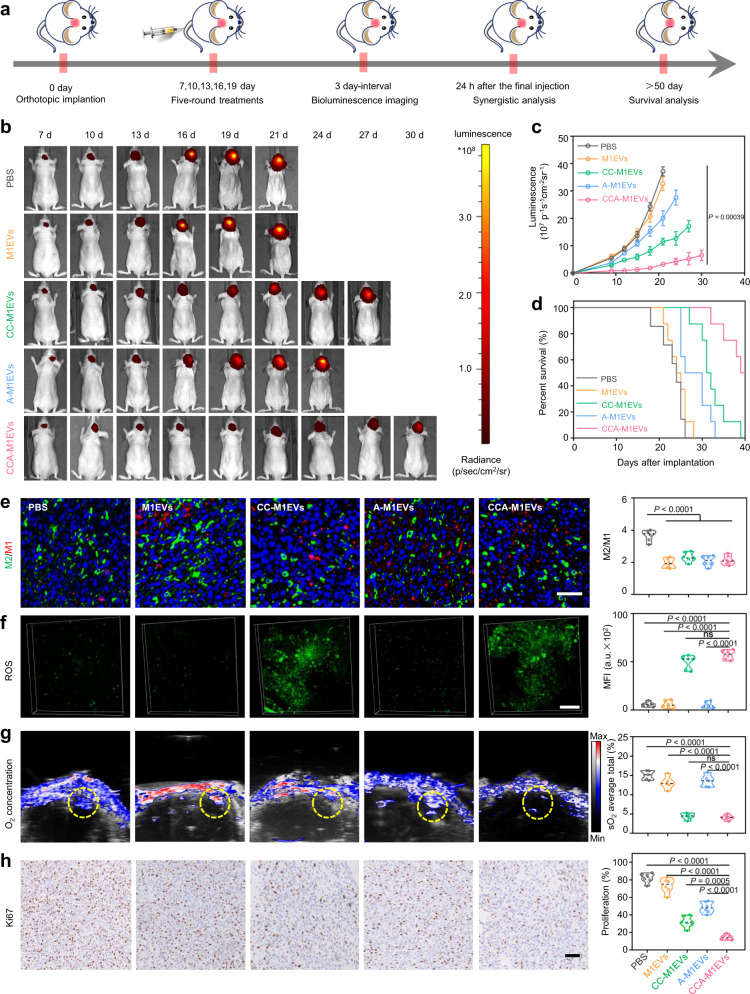
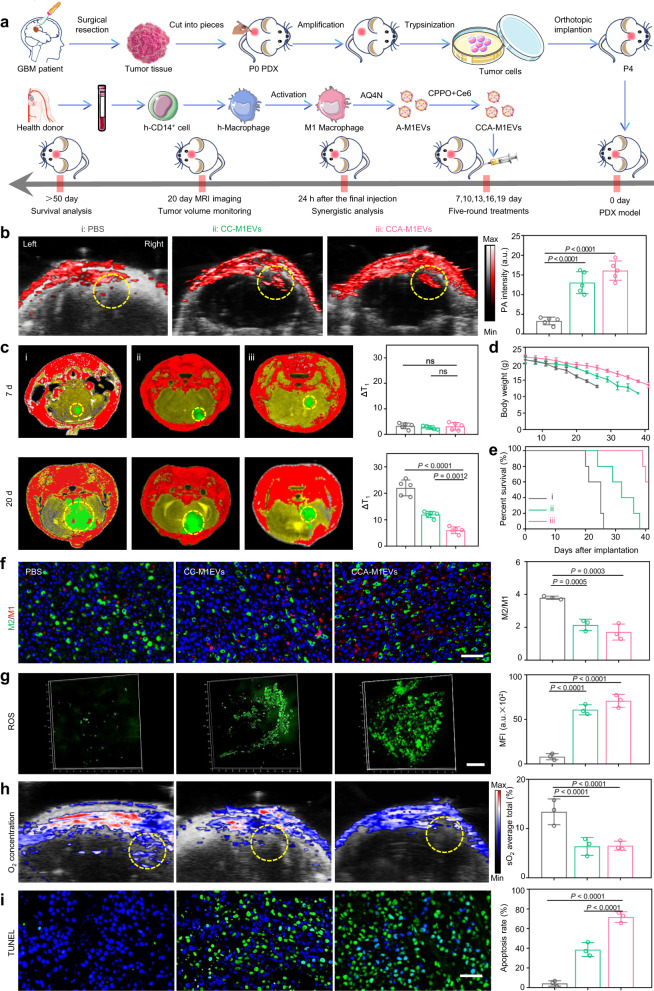
Glioblastoma multiforme (GBM) is a highly aggressive brain tumor with an extremely low survival rate. New and effective approaches for treatment are therefore urgently needed. Here, we successfully developed M1-like macrophage-derived extracellular vesicles (M1EVs) that overcome multiple challenges via guidance from two macrophage-related observations in clinical specimens from GBM patients: enrichment of M2 macrophages in GBM; and origination of a majority of infiltrating macrophage from peripheral blood. To maximize the synergistic effect, we further functionalized the membranes of M1EVs with two hydrophobic agents (the chemical excitation source CPPO (C) and the photosensitizer Ce6 (C)) and loaded the hydrophilic hypoxia-activated prodrug AQ4N (A) into the inner core of the M1EVs. After intravenous injection, the inherent nature of M1-derived extracellular vesicles CCA-M1EVs allowed for blood-brain barrier penetration, and modulated the immunosuppressive tumor microenvironment via M2-to-M1 polarization, which increased hydrogen peroxide (H2O2) levels. Furthermore, the reaction between H2O2 and CPPO produced chemical energy, which could be used for Ce6 activation to generate large amounts of reactive oxygen species to achieve chemiexcited photodynamic therapy (CDT). As this reaction consumed oxygen, the aggravation of tumor hypoxia also led to the conversion of non-toxic AQ4N into toxic AQ4 for chemotherapy. Therefore, CCA-M1EVs achieved synergistic immunomodulation, CDT, and hypoxia-activated chemotherapy in GBM to exert a potent therapeutic effect. Finally, we demonstrated the excellent effect of CCA-M1EVs against GBM in cell-derived xenograft and patient-derived xenograft models, underscoring the strong potential of our highly flexible M1EVs system to support multi-modal therapies for difficult-to-treat GBM.


Conflict of interest statement

The authors declare no competing interests.

Figures

Scheme 1
Scheme 1
Scheme of clinical glioma analysis, exosomal formulation construction, and tumor inhibition mechanism. a. Tumor-associated macrophages (TAMs) phenotype analysis of tumor samples from glioma patients. b. Schematic illustration of the formation of CCA-M1EVs. c. Accumulation in gliomas and synergism of immunomodulation, chemiexcited photodynamic therapy, and hypoxia-triggered chemotherapy of CCA-M1EVs in a murine model of gliomas. d. Corresponding illustration of chemical reactions induced by CCA-M1EVs
Fig. 1
Fig. 1. Analysis of diverse gliomas obtained from patients and mice revealed distinct TAMs phenotypes and their origination.
a. Schematic illustration of TAMs phenotype analysis from tumor samples of glioma patients. b. M1 macrophage (iNOS), M2 macrophage (CD163), and proliferation (Ki67) immunostaining of histological sections of tumor-adjacent tissues as control and in both low-grade gliomas (LGG: diffuse astrocytoma, n = 22) and high-grade gliomas (HGG: anaplastic astrocytoma, n = 20; glioblastoma multiforme, n = 22) resected from glioma patients. Quantitative analysis of the corresponding M2/M1 ratios was shown on the right side. The proliferation-related Ki67 marker index was positively correlated with the M2/M1 ratio. All images have the same scale of 50 μm. c. M2/M1 ratio analysis of 167 HGG and 522 LGG cases acquired from The Cancer Genome Atlas (TCGA) database. Each dot represented a single individual. d. Survival curves of glioma patients from TCGA database. The OncoLnc tool was used to explore the survival correlations for M2/M1 ratio data. e. Immunostaining of histological sections (left) and quantitative analysis (right) of noncolocalization percentage of microglia (TMEM119, green) and M1 macrophage (iNOS, red) of human glioma tissue. All images have the same scale of 50 μm. Nuclei: DAPI, blue (n = 6). f. Immunostaining of histological sections (left) and quantitative analysis (right) of noncolocalization percentage of microglia (TMEM119, green) and M2 macrophage (CD163, red) of human glioma tissue. All images have the same scale of 50 μm. Nuclei: DAPI, blue (n = 6). g. Schematic illustration of TAM phenotype analysis from tumor samples of U87MG (human glioblastoma cells) /G422 (mouse glioblastoma cells) /GL261 (mouse glioma cells)-cell-derived xenograft tumor-bearing mice. h. M1 macrophage (iNOS), M2 macrophage (CD163), and proliferation (Ki67) immunostaining of histological sections of normal tissue, U87MG, G422, and GL261-bearing tissue in mice. All images have the same scale of 50 μm. i. Microglia (TMEM119, green) and M1 macrophage (iNOS, red) immunostaining of histological sections of U87MG, G422, and GL261-bearing tissue (Top). Microglia and M2 macrophage (CD163, red) immunostaining of histological sections of U87MG, G422, and GL261-bearing tissue (bottom). All images have the same scale of 50 μm. Nuclei: DAPI, blue. Data in b, e, and f are presented as the mean ± S.D. Statistical significance was calculated via one-way ANOVA with a Tukey post hoc test (b) or unpaired two-tailed Student’s t-test (c) and survival analysis was calculated by two-sided Log-rank Mantel-Cox tests (d)
Fig. 2
Fig. 2. Macrophage-derived EVs could penetrate the blood-brain barrier (BBB) and efficiently modulated the tumor microenvironment (TME).
a. Schematic illustration of the fabrication process for M1EVs (derived from M1 macrophages), M0EVs (derived from M0 macrophages), EMVs (derived from erythrocytes), and PEG NPs (derived from PEG-PLGA materials). b. Representative fluorescence images of U87MG-bearing mice after intravenous (i.v.) injection with M1EVs, M0EVs, EMVs, and PEG NPs (all labeled with DiR) at different time points. c. Ex vivo images of the major organs dissected from mice in different groups at 48 h after i.v. injection. d. Quantitative analysis of corresponding fluorescence signals in panel (c). e. In vivo time-lapse two-photon images of the diffusion of M1EVs, M0EVs, EMVs, and PEG NPs acrossed the brain microvascular endothelial cells at 48 h after i.v. injection (left). Tetramethylrhodamine isothiocyanate-Dextran was used to label blood vessels (red). M1EVs, M0EVs, and EMVs labeled with DiO (green); PEG NPs labeled with FITC (green), and corresponding formulation distributions in tumor tissue (right). All images have the same scale of 50 μm. f. Immunofluorescence images of histological sections of M2 and M1 macrophages (left), and quantitative analysis of M2/M1 ratios (right) at 48 h after i.v. injection. All images have the same scale of 50 μm. iNOS (red, M1 marker), CD163 (green, M2 marker) (n = 3). g. Ex vivo images of the major organs dissected from G422 bearing mice in different groups (mouse source) at 48 h after i.v. injection (left), and corresponding analysis of ex vivo fluorescence signals of the major organs dissected from mice in different groups (right). h. Immunofluorescence images of histological sections (G422-bearing mice) of M2 and M1 macrophages (right). Scale bar: 50 μm, iNOS (red, M1 marker), CD163 (green, M2 marker) (n = 3). i. Ex vivo images of the major organs dissected from GL261 bearing-mice in different groups at 48 h after i.v. injection (left), and corresponding analysis of ex vivo fluorescence signals of the major organs dissected from mice in different groups (right). j. Immunofluorescence images of histological sections (GL261-bearing mice) of M2 and M1 macrophages (right). Scale bar: 50 μm, iNOS (red, M1 marker), CD163 (green, M2 marker) (n = 3). Data in d, f, g, and i are presented as the mean ± S.D. Statistical significance was calculated, compared with the M1EVs group, by one-way ANOVA with a Kruskal-Wallis test (d, g, i). ns, not significant
Fig. 3
Fig. 3. Characterizations of M1EVs based formulations and evaluations of the penetration capacity and synergistic anti-tumor efficacy in vitro.
a. TEM image of M1EVs. Scale bar: 100 nm. b. ProteinSimple® capillary immunoassay (Wes) analysis of CD9, CD81, ALIX, TSG101, iNOS, F4/80, and GAPDH in M1 macrophages and M1EVs. c. Confocal laser scanning microscopy (CLSM) images of AQ4N-M1EVs (Top, green: M1EVs; red: AQ4N) and Ce6-M1EVs (bottom, green: M1EVs; red: Ce6). All images have the same scale of 1 μm. d. Representative flow cytometry analysis images of M1EVs (top) and TA-M1EVs (M1EVs containing AQ4N and TRMRA in place of Ce6 due to the overlayed spectrum with AQ4N) (bottom). e. Production of ROS with Ce6, CPPO/Ce6, CC-M1EVs, and CCA-M1EVs in buffers with different H2O2 concentrations, where A0 and A were the absorbance of ABDA at 399 nm before and after H2O2 addition (n = 3). f. Cumulative AQ4N release profiles of CCA-M1EVs before and after H2O2 treatment in PBS buffer (n = 3). g. Consumption of oxygen with different formulations after H2O2 treatment in PBS buffer (n = 3). h. Quantification of the AQ4/AQ4N ratio after different treatments based on high-performance liquid chromatography (HPLC) analysis. i. Illustration of in vitro BBB and TME model. The TranswellTM co-culture system containing bEnd.3 cells in the upper chamber and a combination of U87MG glioma cells and macrophages in the bottom chamber under hypoxic condition. j. CLSM images of bEnd.3 cells with different treatments. Scale bar: 5 μm. (green: ZO-1, red: EVs). k. Accumulative penetration efficiency of M1EVs, CC-M1EVs, A-M1EVs, and CCA-M1EVs labeled with DiD through a monolayer bEnd.3 layer at different time points (n = 3). l. Flow cytometry analysis of the M2/M1 ratio in the lower chamber after incubation with different EV designs (n = 3). m. Production of H2O2 with different treatments in the lower chamber (Amplex Red Hydrogen Peroxide Assay Kit) (n = 3). n. Assessment of intracellular ROS (labeled by DCFH-DA) of U87MG cells in the lower chamber (n = 3). o. Flow cytometry analysis of the cell-death-inducing effect of different formulations on U87MG cells in the lower chamber (Annexin V and PI in the dead cell apoptosis kit) (n = 3). Statistical significance was calculated via one-way ANOVA with a Kruskal-Wallis test (e, g, l, m, n, and o) or unpaired two-tailed Student’s t-test (f). ns, not significant
Fig. 4
Fig. 4. In vitro evaluation of the antitumor effects of CCA-M1EVs on multicellular tumor spheroids (MCTSs).
a. Illustration of in vitro three-dimensional tumor model. b. CLSM images of surface plots of DiD-labeled M1EVs penetration in MCTS (top); the corresponding fluorescence signal intensity across the spheroids (bottom). c. The concentrations of IL-1β, IL-6, TNF-α, and IFN-γ in supernatants prepared from the MCTS culture medium after treatments with PBS, M1EVs, CC-M1EVs, A-M1EVs, and CCA-M1EVs, respectively. d. Quantitative analysis of M2/M1 ratio of the MCTS based on flow cytometry analysis (n = 3). e. Representative flow cytometry analysis images and corresponding quantitative analysis of the intracellular levels of ROS in U87MG cells treated with different EVs designs (n = 3). f. Photographs of MCTSs at a certain time (day 0 and day 7) (left). The volume of MCTSs treated with different formulations at day 7 (right) (n = 3). All images have the same scale of 100 μm. For d, e, and f, data are presented as the mean ± S.D. Statistical significance between multiple groups was calculated using one-way ANOVA with a Kruskal-Wallis test (d, e, and f). ns, not significant
Fig. 5
Fig. 5. In vivo evaluation of the antitumor effects of CCA-M1EVs in U87MG-luc tumor-bearing mice.
a. Experimental design for evaluating the efficiency of tumor inhibition upon treatments with PBS, M1EVs, A-M1EVs, CC-M1EVs, and CCA-M1EVs in U87MG-luc tumor-bearing model mice. The mice were given the indicated formulations at day 7, 10, 13, 16, and 19. Bioluminescence intensity in the brain was determined every three days using an IVIS III instrument. 24 h after the final injection, ROS production was detected by DCFH-DA using two-photon fluorescence images and O2 concentration was measured by photoacoustic (PA). Meanwhile, some of the mice in each group were sacrificed, and brains were harvested for TME and proliferation analyses. The remaining mice were used to monitor tumor growth and survival time. b. Representative bioluminescence images of U87MG-luc tumor-bearing mice after i.v. injection with different groups at the indicated time points. The blank area means mice were dead. c. Corresponding quantification of the total flux in luciferase signals from panel (b) (n = 8). d. Survival rate of the tumor-bearing mice upon treated with different groups (n = 8). e. Immunofluorescence imaging of brain histological sections of M2 (CD163, green) and M1 (iNOS, red), and corresponding quantification of M2/M1 ratio. All images have the same scale of 50 μm (n = 6). f. Two-photon fluorescence images of U87MG-bearing mice and quantitative analysis of ROS signals in tumor tissue after different treatments. All images have the same scale of 100 μm (n = 6). g. PA images of U87MG-bearing mice and quantitative analysis of the oxyhemoglobin saturation levels in tumors (n = 6). h. Ki67 staining of tumor sections for each group, with corresponding quantification on the right. All images have the same scale of 50 μm (n = 6). For c, e, f, g, and h are presented as the mean ± S.D. Statistical significance between multiple groups was calculated using one-way ANOVA with a Kruskal-Wallis test (c, e, f, g, h). Survival analysis was calculated with two-sided Log-rank Mantel-Cox tests (d). ns, not significant
Fig. 6
Fig. 6. CCA-M1EVs exhibited potent anti-tumor effects against patient-derived xenograft (PDX) model in vivo.
a. Schematic illustration of PDX model, humanized EVs construction, and experimental design for evaluating the efficiency of tumor inhibition upon treatment with PBS, CC-M1EVs, and CCA-M1EVs (human PBMC source) in PDX mice. The mice were given the indicated formulations at day 7, 10, 13, 16 and 19. T1-weighted MR signals in the brain was determined using magnetic resonance imaging (MRI) at day 7 and 20. 24 h after the final injection, ROS production was detected by DCFH-DA using two-photon fluorescence images and O2 concentration was measured by PA. Meanwhile, some of the mice in each group were sacrificed, and brains were harvested for TME and terminal deoxynucleotidyl transferase-mediated dUTP-biotin nick end labeling (TUNEL) analyses. The remaining mice were used to monitor survival time. b. In vivo PA images and relative PA signal intensity statistics of GBM PDX mice after i.v. injection of PBS, CC-M1EVs, or CCA-M1EVs, respectively. Here, Ce6 was served as a PA signals for the assessment of the distribution of CC-M1EVs and CCA-M1EVs (n = 5). c. T1-weighted MRI of GBM PDX tumor-bearing mice at 7 day and 20 day post i.v. injection with various groups, and corresponding quantification of T1-weighted MRI from the tumor site (n = 5). Images were analyzed with Analyze 11.0. d. The body weight of the mice with different treatments (n = 5). e. Varieties of survival rates of PDX tumor-bearing mice in different groups (n = 5). f. Immunofluorescence imaging of brain histological sections of M2 (CD163, green) and M1 (iNOS, red), and corresponding quantification of M2/M1 ratio. All images have the same scale of 50 μm (n = 3). g. Two-photon fluorescence images of GBM PDX tumor-bearing mice and quantitative analysis of ROS signals in tumor tissues after i.v. injection different treatments. All images have the same scale of 100 μm (n = 3). h. PA images of GBM PDX tumor-bearing mice and quantitative analysis of the oxyhemoglobin saturation levels in tumors with treatment of different extracellular vesicle designs (n = 3). i. TUNEL staining of tumor sections for each group, with corresponding quantification (n = 3). All images have the same scale of 50 μm. For b, c, d, f, g, h, and i, data are presented as the mean ± S.D. Statistical significance between multiple groups was calculated using one-way ANOVA with a Kruskal-Wallis test (b, c, d, f, g, h, and i). Survival analysis was calculated using two-sided Log-rank Mantel-Cox tests (e). ns, not significant

References

    1. Zou Y, et al. Single siRNA Nanocapsules for Effective siRNA Brain Delivery and Glioblastoma Treatment. Adv. Mater. 2020;32:e2000416. - PubMed
    1. Wu H, et al. Sequential Targeting in Crosslinking Nanotheranostics for Tackling the Multibarriers of Brain Tumors. Adv. Mater. 2020;32:e1903759. - PMC - PubMed
    1. Zheng M, et al. ROS-Responsive Polymeric siRNA Nanomedicine Stabilized by Triple Interactions for the Robust Glioblastoma Combinational RNAi Therapy. Adv. Mater. 2019;31:e1903277. - PubMed
    1. Qiao C, et al. Rabies Virus-Inspired Metal-Organic Frameworks (MOFs) for Targeted Imaging and Chemotherapy of Glioma. Angew. Chem. 2020;59:16982–16988. - PubMed
    1. Polson, E. S. et al. KHS101 disrupts energy metabolism in human glioblastoma cells and reduces tumor growth in mice. Sci. Transl. Med. 10, eaar2718 (2018). - PubMed

Publication types

Substances