. 2022 Mar 15;13(1):1362.
doi: 10.1038/s41467-022-28896-3.

Tau deposition patterns are associated with functional connectivity in primary tauopathies

Nicolai Franzmeier #  1 Matthias Brendel #  2   3 Leonie Beyer  2 Luna Slemann  2 Gabor G Kovacs  4   5   6 Thomas Arzberger  3   7   8   9 Carolin Kurz  7   8 Gesine Respondek  7   10   11 Milica J Lukic  7   12 Davina Biel  13 Anna Rubinski  13 Lukas Frontzkowski  13 Selina Hummel  2 Andre Müller  14 Anika Finze  2 Carla Palleis  3   7   15 Emanuel Joseph  2 Endy Weidinger  15 Sabrina Katzdobler  15 Mengmeng Song  2 Gloria Biechele  2 Maike Kern  2 Maximilian Scheifele  2 Boris-Stephan Rauchmann  16 Robert Perneczky  3   7   8   17 Michael Rullman  18 Marianne Patt  18 Andreas Schildan  18 Henryk Barthel  18 Osama Sabri  18 Jost J Rumpf  2   19 Matthias L Schroeter  2   19 Joseph Classen  20 Victor Villemagne  21   22   23 John Seibyl  24   25 Andrew W Stephens  14 Edward B Lee  4 David G Coughlin  26   27 Armin Giese  9 Murray Grossman  26   28 Corey T McMillan  26   28 Ellen Gelpi  29   30 Laura Molina-Porcel  29   30 Yaroslau Compta  31 John C van Swieten  32 Laura Donker Laat  33 Claire Troakes  34 Safa Al-Sarraj  34 John L Robinson  4 Sharon X Xie  35 David J Irwin  10   28 Sigrun Roeber  9 Jochen Herms  7 Mikael Simons  7 Peter Bartenstein  2 Virginia M Lee  4 John Q Trojanowski  4 Johannes Levin  3   7   15 Günter Höglinger  7   36 Michael Ewers  13   7
Affiliations

Tau deposition patterns are associated with functional connectivity in primary tauopathies

Nicolai Franzmeier et al. Nat Commun. .

Abstract

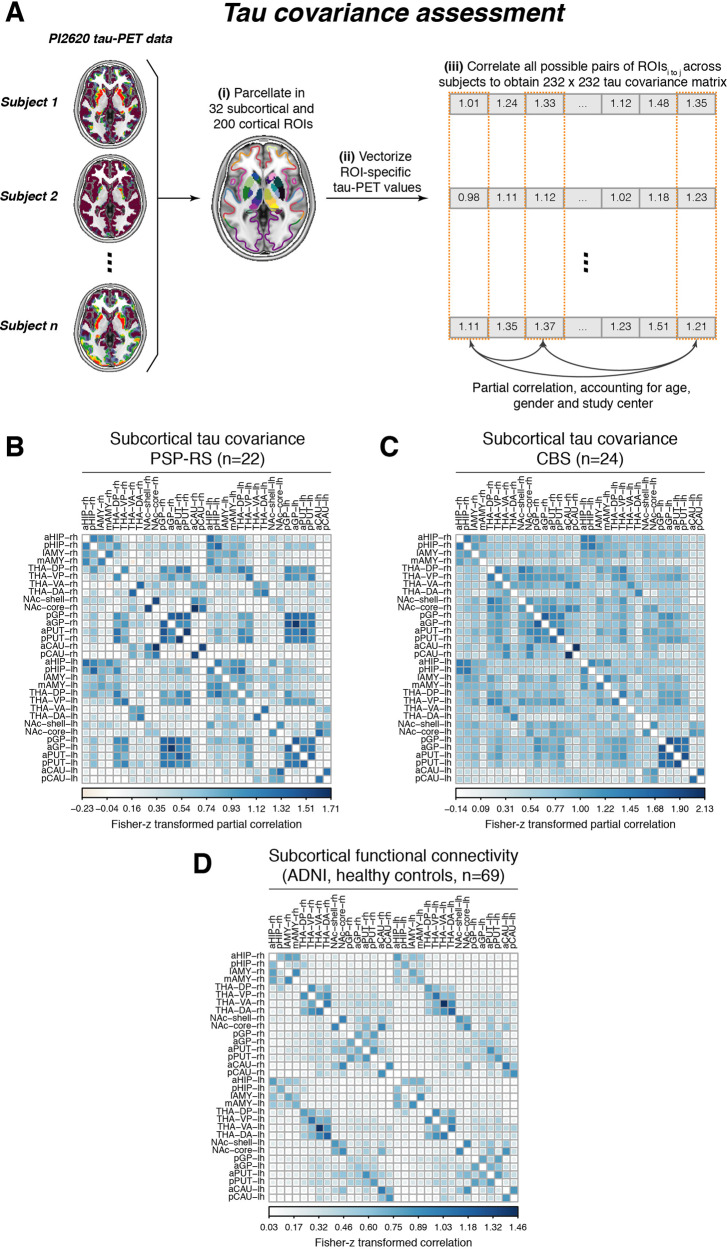
Tau pathology is the main driver of neuronal dysfunction in 4-repeat tauopathies, including cortico-basal degeneration and progressive supranuclear palsy. Tau is assumed to spread prion-like across connected neurons, but the mechanisms of tau propagation are largely elusive in 4-repeat tauopathies, characterized not only by neuronal but also by astroglial and oligodendroglial tau accumulation. Here, we assess whether connectivity is associated with 4R-tau deposition patterns by combining resting-state fMRI connectomics with both 2nd generation 18F-PI-2620 tau-PET in 46 patients with clinically diagnosed 4-repeat tauopathies and post-mortem cell-type-specific regional tau assessments from two independent progressive supranuclear palsy patient samples (n = 97 and n = 96). We find that inter-regional connectivity is associated with higher inter-regional correlation of both tau-PET and post-mortem tau levels in 4-repeat tauopathies. In regional cell-type specific post-mortem tau assessments, this association is stronger for neuronal than for astroglial or oligodendroglial tau, suggesting that connectivity is primarily associated with neuronal tau accumulation. Using tau-PET we find further that patient-level tau patterns are associated with the connectivity of subcortical tau epicenters. Together, the current study provides combined in vivo tau-PET and histopathological evidence that brain connectivity is associated with tau deposition patterns in 4-repeat tauopathies.


Conflict of interest statement

The authors declare no competing interests.

Figures

Fig. 1
Fig. 1. PI-2620 tau-PET uptake patterns in controls/patients and brain parcellation scheme.
Group-average maps of tau-PET SUVRs (i.e., intensity normalized to the inferior cerebellar gray) for controls (A), PSP-RS (B), and CBS patients (C). Voxel-wise group comparisons were conducted to compare tau-PET SUVRs between PSP-RS vs. controls (D), CBS vs. controls (E), and CBS vs. PSP-RS (F), at a voxel threshold of p < 0.005 with a cluster size of at least 100 spatially contiguous voxels. Illustration of the 200 ROI cortical (G) and 32 ROI subcortical (H) brain atlases that were used for all tau-PET vs. connectivity analyses.
Fig. 2
Fig. 2. Autoradiographic assessment of PI-2620 binding in PSP patients.
In vitro competition assay, showing stronger affinity of PI-2620 to 4R tau fibrils than the first generation tau-PET tracer Flortaucipir (A). In addition, we performed autoradiographic assessments in 233 brain samples derived from 16 patients with histopathologically confirmed PSP pathology. Samples were obtained from the frontal cortex (n = 105), pallidum (n = 56), and putamen (n = 72). AT8 staining intensity was judged by visual expert read (low = +, medium = ++, high = +++), autoradiography was quantified as the intensity of the autoradiographic signal in the target tissue divided by signal in AT8-negative white matter. Boxplot illustrating the comparisons between autoradiography signal and AT8 staining intensity are shown in B, examples of autoradiography samples and AT8 staining are shown for the frontal cortex in C, and the basal ganglia in D. Two-sided p-values have been determined via ANOVAs. Boxplots are displayed as median (center line) ± interquartile range (box boundaries) with whiskers including observations falling within the 1.5 interquartile range. Source data are provided as a Source Data file.
Fig. 3
Fig. 3. Assessment of tau covariance.
Flow-chart illustrating the assessment of tau covariance (A). Subject-level tau-PET data were parcellated into 200 cortical and 32 subcortical ROIs (i), mean tau-PET was extracted for each region of interest (ROI), vectorized to 232-element vectors and concatenated across subjects (ii). Fisher-z transformed partial correlations between inter-regional tau-PET SUVRs were determined for each group (i.e., progressive supranuclear palsy—Richardson syndrome [PSP-RS] and cortico-basal syndrome [CBS]), accounting for age, sex, and study site (iii). The resulting tau covariance matrices for the subcortical brain parcellation which was used for primary analyses is shown for PSP-RS (B) and CBS (C) patients. For the same ROIs, group-average functional connectivity was computed based on resting-state fMRI of 69 cognitively normal, amyloid and tau negative ADNI participants (D). Source data are provided as a Source Data file.
Fig. 4
Fig. 4. Association between connectivity and covariance in tau-PET.
Scatterplots illustrating the association between functional connectivity and covariance in 18-F-PI2620-PET among subcortical regions in progressive supranuclear palsy—Richardson syndrome (PSP-RS, A) and cortico-basal syndrome (CBS) groups (B), as well as among subcortical and cortical regions for PSP-RS (C) and CBS groups (D). Standardized beta- and p-values were derived from linear regression controlling for Euclidean distance between regions of interest (ROIs). Beeswarm plots illustrate the distribution of standardized beta-values derived from repeating the analysis 1000 times using scrambled connectomes with preserved weight- and degree distribution (gray points) vs. the beta-value derived from the association with the actual observed connectivity matrix that is illustrated in the scatterplot (yellow point). Two-sided p-values have been determined via linear regression. Linear model fits are indicated together with 95% confidence intervals. Source data are provided as a Source Data file.
Fig. 5
Fig. 5. Group-level epicenter connectivity vs. tau-PET patterns.
Associations between group-average subcortical 18-F-Pi-2620-PET data and seed-based functional connectivity of tau epicenters (i.e., regions with highest group-average tau) in progressive supranuclear palsy—Richardson syndrome (PSP-RS, A) and cortico-basal syndrome (CBS, B), illustrating that regions with high connectivity to the tau epicenter show high tau-PET. The same association was plotted for tau coldspots (i.e., regions with lowest tau-PET) for PSP-RS (C) and CBS (D), illustrating that regions closely connected to the tau coldspots show also low tau-PET. Standardized beta- and p-values were derived from linear regression controlling for Euclidean distance between ROIs. The analysis was repeated for all regions of interest (ROIs), and the respective seed ROIs tau-PET uptake was plotted against the regression-derived beta-value, showing that seed regions with higher tau-PET show a positive association between seed-based connectivity and tau-PET in connected regions, whereas regions with lower tau-PET show a negative association between seed-based connectivity and tau-PET in connected regions in PSP (E) and CBS (F). These findings indicate that seed ROIs are preferentially connected to other regions with similar tau-PET levels. All analyses were repeated including using the combined set of 200 cortical and 32 subcortical ROIs, showing a fully consistent result pattern across the entire brain (GL). Two-sided p-values have been determined via linear regression. Linear model fits are indicated together with 95% confidence intervals. Source data are provided as a Source Data file.
Fig. 6
Fig. 6. Subject-level epicenter connectivity vs. tau-PET patterns.
Using subject-level tau-PET data, we determined for each progressive supranuclear palsy—Richardson syndrome (PSP-RS) and cortico-basal syndrome (CBS) patient the subcortical tau epicenter (A), i.e., defined as 20% of ROIs with highest tau-PET SUVRs. The remaining regions of interest (ROIs) were grouped for each subject into quartiles, depending on connectivity strength to the subject-specific tau epicenter. Highest tau-PET was expected for regions most closely connected to the tau epicenter (i.e., quartile 1 = Q1) whereas lowest tau-PET was expected for ROIs only weakly connected to the tau epicenter. Subject-specific tau-PET data for subcortical Q1–Q4 ROIs (B, D) as well cortical Q1–Q4 ROIs (C, E) is shown, illustrating that tau-PET was highest in subcortical and cortical regions that are most closely connected to the subcortical tau epicenter (i.e., Q1), with gradual decreases across less strongly connected regions. For a subset of CBS patients (n = 22), we further stratified these analyses by above vs. below median global amyloid-PET SUVRs (i.e., subthreshold amyloid, as all subjects were amyloid negative on visual read). Amyloid-stratified analyses illustrate that above median amyloid levels were not associated with elevated tau spread from subcortical epicenters to subcortical Q1–Q4 ROIs (F), but with increased tau spread from subcortical epicenters to cortical Q1–Q4 ROIs (G). All statistical indices (i.e., b-values, standard errors and p-values) were derived from linear mixed models, controlling for age, sex, study center, mean Euclidean distance of Q1–Q4 ROIs to the tau epicenter and random intercept. A probability mapping of subcortical epicenter locations is illustrated in panels H for PSP-RS and I for CBS patients. Two-sided p-values have been determined via linear mixed effects models. Linear model fits are indicated together with 95% confidence intervals. Source data are provided as a Source Data file.
Fig. 7
Fig. 7. Connectivity vs. Post-mortem tau deposition patterns.
Association between functional connectivity and regional postmortem tau assessments (i.e., AT8 staining) in two independent samples with histopathologically confirmed progressive supranuclear palsy (PSP = . For each sample, covariance in neuronal tau levels was assessed among cortical and subcortical ROIs (A, B) using the methods illustrated in Fig. 3A, yielding a covariance in AT8-stained tau matrix of partial correlations accounting for age at death and sex. for the Munich (C) and UPENN sample (E). Using the same brain atlases (A, B), functional connectivity was determined based on resting-state fMRI data in the sample of n = 69 healthy controls from ADNI (D, F). Scatterplots illustrate the association between functional connectivity and covariance in postmortem stained neuronal tau pathology for the Munich (G, AT8 tau staining) and UPENN (H, PHF-1 tau staining) sample. Standardized beta- and p-values were derived from linear regression controlling for Euclidean distance between ROIs. Robustness of the association in panels D, E was again tested by contrasting the beta-value derived from the association between the actual functional connectivity matrix with covariance in tau against beta-values derived from the same analyses repeated a 1000 times using scrambled functional connectivity matrices with preserved degree- and weight distribution (see beeswarm plots in panels G, H). The same analysis was repeated for cell-specific tau levels (i.e., astrocyte tau, oligodendrocyte tau, neuronal tau) using 1000 bootstrapping iterations, i.e., the association between functional connectivity and covariance in cell-specific tau was repeated on 1000 randomly drawn samples. The resulting beta-value distributions are shown for the Munich (I) and UPENN (J) sample, illustrating that the association between functional connectivity and covariance in tau is strongest for neuronal tau levels. Two-sided p-values have been determined via linear models for scatterplots. Linear model fits in scatterplots are indicated together with 95% confidence intervals. Boxplots are displayed as median (center line) ± interquartile range (box boundaries) with whiskers including observations falling within the 1.5 interquartile range. Two-sided p-values in boxplots have been obtained using ANOVAs. Source data are provided as a Source Data file.

References

    1. Dickson DW, et al. Office of Rare Diseases neuropathologic criteria for corticobasal degeneration. J. Neuropathol. Exp. Neurol. 2002;61:935–946. - PubMed
    1. Flament S, Delacourte A, Verny M, Hauw JJ, Javoy-Agid F. Abnormal Tau proteins in progressive supranuclear palsy. Similarities and differences with the neurofibrillary degeneration of the Alzheimer type. Acta Neuropathol. 1991;81:591–596. - PubMed
    1. Dickson DW. Neuropathologic differentiation of progressive supranuclear palsy and corticobasal degeneration. J. Neurol. 1999;246:II6–II15. - PubMed
    1. Rosler TW, et al. Four-repeat tauopathies. Prog. Neurobiol. 2019;180:101644. - PubMed
    1. Ling H, et al. Fulminant corticobasal degeneration: a distinct variant with predominant neuronal tau aggregates. Acta Neuropathol. 2020;139:717–734. - PMC - PubMed

Publication types

MeSH terms