

Forage grass growth under future climate change scenarios affects fermentation and ruminant efficiency
- PMID: 35292703
- PMCID: PMC8924208
- DOI: 10.1038/s41598-022-08309-7
Forage grass growth under future climate change scenarios affects fermentation and ruminant efficiency
Erratum in
-
Author Correction: Forage grass growth under future climate change scenarios affects fermentation and ruminant efficiency.Sci Rep. 2022 Oct 31;12(1):18329. doi: 10.1038/s41598-022-21958-y. Sci Rep. 2022. PMID: 36316526 Free PMC article. No abstract available.
Abstract
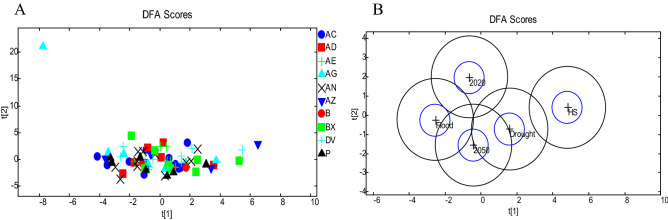
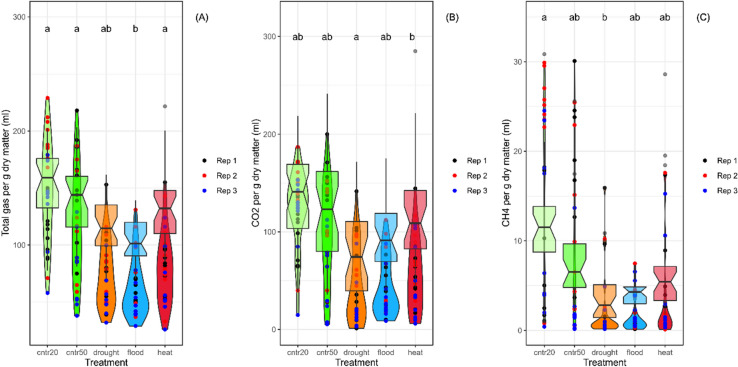
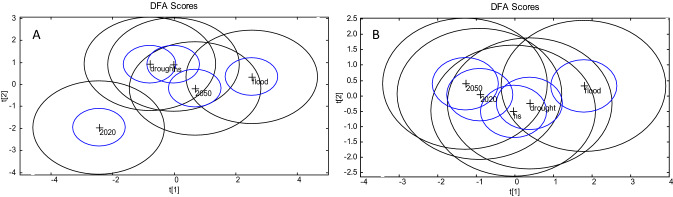
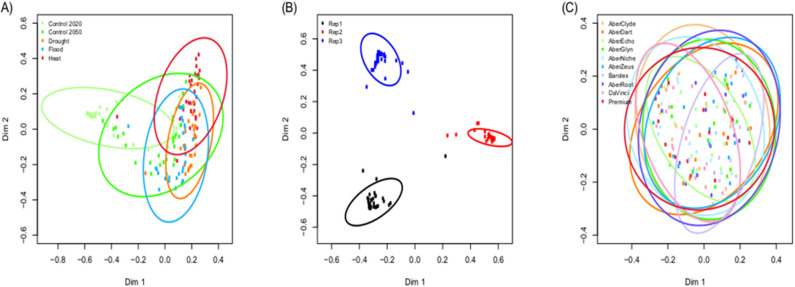
With an increasing human population access to ruminant products is an important factor in global food supply. While ruminants contribute to climate change, climate change could also affect ruminant production. Here we investigated how the plant response to climate change affects forage quality and subsequent rumen fermentation. Models of near future climate change (2050) predict increases in temperature, CO2, precipitation and altered weather systems which will produce stress responses in field crops. We hypothesised that pre-exposure to altered climate conditions causes compositional changes and also primes plant cells such that their post-ingestion metabolic response to the rumen is altered. This "stress memory" effect was investigated by screening ten forage grass varieties in five differing climate scenarios, including current climate (2020), future climate (2050), or future climate plus flooding, drought or heat shock. While varietal differences in fermentation were detected in terms of gas production, there was little effect of elevated temperature or CO2 compared with controls (2020). All varieties consistently showed decreased digestibility linked to decreased methane production as a result of drought or an acute flood treatment. These results indicate that efforts to breed future forage varieties should target tolerance of acute stress rather than long term climate.
© 2022. The Author(s).
Conflict of interest statement
The authors declare no competing interests.
Figures
Similar articles
-
Effect of camelina oil or live yeasts (Saccharomyces cerevisiae) on ruminal methane production, rumen fermentation, and milk fatty acid composition in lactating cows fed grass silage diets.J Dairy Sci. 2015 May;98(5):3166-81. doi: 10.3168/jds.2014-7976. Epub 2015 Feb 26. J Dairy Sci. 2015. PMID: 25726099
-
Modeled Changes in Potential Grassland Productivity and in Grass-Fed Ruminant Livestock Density in Europe over 1961-2010.PLoS One. 2015 May 27;10(5):e0127554. doi: 10.1371/journal.pone.0127554. eCollection 2015. PLoS One. 2015. PMID: 26018186 Free PMC article.
-
Reducing rumen starch fermentation of wheat with three percent sodium hydroxide has the potential to ameliorate the effect of heat stress in grain-fed wethers.J Anim Sci. 2017 Dec;95(12):5547-5562. doi: 10.2527/jas2017.1843. J Anim Sci. 2017. PMID: 29293755 Free PMC article.
-
Review: Adaptation of ruminant livestock production systems to climate changes.Animal. 2018 Dec;12(s2):s445-s456. doi: 10.1017/S1751731118001301. Epub 2018 Aug 24. Animal. 2018. PMID: 30092851 Review.
-
Review: Alternative and novel feeds for ruminants: nutritive value, product quality and environmental aspects.Animal. 2018 Dec;12(s2):s295-s309. doi: 10.1017/S1751731118002252. Epub 2018 Oct 15. Animal. 2018. PMID: 30318027 Review.
Cited by
-
Productivity and Feed Quality Performance of Napier Grass (Cenchrus purpureus) Genotypes Growing under Different Soil Moisture Levels.Plants (Basel). 2022 Sep 28;11(19):2549. doi: 10.3390/plants11192549. Plants (Basel). 2022. PMID: 36235418 Free PMC article.
-
Effects of a short-term temperature increase on arthropod communities associated with pastures.Biodivers Data J. 2023 Oct 5;11:e107385. doi: 10.3897/BDJ.11.e107385. eCollection 2023. Biodivers Data J. 2023. PMID: 37840604 Free PMC article.
-
Ergosterol and polyphenol contents as rapid indicators of orchardgrass silage safety.Heliyon. 2023 Mar 29;9(4):e14940. doi: 10.1016/j.heliyon.2023.e14940. eCollection 2023 Apr. Heliyon. 2023. PMID: 37064459 Free PMC article.
References
-
- FAO . Livestock & the Environment—Meeting the challenge. 7. FAO; 1997.
-
- Smith MR, Myers SS. Impact of anthropogenic CO2 emissions on global human nutrition. Nat. Clim. Change. 2018;8:834–839. doi: 10.1038/s41558-018-0253-3. - DOI
-
- Murphy JM, Brown S, Fung F. UKCP Factsheet: Probabilistic Projections of Climate Extremes. Met Office; 2020.
-
- Loka D, et al. Impacts of abiotic stresses on the physiology and metabolism of cool-season grasses: A review. Food Energy Secur. 2019;8:e00152. doi: 10.1002/fes3.152. - DOI
Publication types
MeSH terms
Substances
Grants and funding
LinkOut - more resources
Full Text Sources
Medical
