

Shared antibiotic resistance and virulence genes in Staphylococcus aureus from diverse animal hosts
- PMID: 35292708
- PMCID: PMC8924228
- DOI: 10.1038/s41598-022-08230-z
Shared antibiotic resistance and virulence genes in Staphylococcus aureus from diverse animal hosts
Abstract
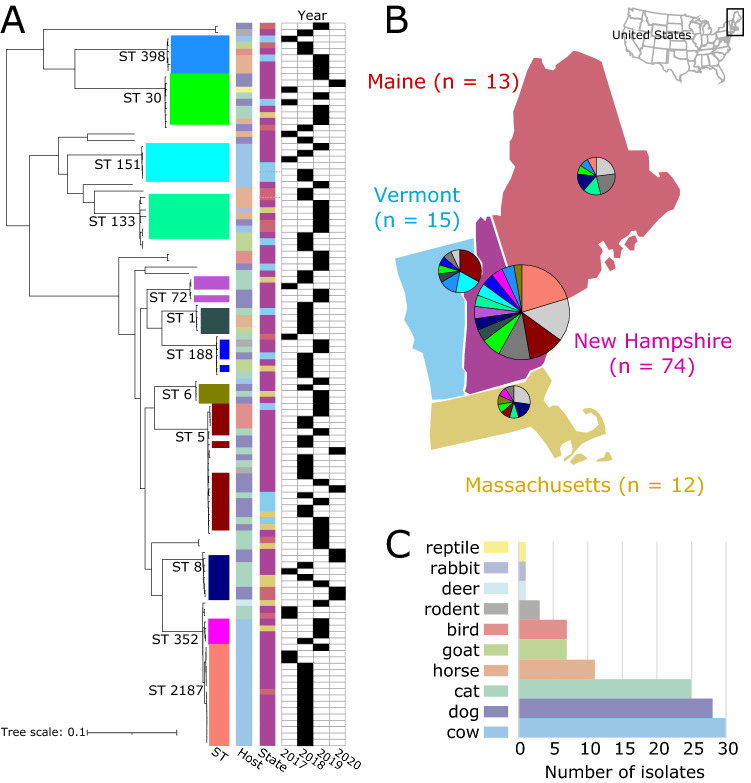
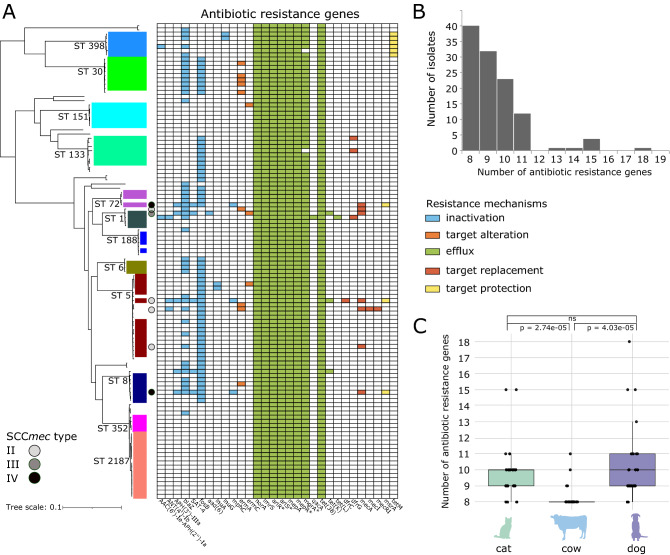
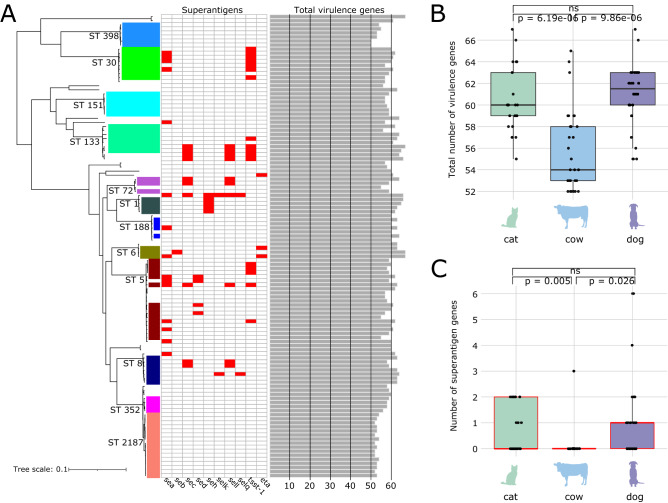
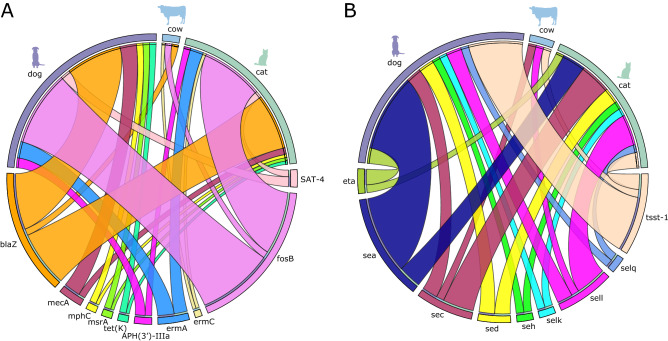
The emergence of methicillin-resistant Staphylococcus aureus (MRSA) poses an important threat in human and animal health. In this study, we ask whether resistance and virulence genes in S. aureus are homogeneously distributed or constrained by different animal hosts. We carried out whole genome sequencing of 114 S. aureus isolates from ten species of animals sampled from four New England states (USA) in 2017-2019. The majority of the isolates came from cats, cows and dogs. The maximum likelihood phylogenetic tree based on the alignment of 89,143 single nucleotide polymorphisms of 1173 core genes reveal 31 sequence types (STs). The most common STs were ST5, ST8, ST30, ST133 and ST2187. Every genome carried at least eight acquired resistance genes. Genes related to resistance found in all genomes included norA (fluoroquinolone), arlRS (fluoroquinolone), lmrS (multidrug), tet(38) (tetracycline) and mepAR (multidrug and tigecycline resistance). The most common superantigen genes were tsst-1, sea and sec. Acquired antibiotic resistance (n = 10) and superantigen (n = 9) genes of S. aureus were widely shared between S. aureus lineages and between strains from different animal hosts. These analyses provide insights for considering bacterial gene sharing when developing strategies to combat the emergence of high-risk clones in animals.
© 2022. The Author(s).
Conflict of interest statement
The authors declare no competing interests.
Figures
Similar articles
-
Genomic Insights of a Methicillin-Resistant Biofilm-Producing Staphylococcus aureus Strain Isolated From Food Handlers.Biomed Res Int. 2024 Jul 20;2024:5516117. doi: 10.1155/2024/5516117. eCollection 2024. Biomed Res Int. 2024. PMID: 39071244 Free PMC article.
-
Analysis of Virulence and Antimicrobial Resistance Gene Carriage in Staphylococcus aureus Infections in Equids Using Whole-Genome Sequencing.mSphere. 2021 Aug 25;6(4):e0019620. doi: 10.1128/mSphere.00196-20. Epub 2021 Aug 4. mSphere. 2021. PMID: 34346711 Free PMC article.
-
Prevalence, antibiotic resistance, virulence and genetic diversity of Staphylococcus aureus isolated from bulk tank milk samples of U.S. dairy herds.BMC Genomics. 2021 May 20;22(1):367. doi: 10.1186/s12864-021-07603-4. BMC Genomics. 2021. PMID: 34016049 Free PMC article.
-
Interactions between staphylococcal enterotoxins A and D and superantigen-like proteins 1 and 5 for predicting methicillin and multidrug resistance profiles among Staphylococcus aureus ocular isolates.PLoS One. 2021 Jul 28;16(7):e0254519. doi: 10.1371/journal.pone.0254519. eCollection 2021. PLoS One. 2021. PMID: 34320020 Free PMC article.
-
Genotyping of long term persistent Staphylococcus aureus in bovine subclinical mastitis.Microb Pathog. 2019 Jul;132:45-50. doi: 10.1016/j.micpath.2019.04.031. Epub 2019 Apr 20. Microb Pathog. 2019. PMID: 31015015
Cited by
-
Antimicrobial Susceptibility and Genomic Profiles of Multidrug-Resistant Staphylococcus aureus from Nasopharynx of Asymptomatic Children in Dhaka, Bangladesh.Life (Basel). 2024 Aug 2;14(8):971. doi: 10.3390/life14080971. Life (Basel). 2024. PMID: 39202713 Free PMC article.
-
Genomic Characterization of Staphylococcus aureus in Wildlife.Animals (Basel). 2023 Mar 15;13(6):1064. doi: 10.3390/ani13061064. Animals (Basel). 2023. PMID: 36978605 Free PMC article.
-
Prevalence, species identification, and antibiotic resistance of Staphylococci in dogs visiting veterinary clinics in Vietnam.PLoS One. 2025 Jul 24;20(7):e0328472. doi: 10.1371/journal.pone.0328472. eCollection 2025. PLoS One. 2025. PMID: 40705753 Free PMC article.
-
Virulence Potential and Antibiotic Susceptibility of S. aureus Strains Isolated from Food Handlers.Microorganisms. 2022 Oct 30;10(11):2155. doi: 10.3390/microorganisms10112155. Microorganisms. 2022. PMID: 36363746 Free PMC article.
-
Presence and genetic variability of Staphylococcus aureus subsp. anaerobius isolated from small ruminants in Central Europe.Sci Rep. 2025 Apr 18;15(1):13493. doi: 10.1038/s41598-025-97300-z. Sci Rep. 2025. PMID: 40251270 Free PMC article.
References
-
- Klein EY, Sun L, Smith DL, Laxminarayan R. The changing epidemiology of methicillin-resistant Staphylococcus aureus in the United States: a national observational study. Am. J. Epidemiol. 2013;177:666–674. - PubMed
-
- Fitzgerald JR. Livestock-associated Staphylococcus aureus: origin, evolution and public health threat. Trends Microbiol. 2012;20:192–198. - PubMed
Publication types
MeSH terms
Substances
Grants and funding
LinkOut - more resources
Full Text Sources
Medical
Miscellaneous
