. 2022 Mar 15;12(1):4394.
doi: 10.1038/s41598-022-08528-y.

Disrupted connectivity in the olfactory bulb-entorhinal cortex-dorsal hippocampus circuit is associated with recognition memory deficit in Alzheimer's disease model

Affiliations

Disrupted connectivity in the olfactory bulb-entorhinal cortex-dorsal hippocampus circuit is associated with recognition memory deficit in Alzheimer's disease model

Morteza Salimi et al. Sci Rep. .

Abstract

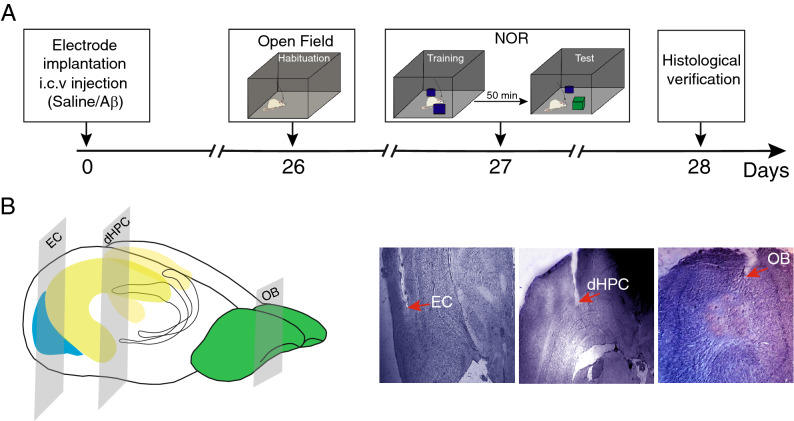
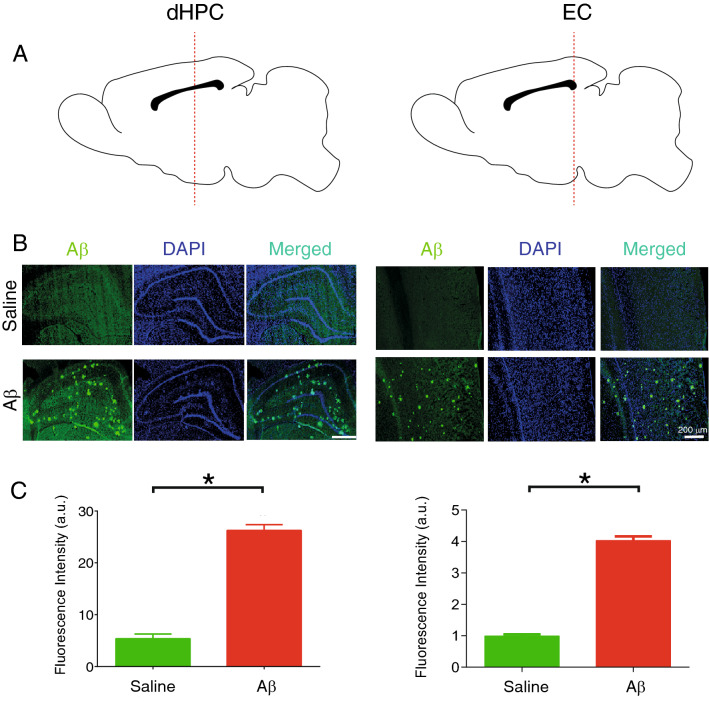
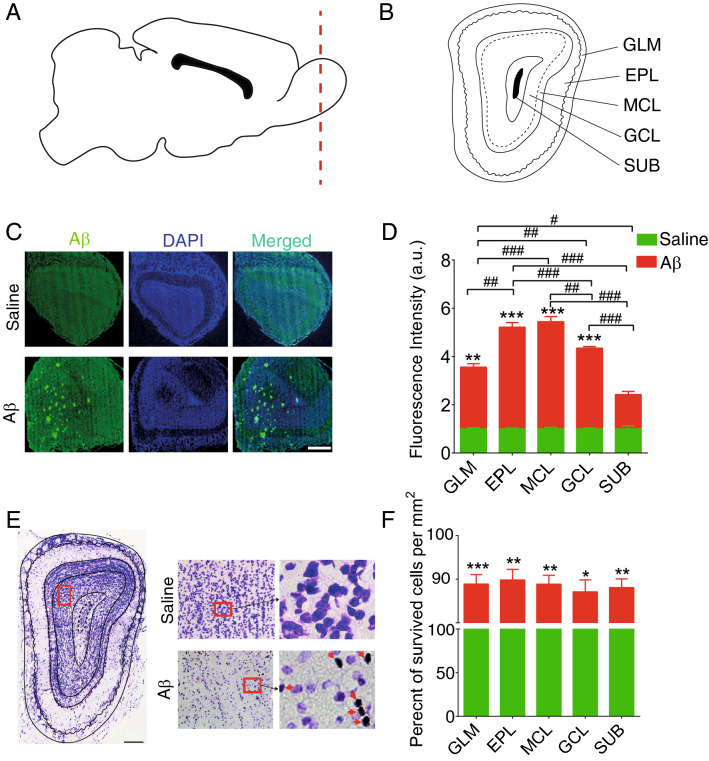
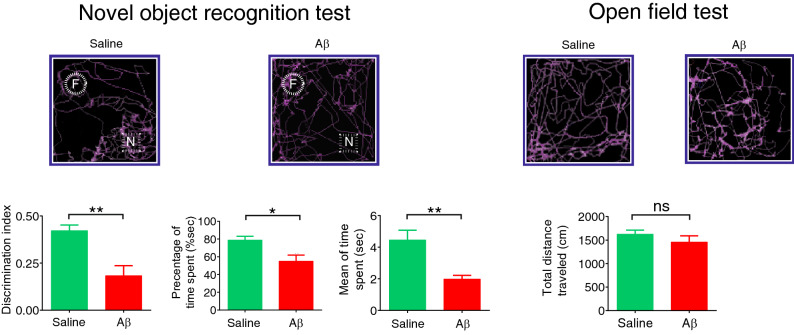
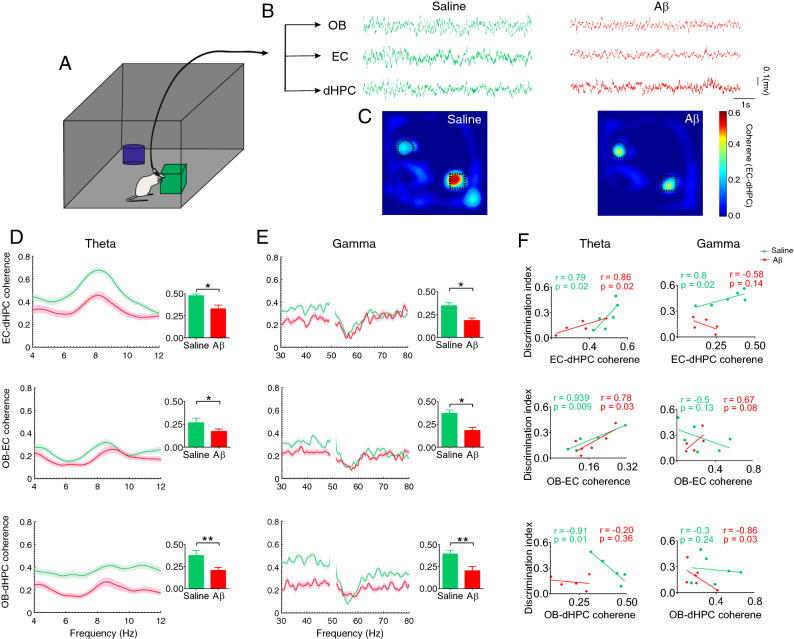
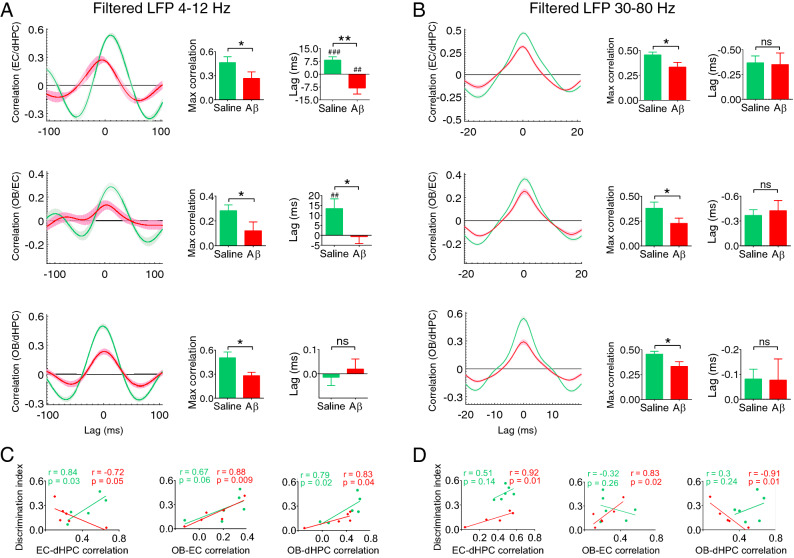
Neural synchrony in brain circuits is the mainstay of cognition, including memory processes. Alzheimer's disease (AD) is a progressive neurodegenerative disorder that disrupts neural synchrony in specific circuits, associated with memory dysfunction before a substantial neural loss. Recognition memory impairment is a prominent cognitive symptom in the early stages of AD. The entorhinal-hippocampal circuit is critically engaged in recognition memory and is known as one of the earliest circuits involved due to AD pathology. Notably, the olfactory bulb is closely connected with the entorhinal-hippocampal circuit and is suggested as one of the earliest regions affected by AD. Therefore, we recorded simultaneous local field potential from the olfactory bulb (OB), entorhinal cortex (EC), and dorsal hippocampus (dHPC) to explore the functional connectivity in the OB-EC-dHPC circuit during novel object recognition (NOR) task performance in a rat model of AD. Animals that received amyloid-beta (Aβ) showed a significant impairment in task performance and a marked reduction in OB survived cells. We revealed that Aβ reduced coherence and synchrony in the OB-EC-dHPC circuit at theta and gamma bands during NOR performance. Importantly, our results exhibit that disrupted functional connectivity in the OB-EC-dHPC circuit was correlated with impaired recognition memory induced by Aβ. These findings can elucidate dynamic changes in neural activities underlying AD, helping to find novel diagnostic and therapeutic targets.


Conflict of interest statement

The authors declare no competing interests.

Figures

Figure 1
Figure 1
Experimental protocol and histological verification. (A) Schematic representation of the study timeline. Animals received bilateral i.c.v injection of saline or Aβ 4 μg in 2 μl. After recovery from surgery and model induction, animals were placed in the open field for habituation at day 26 and NOR task, with one day apart. (B) 3D view of electrode implantation sites on the brain and histological confirmation. i.c.v, intracerebroventricular; amyloid-beta, NOR novel object recognition, OB olfactory bulb, dHPC dorsal hippocampus, EC entorhinal cortex.
Figure 2
Figure 2
Aβ plaques accumulation in regions of interest of AD model animals. (A) Schematic sections for immunostaining in the dHPC and EC (B) Immunostaining sections from animals received i.c.v saline and Aβ. Immunostaining of anti-Aβ1-42 indicated a high level of plaque accumulation in Aβ animals compared to the saline group. (C) Fluorescence intensity (a.u.) is significantly higher in Aβ animals compared to the saline group. White bar scale indicating 200 µm. amyloid-beta, AD Alzheimer’s disease, DAPI, 4′,6-diamidino-2-phenylindole; dHPC dorsal hippocampus; a.u., arbitrary units.
Figure 3
Figure 3
Survived cells in the OB. (A and B) Schematic representation of OB subregions. (C) a sample of immunostaining sections from OB of animals that received i.c.v. saline and Aβ. (D) Immunostaining of anti-Aβ1-42 indicated a high level of plaque accumulation in Aβ animals compared to the saline group. (E) Representative of OB section stained by Nissl method to evaluate the survived cells in OB subregions. (F) Aβ animals demonstrate significantly lower survival cells in this region compared to the saline group. Red arrows show dense bodies of dead cells. amyloid-beta, OB olfactory bulb, GCL granule cell layer, GLM glomerular layer, EPL external plexiform layer, MCL mitral cell layer, SUB subependymal layer, *p < 0.05, **p < 0.01, ***p < 0.001 compared to saline. #p < 0.05, ##p < 0.01, ###p < 0.001 comparision among OB subregions in Aβ group.
Figure 4
Figure 4
Aβ animals showed recognition memory impairment. (Left) Top panels indicate tracking points during the NOR task. The bottom panels denote that the preference ratio for the novel object was significantly attenuated in Aβ animals, measured by discrimination index, percentage by time spent, and mean of time spent. (Right) Aβ and saline animals showed no significant differences in the total traveled distance as an indicator of locomotor activity. Bar graphs represent mean ± SEM. The comparison was conducted by t-test, n = 6 per group. *p < 0.05, **p < 0.01, ***p < 0.001, ****p < 0.0001 Aβ compared to saline. amyloid-beta, F familiar object, N novel object, NOR novel object recognition.
Figure 5
Figure 5
Aβ reduced coherence in the OB-EC-dHPC circuit during recognition memory performance. (A) A schematic illustration of the rat while exploring the novel object. (B) A representative sample of signals when animals performed NOR tasks. (C) A sample of EC-dHPC coherence on maze during the task. LFPs are binned into the positional frame, and the mean pixel coherence is color-coded to illustrate coherence on the maze. Darker color indicates enhanced coherence beside the novel object. (D and E) Coherence spectral in OB-EC-dHPC circuit at theta and gamma frequency bands, respectively. Compared to the saline group, Aβ animals showed a significant reduction in the coherence at both theta and gamma. (F) Correlation between recognition memory performance and OB-EC-dHPC coherence. NOR task performance (measure with discrimination index) was correlated with coherence in the OB-EC-dHPC circuit. At theta band, the correlation between NOR performance and coherence in EC-dHPC and OB-EC was positive for both groups and negative in OB-dHPC for the saline group. At the gamma band, the correlation between NOR performance and coherence in EC-dHPC was positive in the saline group. Also, in OB-EC and OB-dHPC circuits, this correlation was positive and negative for Aβ animals, respectively. Lines display the mean of coherence, and the shaded area represents SEM. Bar graphs are generated by mean values of coherence. Comparisons were made by t-test and Pearson correlation coefficients. For Pearson correlation, data were assessed regarding outliers. n = 6 per group. *p < 0.05, **p < 0.01. amyloid-beta, OB olfactory bulb, EC entorhinal cortex, dHPC dorsal hippocampus, LFP local field potential, NOR novel object recognition.
Figure 6
Figure 6
Aβ disrupts synchrony in the OB-EC-dHPC circuit during recognition memory performance. (A and B) Mean correlation in time lag at theta and gamma bands, respectively. The network correlation in Aβ animals decreased at both theta and gamma ranges compared to the saline group. A reduction was found at the theta band for information influx lag from OB to EC and EC to dHPC in Aβ animals. Moreover, Aβ animals showed an inverted direction of information influx from OB to EC and EC to dHPC at theta band. (C and D) Correlation between task performance and synchrony at theta and gamma bands, respectively. A correlation was found between NOR performance and synchrony in the OB-EC-dHPC circuit at theta and gamma bands. At theta band, NOR performance was positively correlated with OB-dHPC and OB-EC synchrony for both groups. Also, in the EC-dHPC circuit, this correlation was negative and positive for Aβ animals and the saline group, respectively. At the gamma band, the correlation was negative between NOR performance and circuits for Aβ animals. Lines display the mean of correlation coefficient across the lag, and the shaded area represents SEM. Bar graphs are generated by an average of maximum coefficient and lag values for cross-correlation. Comparisons were conducted by t-test and Pearson correlation coefficients. n = 6 per group. For Pearson correlation, data were assessed regarding outliers. *p < 0.05, **p < 0.01; ns, not significant. ##p < 0.01, ###p < 0.001 according to one-sample t-test comparison with the constant value of zero. amyloid-beta, OB olfactory bulb, EC entorhinal cortex, dHPC dorsal hippocampus, NOR novel object recognition.

Similar articles

Cited by

References

    1. Prince MJ, et al. World Alzheimer Report 2015-The Global Impact of Dementia: An analysis of prevalence, Incidence, Cost and Trends. Alzheimer's Disease International; 2015.
    1. Knopman DS, et al. Alzheimer disease. Nat. Rev. Dis. Prim. 2021;7:33. doi: 10.1038/s41572-021-00269-y. - DOI - PMC - PubMed
    1. 2015 Alzheimer's disease facts and figures. Alzheimers Dement11, 332–384, 10.1016/j.jalz.2015.02.003 (2015). - PubMed
    1. Goldstein FC, Loring DW, Thomas T, Saleh S, Hajjar I. Recognition memory performance as a cognitive marker of prodromal Alzheimer’s disease. J. Alzheimers Dis. 2019;72:507–514. doi: 10.3233/JAD-190468. - DOI - PubMed
    1. Russo MJ, et al. Usefulness of discriminability and response bias indices for the evaluation of recognition memory in mild cognitive impairment and Alzheimer disease. Dement. Geriatr. Cogn. Disord. 2017;43:1–14. doi: 10.1159/000452255. - DOI - PubMed

Publication types

Substances