

Conventional GnRH antagonist protocols versus long GnRH agonist protocol in IVF/ICSI cycles of polycystic ovary syndrome women: a systematic review and meta-analysis
- PMID: 35292717
- PMCID: PMC8924277
- DOI: 10.1038/s41598-022-08400-z
Conventional GnRH antagonist protocols versus long GnRH agonist protocol in IVF/ICSI cycles of polycystic ovary syndrome women: a systematic review and meta-analysis
Abstract
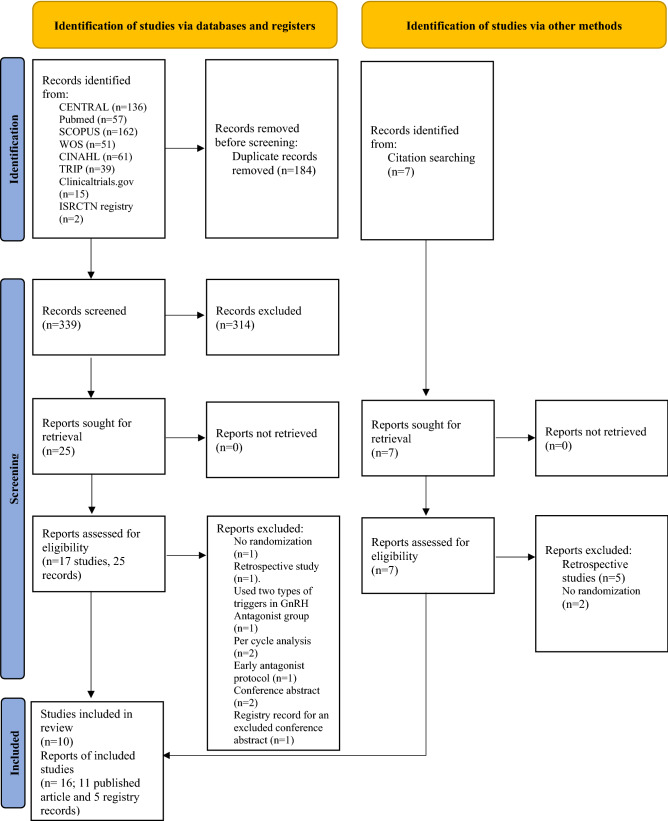
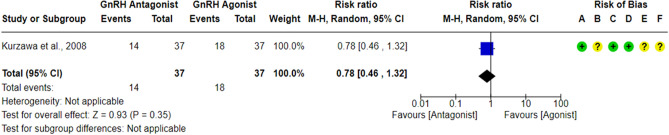
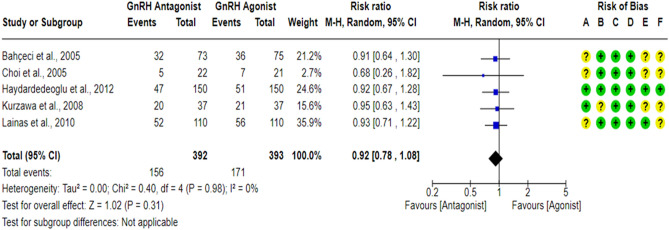
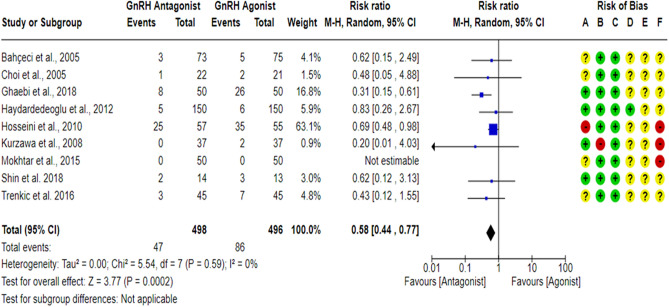
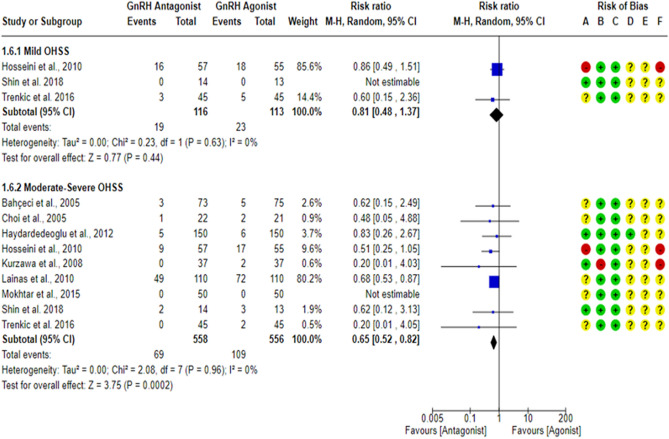
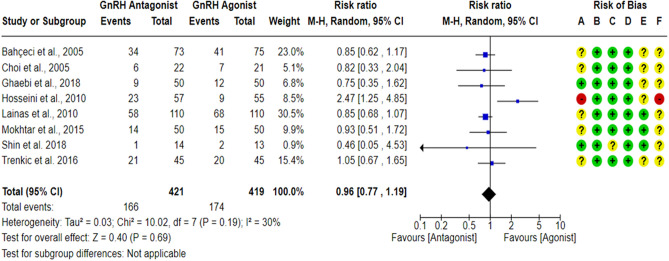
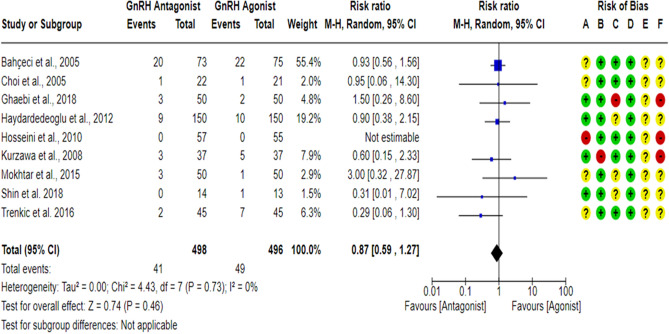
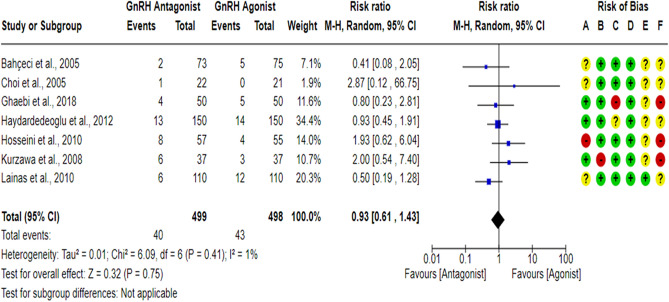
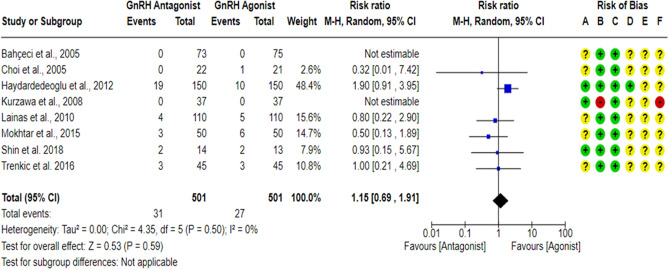
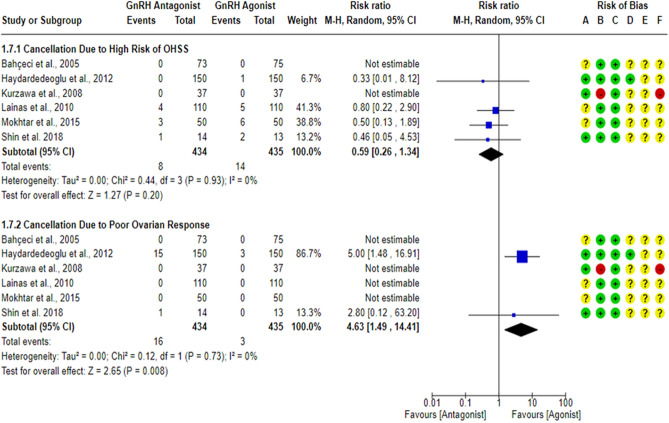
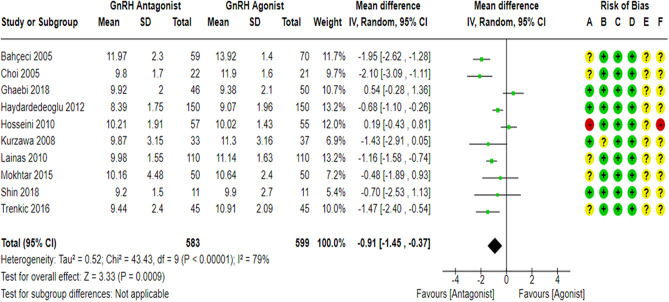
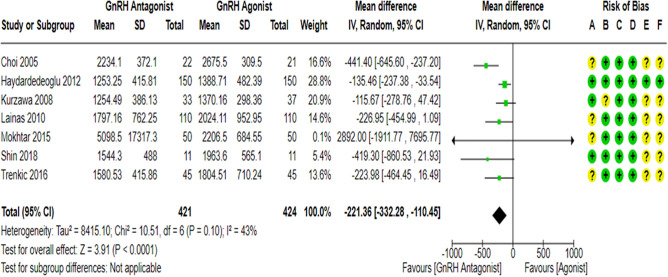
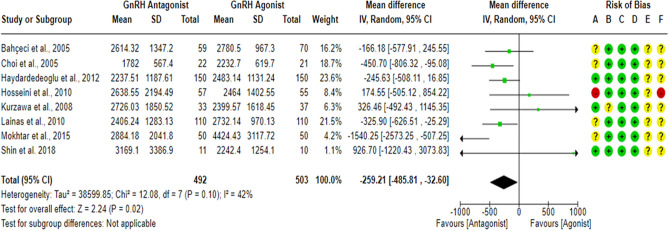
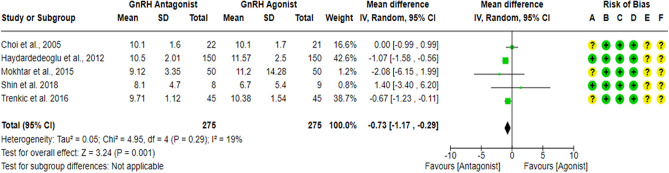
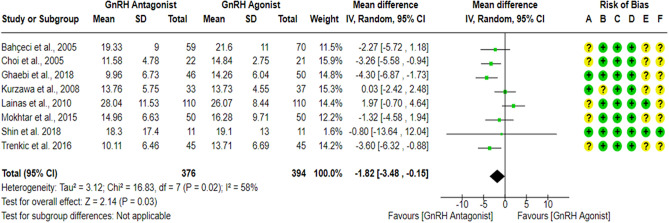
Gonadotropin-releasing hormone (GnRH) analogues are commonly used in clinical practice to prevent premature luteinizing hormone (LH) surge during In-Vitro Fertilization/ Intra-Cytoplasmic Sperm Injection (IVF/ICSI) cycles. This review aimed to summarize the available evidence comparing the effects of conventional GnRH antagonist protocols, the most commonly used GnRH antagonist protocols, and GnRH agonist protocols on IVF/ICSI outcomes in women with polycystic ovary syndrome (PCOS). A comprehensive electronic search was carried out in Pubmed, Cochrane CENTRAL, Scopus, Web of Science, CINAHL, TRIP, ClinicalTrials.gov and ISRCTN registry from inception until 24 November 2020 without any language or date restrictions. In addition, reference lists of eligible studies and previous meta-analyses were hand-searched to identify relevant studies. Eligible randomized controlled trials were those designed to compare the effects of conventional GnRH antagonist protocols and GnRH agonist protocols on IVF/ICSI outcomes in PCOS subjects. The Cochrane ROB 2.0 tool was used to assess the risk of bias of each study, and the GRADE assessment was used to evaluate the overall quality of evidence. Data synthesis and analyses were done using Review Manager 5.3 with the assistance of Revman Web. A random-effects model was used for all meta-analysis. Dichotomous outcomes were reported as Relative Risk (RR) and continuous outcomes as Weighted Mean Difference (WMD), both with 95% CIs. The primary outcomes were Live birth rate, Ongoing pregnancy rate, and Ovarian hyperstimulation syndrome (OHSS) rate. Other IVF outcomes were considered secondary outcomes. We included ten studies with 1214 randomized PCOS women. Using GnRH antagonist protocols led to a significantly lower OHSS rate (RR = 0.58; 95% CI: [0.44 to 0.77], P = 0.0002), shorter stimulation duration (WMD = - 0.91; 95% CI: [-1.45 to - 0.37] day, P = 0.0009), lower gonadotropin consumption (WMD = - 221.36; 95% CI: [- 332.28 to - 110.45] IU, P < 0.0001), lower E2 levels on hCG day (WMD = - 259.21; 95% CI: [- 485.81 to - 32.60] pg/ml, P = 0.02), thinner endometrial thickness on hCG day (WMD = - 0.73; 95% CI: [- 1.17 to - 0.29] mm, P = 0.001), and lower number of retrieved oocytes (WMD = - 1.82; 95% CI: [- 3.48 to - 0.15] oocytes, P = 0.03). However, no significant differences in live birth rate, ongoing pregnancy rate, clinical pregnancy rate, multiple pregnancy rate, miscarriage rate and cycle cancellation rate were seen between the GnRH antagonist protocols and the long GnRH agonist one. Although more cycles were cancelled due to poor ovarian response in the GnRH antagonist protocol (RR = 4.63; 95% CI: [1.49 to 14.41], P = 0.008), similar rates of cancellation due to risk of OHSS were noticed in both groups. The differences in IVF/ICSI outcomes may arise from the different patterns of gonadotropins suppression that the GnRH analogues exhibit during the early follicular phase of IVF/ICSI cycles and the divergent direct impacts of these analogues on ovaries and endometrial receptivity. The main evidence limitation was Imprecision. Conventional GnRH antagonist protocols represent a safer and more cost-effective treatment choice for PCOS women undergoing IVF/ICSI cycles than the standard long GnRH agonist protocol without compromising the IVF/ICSI clinical outcomes. The study had no sources of financial support and was prospectively registered at PROSPERO (International Prospective Register of Systematic Reviews) under registration number (CRD42021242476).
© 2022. The Author(s).
Conflict of interest statement
The authors declare no competing interests.
Figures
Similar articles
-
GnRH antagonist versus long agonist protocols in IVF: a systematic review and meta-analysis accounting for patient type.Hum Reprod Update. 2017 Sep 1;23(5):560-579. doi: 10.1093/humupd/dmx017. Hum Reprod Update. 2017. PMID: 28903472
-
Metformin treatment before and during IVF or ICSI in women with polycystic ovary syndrome.Cochrane Database Syst Rev. 2020 Dec 21;12(12):CD006105. doi: 10.1002/14651858.CD006105.pub4. Cochrane Database Syst Rev. 2020. PMID: 33347618 Free PMC article.
-
Risk of severe ovarian hyperstimulation syndrome in GnRH antagonist versus GnRH agonist protocol: RCT including 1050 first IVF/ICSI cycles.Hum Reprod. 2016 Jun;31(6):1253-64. doi: 10.1093/humrep/dew051. Epub 2016 Apr 8. Hum Reprod. 2016. PMID: 27060174 Clinical Trial.
-
Long-term GnRH agonist therapy before in vitro fertilisation (IVF) for improving fertility outcomes in women with endometriosis.Cochrane Database Syst Rev. 2019 Nov 20;2019(11):CD013240. doi: 10.1002/14651858.CD013240.pub2. Cochrane Database Syst Rev. 2019. PMID: 31747470 Free PMC article.
-
A modified flexible GnRH antagonist protocol using antagonist early cessation and a gonadotropin step-down approach improves live birth rates in fresh cycles: a randomized controlled trial.Hum Reprod. 2024 Sep 1;39(9):1969-1978. doi: 10.1093/humrep/deae145. Hum Reprod. 2024. PMID: 38942602 Clinical Trial.
Cited by
-
Live Birth Outcomes for PCOS Patients Under the Follicular-Phase Long-Acting GnRH Agonist Protocol or Antagonist Protocol - A Retrospective Chinese Cohort.J Multidiscip Healthc. 2023 Sep 20;16:2781-2792. doi: 10.2147/JMDH.S432936. eCollection 2023. J Multidiscip Healthc. 2023. PMID: 37753342 Free PMC article.
-
Minimising OHSS in women with PCOS.Front Endocrinol (Lausanne). 2025 Mar 13;16:1507857. doi: 10.3389/fendo.2025.1507857. eCollection 2025. Front Endocrinol (Lausanne). 2025. PMID: 40182629 Free PMC article. Review.
-
The impact of different ovarian stimulation protocols on the expression levels of GDF-9 and BMP-15 in cumulus cells of follicles.Front Endocrinol (Lausanne). 2025 Jun 4;16:1572388. doi: 10.3389/fendo.2025.1572388. eCollection 2025. Front Endocrinol (Lausanne). 2025. PMID: 40535347 Free PMC article.
-
The clinical application value of gonadotropin-releasing hormone antagonist combined with low-dose HCG regimen in patients with ovarian hyper-stimulation based on clinical characteristics and laboratory indicators.Am J Transl Res. 2023 Aug 15;15(8):5477-5485. eCollection 2023. Am J Transl Res. 2023. PMID: 37692927 Free PMC article.
-
Development and validation of a prediction model for suboptimal ovarian response in polycystic ovary syndrome (PCOS) patients undergoing GnRH-antagonist protocol in IVF/ICSI cycles.J Ovarian Res. 2024 May 28;17(1):116. doi: 10.1186/s13048-024-01437-w. J Ovarian Res. 2024. PMID: 38807145 Free PMC article.
References
-
- Azziz R, et al. Polycystic ovary syndrome. Nat. Rev. Dis. Primers. 2016;2:16057. - PubMed
Publication types
MeSH terms
Substances
LinkOut - more resources
Full Text Sources
Medical
