. 2022 Mar;24(3):299-306.
doi: 10.1038/s41556-022-00852-9. Epub 2022 Mar 15.

Pseudouridine-modified tRNA fragments repress aberrant protein synthesis and predict leukaemic progression in myelodysplastic syndrome

Affiliations

Pseudouridine-modified tRNA fragments repress aberrant protein synthesis and predict leukaemic progression in myelodysplastic syndrome

Nicola Guzzi et al. Nat Cell Biol. 2022 Mar.

Abstract

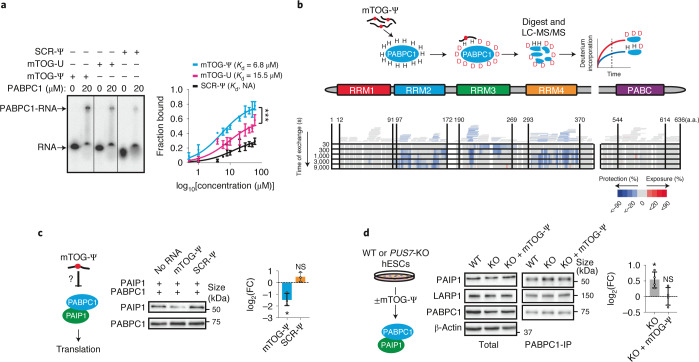
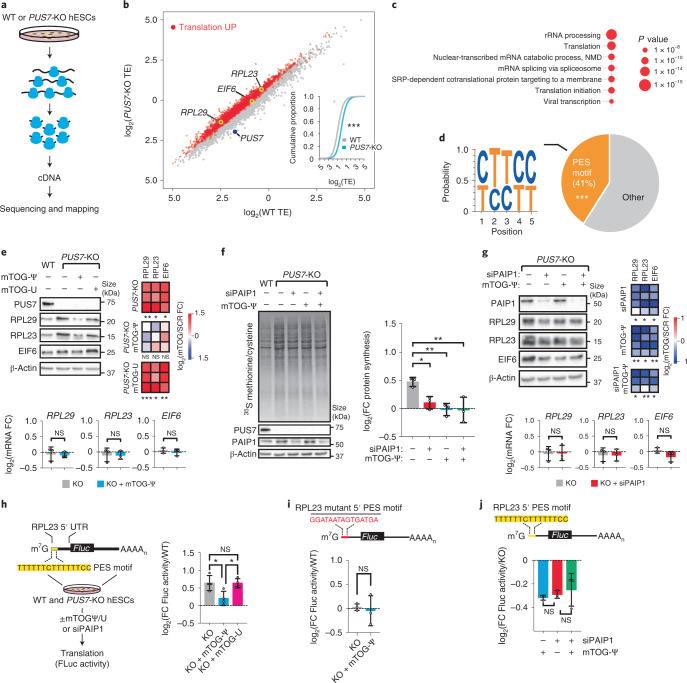
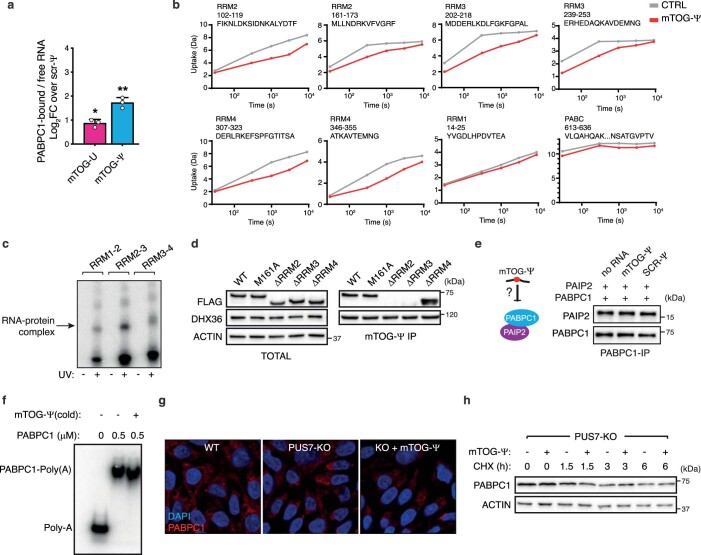
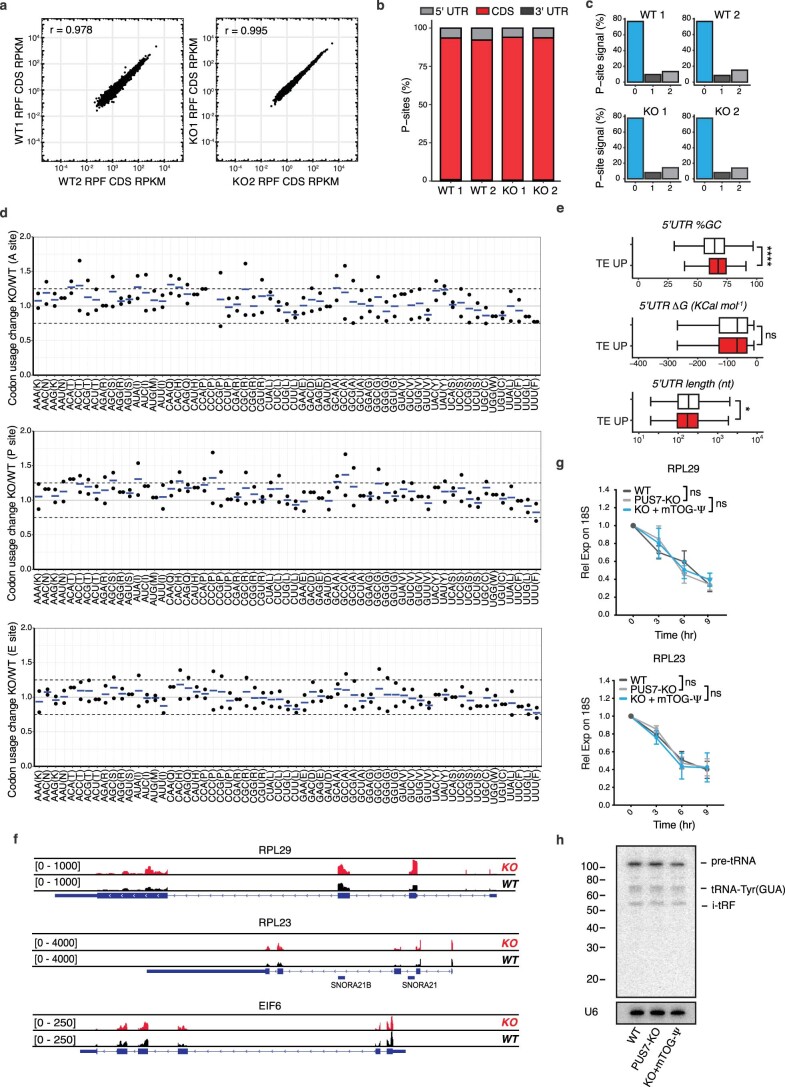
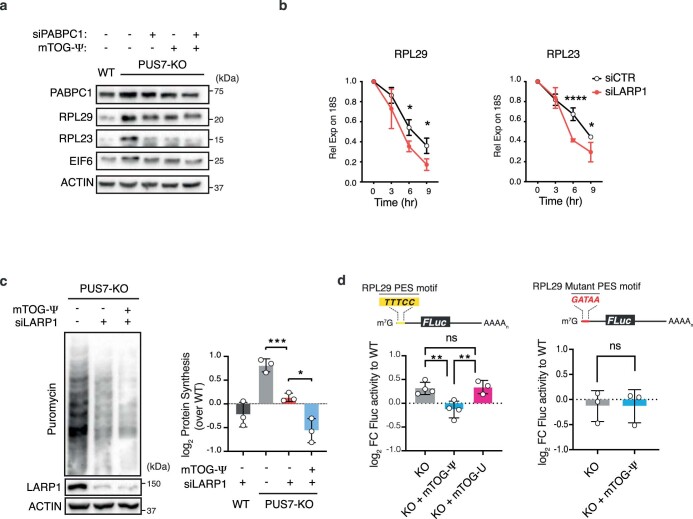
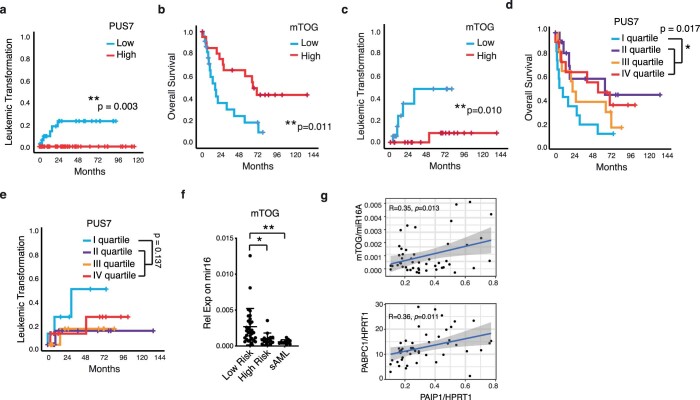
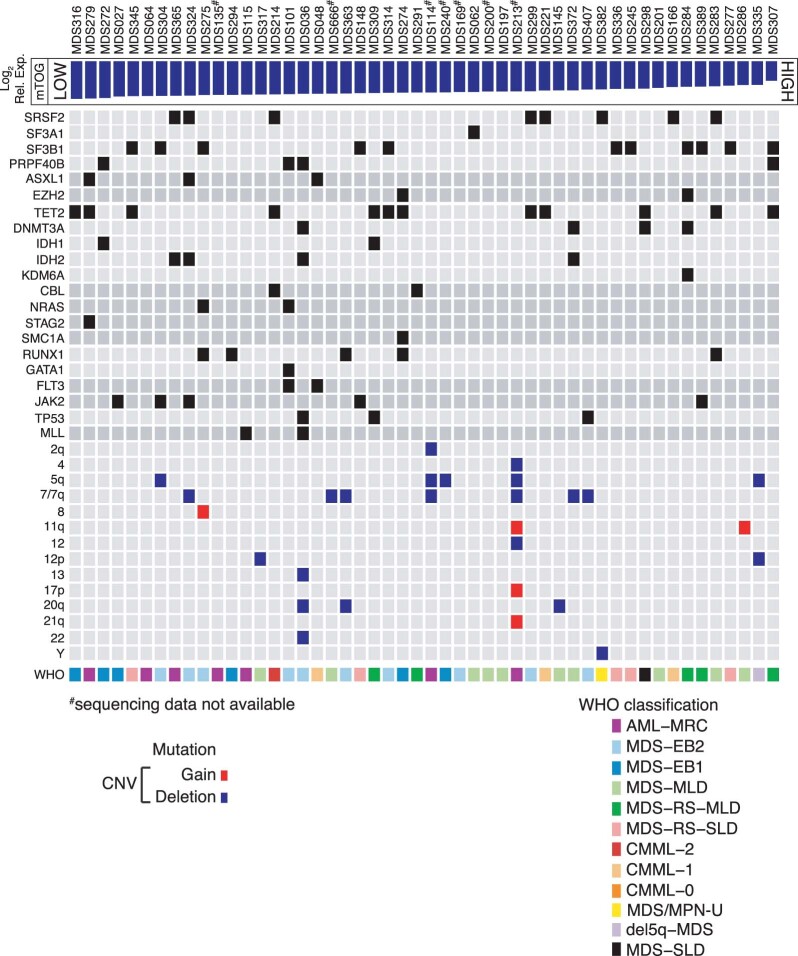
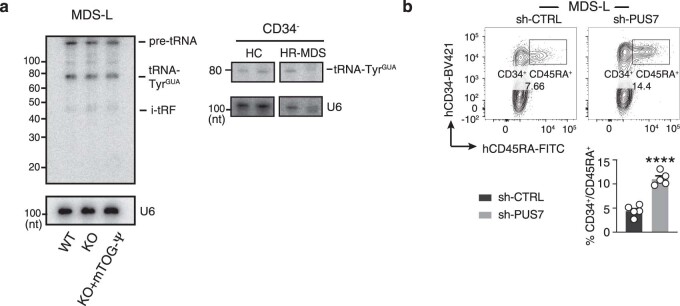
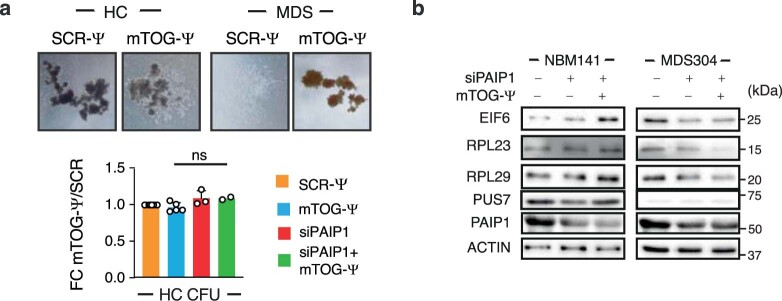
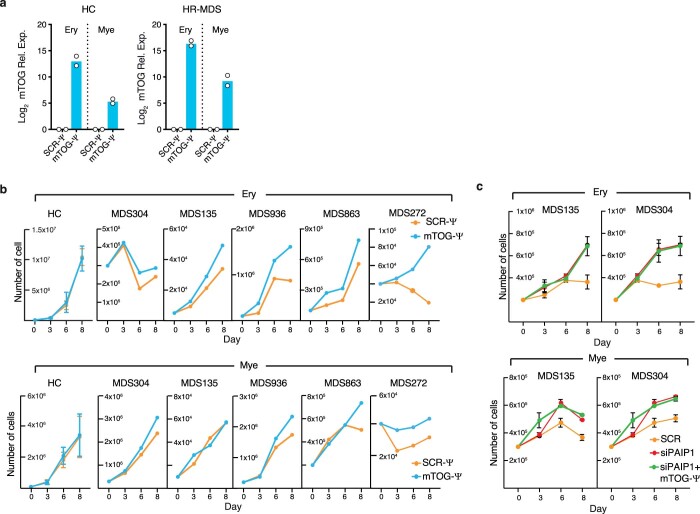
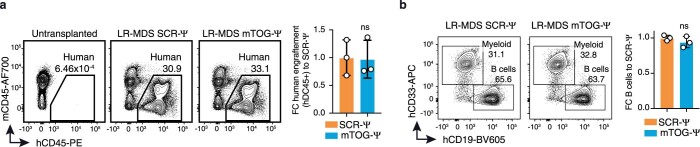
Transfer RNA-derived fragments (tRFs) are emerging small noncoding RNAs that, although commonly altered in cancer, have poorly defined roles in tumorigenesis1. Here we show that pseudouridylation (Ψ) of a stem cell-enriched tRF subtype2, mini tRFs containing a 5' terminal oligoguanine (mTOG), selectively inhibits aberrant protein synthesis programmes, thereby promoting engraftment and differentiation of haematopoietic stem and progenitor cells (HSPCs) in patients with myelodysplastic syndrome (MDS). Building on evidence that mTOG-Ψ targets polyadenylate-binding protein cytoplasmic 1 (PABPC1), we employed isotope exchange proteomics to reveal critical interactions between mTOG and functional RNA-recognition motif (RRM) domains of PABPC1. Mechanistically, this hinders the recruitment of translational co-activator PABPC1-interacting protein 1 (PAIP1)3 and strongly represses the translation of transcripts sharing pyrimidine-enriched sequences (PES) at the 5' untranslated region (UTR), including 5' terminal oligopyrimidine tracts (TOP) that encode protein machinery components and are frequently altered in cancer4. Significantly, mTOG dysregulation leads to aberrantly increased translation of 5' PES messenger RNA (mRNA) in malignant MDS-HSPCs and is clinically associated with leukaemic transformation and reduced patient survival. These findings define a critical role for tRFs and Ψ in difficult-to-treat subsets of MDS characterized by high risk of progression to acute myeloid leukaemia (AML).


Conflict of interest statement

C.B. is founder and member of the scientific advisory board of SACRA Therapeutics. S.M. is a founder and Chief Executive Officer of SACRA Therapeutics. All the other authors declare no competing interests.

Figures

Fig. 1
Fig. 1. Molecular characterization of mTOG-Ψ PABPC1 binding reveals impairments in PAIP1 translation enhancer recruitment.
a, Electrophoretic mobility shift assay showing direct interaction between mTOG-Ψ and PABPC1 (left). Unmodified mTOG (mTOG-U) and SCR-Ψ oligos are shown for comparison. Michaelis–Menten binding curve showing increased PABPC1 affinity for mTOG-Ψ (right). The fraction of RNA bound to PABPC1 is shown at increasing PABPC1 concentration. Data are the mean ± s.d. Kd, dissociation constant; NA, not applicable. ***P = 0.0006, nonlinear regression; n = 3 biologically independent experiments. b, Schematic of the HDX-MS approach to delineate the molecular interactions between mTOG-Ψ and PABPC1 (top). The heat map shows difference in maximum deuterium (D) uptake ± mTOG-Ψ at different time points (bottom). Regions of PABPC1 protected or exposed from solvent exchange in the presence of mTOG-Ψ are shown in blue and red, respectively. Peptide coverage for PABPC1 is illustrated by bars above the heat map and is colour-coded based on the average deuterium uptake across all time points. Numbers correspond to the amino acid (a.a.) residues in PABPC1. LC-MS/MS, liquid chromatography with tandem mass spectrometry. c, The PAIP1–PABPC1 interaction is inhibited by mTOG-Ψ. Recombinant PABPC1 and PAIP1 were incubated in the presence or absence of mTOG-Ψ (left). The fraction of PAIP1 that co-precipitated with PABPC1 was determined by western blotting (middle) and quantified (right) as the log2-transformed FC of the PAIP1 fraction co-precipitated with PABPC1 (mean ± s.d.) in mTOG-Ψ or SCR-Ψ conditions normalized to control samples without RNA. *P = 0.0415; and NS, not significant; two-tailed Welch’s t-test; n = 3 biologically independent experiments. d, PAIP1 recruitment to PABPC1 in hESCs is impaired by mTOG-Ψ. Endogenous PABPC1 was immunoprecipitated in WT and PUS7-KO hESCs ± mTOG-Ψ (middle; schematic of the experiment on the left). LARP1 was used as a control. The level PAIP1 co-immunoprecipitation (mean ± s.d.), normalized to the WT, was determined (right). *P = 0.0286; and NS, not significant; two-tailed Mann–Whitney U test; n = 4 biologically independent experiments. Source data
Fig. 2
Fig. 2. mTOG-Ψ controls the translation of select 5′ PES-containing mRNA subsets in a PAIP1–PABPC1-dependent manner.
a,b, Transcriptome-wide analysis of TE in WT and PUS7-KO hESCs. a, Schematic of the ribosome profiling experiment. b, The 2,459 transcripts with log2(TE FC) > 1 and FDR < 0.2 are coloured (red). Inset: cumulative distribution of log2(TE) values for WT and PUS7-KO hESCs. ***P < 2.2 × 10−16; two-sided Wilcoxon signed-rank test. c, Gene ontology analysis of translationally upregulated mRNAs in PUS7-KO cells. d, Motif analysis (left) and pie chart (right) showing enrichment for 5′ PES scored within the first ten nucleotides from the transcription start site in translationally upregulated mRNAs. ***P < 0.001, hypergeometric test. e, Representative protein analysis of 5′ PES candidate genes from ribosome profiling in WT and PUS7-KO hESCs ± mTOG-Ψ or mTOG-U (top left). The heat maps show the FC in protein abundance (mTOG-Ψ or mTOG-U) relative to the WT (SCR-Ψ; top right); one-tailed Student’s t-test. RPL29, RPL23 and EIF6 mRNA levels in PUS7-KO hESCs ± mTOG-Ψ relative to the WT (bottom); one-way analysis of variance (ANOVA) with a multiple comparison test. f, Change in de novo protein synthesis rates in PUS7-KO hESCs ± siPAIP1 and mTOG-Ψ relative to the WT (right). *P = 0.0339, **P = 0.0059 (mTOG-Ψ) and **P = 0.0054 (siPAIP1 + mTOG-Ψ); one-way ANOVA with a multiple comparison test. g, Representative protein analysis of mTOG-regulated RPL29, RPL23 and EIF6 in WT and PUS7-KO hESCs following treatment with siPAIP1 ± mTOG-Ψ (top left). Heat map showing log2-transformed FC in protein levels normalized to PUS7-KO cells (top right); one-tailed paired Student’s t-test. RPL29, RPL23 and EIF6 mRNA levels in PUS7-KO hESCs ± siPAIP1 (bottom); one-way ANOVA with a multiple comparison test. e,g, *P< 0.05, **P < 0.01 and ***P < 0.001. h, Schematic depicting the translational reporter-based assay (left). Change in Firefly luciferase (Fluc) activity in PUS7-KO hESCs ± mTOG-Ψ or mTOG-U relative to the WT (right). *P = 0.0213 (KO versus KO + mTOG-Ψ) and *P = 0.0229 (KO + mTOG-Ψ versus KO + mTOG-U); one-way ANOVA with a multiple comparison test. i, Mutagenesis of the RPL23 5′ PES (top) hampers Fluc translation regulation in PUS7-KO ± mTOG-Ψ; two-tailed Student’s t-test. j, PAIP1 is required for mTOG-Ψ control of RPL23 5′ PES cis-regulatory activity. Change in Fluc activity in PUS7-KO hESCs treated with mTOG-Ψ or siPAIP1 relative to the PUS7-KO control. One-way ANOVA with a multiple comparison test. ej, Data are the mean ± s.d. from n = 3 (eg,i,j) or 4 (h) independent biological replicates; NS, not significant. c,e,j, Individual P values are provided. Source data
Fig. 3
Fig. 3. Dysregulation of mTOG-Ψ-driven translation control in HR-MDS-HSPCs predicts leukaemic progression.
a,b, Patients with reduced HSPC mTOG levels have decreased overall survival (a; n = 50) and increased risk of AML progression (b; n = 43). Log-rank test. b, Inset: inverse correlation (Pearson’s r) between the relative HSPC mTOG expression levels and BM blast counts in patients with MDS (n = 50). c, mTOG-Ψ represses translation in MDS-HSPCs. Representative flow cytometric analysis (middle) of de novo protein synthesis in HSPCs from healthy controls (HC) and MDS-HSPCs following treatment with SCR-Ψ or mTOG-Ψ as illustrated in the schematic (left). The changes in protein levels, determined through OP-puromycin labelling, of mTOG-Ψ relative to SCR-Ψ (mean ± s.e.m.) in four independent HC individuals and patients with MDS are shown (right). *P = 0.0311, Welch’s two-tailed t-test. d, Protein analysis of patient-derived BMMCs demonstrated increased expression of mTOG-Ψ targets in HR-MDS and sAML compared with the HC and LR-MDS groups (top). No differences in the relative EIF6, RPL23 and RPL29 mRNA levels in patient-derived BMMCs relative to the HC group were observed (bottom). One-way ANOVA with a multiple comparison test; n = 3 or 4, each dot represents a patient. e,f, Delivery of synthetic mTOG-Ψ (e) and siPAIP1 (f) selectively rescues the translation of 5′ PES-containing RPL29, RPL23 and EIF6 mRNA in patient-derived HR-MDS cells (left). The changes in protein abundance in mononuclear cells from different patients with HR-MDS treated with mTOG-Ψ (e) and siPAIP1 (f) relative to the controls (SCR-Ψ and siCtrl, respectively) are shown (right). Two-way ANOVA with a multiple comparison test; n = 3 patient samples, except for RPL23 in e, where n = 2; each dot represents a patient. e, **P = 0.0015 and *P = 0.0195. f, **P = 0.0025 and ***P = 0.0005. g, The mTOG-Ψ–PAIP1 axis modulates translation in PUS7-depleted MDS-L cells. Representative de novo protein synthesis and analysis of mTOG-Ψ-regulated 5′ PES-containing mRNA in MDS-L cells infected with shRNA targeting PUS7 (shPUS7) with or without mTOG-Ψ or siPAIP1 (20 nM) treatment (left). Relative protein synthesis in PUS7-KD MDS-L cells ± siPAIP1 or mTOG-Ψ (right). *P = 0.0215, *P = 0.0190 and ***P = 0.0001; one-way ANOVA with a multiple comparison test; n = 5 independent biological replicates. h, No changes in EIF6 and RPL29 transcription, relative to the control (shCTRL), were observed in the treatment groups in g. One-way ANOVA with a multiple comparison test; n = 6 independent biological replicates. dh, Data are the mean ± s.d. NS, not significant. Source data
Fig. 4
Fig. 4. mTOG-Ψ treatment improves differentiation and engraftment of malignant MDS-HSPCs.
a, Experimental approach employed to examine the effects of mTOG-Ψ and PAIP1 on the CFU potential of PUS7-KD MDS-L cells and patient-derived HR-MDS-HSPCs. b, Number of colonies obtained from HSPCs from two patients with HR-MDS (MDS135 and MDS304) 15 d following treatment with SCR-Ψ, mTOG-Ψ, siPAIP1, and mTOG-Ψ and siPAIP1. MDS135, *P = 0.0129; and MDS304, **P = 0.0016; one-way ANOVA with multiple comparison; n = 2–5 independent biological experiments, indicated as individual dots, subject to material availability. c, Number of colonies in shRNA control (shCTRL)-treated and PUS7-KD MDS-L cells on day 15 following transduction with SCR-Ψ, mTOG-Ψ, siPAIP1, and mTOG-Ψ and siPAIP1. Data are the mean ± s.d. of n = 3 independent biological replicates. **P = 0.0093; ***P = 0.0009; *P = 0.0348 (shPUS7 + siPAIP1) and *P = 0.0197 (shPUS7 + mTOG-Ψ + siPAIP1); two-tailed Student’s t-test. d, Schematic showing the experimental conditions used for HSPC differentiation in the presence of erythropoietin (EPO) or granulocyte colony-stimulating factor (G-CSF). e, Number of differentiated erythroid and myeloid cells, relative to the SCR-Ψ control, obtained following different treatments. The experiments were performed in duplicate or triplicate; n = 4 patients, except for mTOG-Ψ, where n = 5 patients; each dot represents a patient. Erythoid, *P = 0.047 (mTOG-Ψ), ***P = 0.0003 (siPAIP1), **P = 0.0016 (siPAIP1 + mTOG-Ψ); myeloid, ****P = 0.000012 (mTOG-Ψ), **P = 0.0011 (siPAIP1), **P = 0.0036 (siPAIP1 + mTOG-Ψ); one-tailed Student’s t-test. f,g, Schematic of the HR-MDS-HSPC xenotransplantation experiment (f) and representative fluorescence-associated-cell-sorting plots showing the expression levels of human CD45 (hCD45) in the BM of the NSG-S mice (h). g, The percentages of hCD45 cells in the red gates are shown. h, Percentage of human engraftment (hCD45+) in mice transplanted with HSPCs from three patients with HR-MDS (MDS275, MDS135 and MDS272). *P = 0.0299 and *P = 0.0283; two-tailed Student’s t-test; n = 2–5 mice, each dot represents a transplanted mouse. i, Changes in the percentage of myeloid (CD33+) and lymphoid (CD19+) cells in each mTOG-Ψ-treated patient-derived xenotransplant; one-tailed Student’s t-test. j, Flow cytometric analysis of human CD123 in hCD45+hCD34+hCD45RA+ cells from littermates transplanted with HR-MDS-HSPCs ± SCR-Ψ or mTOG-Ψ (left). The levels of CD123 in the same cell population from an NSG-S mouse transplanted with LR-MDS-HSPCs are shown for comparison (dashed black line). Mean fluorescence intensity (MFI) of CD123 in hCD45+hCD34+hCD45RA+ cells from the patient-derived xenotransplantation experiments (right). **P = 0.0047; two-tailed Student’s t-test. b,c,h,i, Data are the mean ± s.d. Source data
Extended Data Fig. 1
Extended Data Fig. 1. mTOG-Ψ bind to RRM2 and RRM3 within PABPC1.
a, Graph shows fraction of PABPC1 bound to RNA normalized to unbound RNA as the log2 FC to SCR-Ψ oligo in EMSA experiments (n=3 independent experiments, mean ± SD). *p=0.0354; ***p=0.0002 (one-way ANOVA with multiple comparisons). b, Uptake plots show number of deuterium incorporated in selected peptides from indicated PABPC1 domains in HDX-MS time-course experiment in CTR or mTOG-Ψ conditions. Annotations indicate RRM, residue number and peptide sequence. Data points are mean of n=2 biological experiments. c, Binding assay shows significant and selective interaction between mTOG-Ψ and RRM2-3 upon UV-crosslinking. d, Immunoprecipitation experiments using biotinylated mTOG-Ψ oligos in cells transduced with FLAG-tagged full-length or different PABPC1 mutants. DHX36 is shown as a control mTOG-Ψ-bound protein. e, mTOG-Ψ does not affect PABPC1-PAIP2 interaction. PAIP2 co-precipitated with PABPC1 is shown in the presence or absence of SCR and mTOG-Ψ oligos. f, mTOG-Ψ does not alter PABPC1 binding to poly(A). Representative EMSA shows radioactive-labelled poly(A) RNA incubated with recombinant PABPC1 in presence or absence of cold mTOG-Ψ. g, Immunofluorescence shows no changes in PABPC1 localization in WT and PUS7-KO hESC ± mTOG-Ψ. h, Protein stability analysis show no differences in PABPC1 levels ± mTOG-Ψ in hESCs following treatment with cycloheximide (CHX). Data in c-h represent n=3 independent experiments, except g, showing one representative experiment. Source data
Extended Data Fig. 2
Extended Data Fig. 2. Ribosome profiling reveals translational regulation of 5’PES-containing mRNAs.
a, Plots show reproducibility of ribosome profiling RPF libraries from WT and PUS7-KO hESCs. r, Pearson correlation coefficient. b-c, Percentage of P-sites in coding sequence (CDS) or untranslated regions (UTR) (b) and assigned to reading frames 0, 1 and 2 (c) are shown. d, Analysis of ribosome occupancy at individual codons for the A-, P- and E-site is shown as the ratio PUS7-KO/WT. Data are shown as values and mean of two independent experiments. e, 5’UTR analysis of translationally upregulated mRNAs in PUS7-KO hESCs shows increased GC percentage and decreased length compared to the transcriptome. Boxplots show the upper and lower whiskers (box boundaries), the upper and lower quartiles, and the median. ****p=1.63e−25; *p=0.01; ns, no statistical significance (two-sided Wilcoxon signed-rank test). TE UP n=2023 and, transcriptome n=16063. f, Genome browser tracks show representative reads from ribosome-protected fragments in WT and PUS7-KO for RPL29, RPL23 and EIF6 mRNAs. g, mTOG-Ψ do not affect RPL29 and RPL23 mRNA stability. Transcript levels were measured at indicated time points after Actinomycin-D treatment and normalized to the 18S rRNA. n=3 independent biological replicates at each time point, presented as mean±SD. h, tRNA-Tyr (GUA) northern blot analysis in hESCs PUS7-KO ± mTOG-Ψ U6 RNA is included as loading control, n=3 independent experiments. Source data
Extended Data Fig. 3
Extended Data Fig. 3. mTOG-Ψ-mediated translational control is PABPC1-dependent and LARP1-independent.
a, Protein analysis of selected 5’PES mRNA candidates in WT, PUS7-KO hESCs. n=3 independent experiments. b, LARP1 stabilizes 5’PES-containing RPL29 and RPL23 transcripts. Corresponding mRNA levels measured at different time points following Actinomycin-D treatment and normalized to 18S rRNA are shown. For RPL23, *p=0.0353, and *p=0.0348; RPL29 ****p<0.0001, and *p=0.0177 (nonlinear regression analysis). n=3 independent biological replicates at each time point, presented as mean ± SD. c, mTOG-Ψ translation repression is LARP1-independent. Global protein synthesis measured by puromycin incorporation in WT and PUS7-KO hESC transfected with CTR or LARP1-targeting siRNA ± mTOG-Ψ. Graph shows log2 FC protein synthesis to WT, mean ± SD. n=3 independent biological replicates. ***p=0.001; *p=0.0112 (one-way ANOVA with multiple comparison). d, RPL29 5’UTR translational reporter with WT (left) and mutant (right) PES motif employed to assess the functional effect of mTOG-Ψ. Graph shows log2 FC FLuc activity to WT (mean ± SD) in PUS7-KO hESC ± mTOG-Ψ/U. n=3 independent biological replicates. **p=0.0030, **p=0.0030; ns, no statistical significance (one-way ANOVA with multiple comparison). Source data
Extended Data Fig. 4
Extended Data Fig. 4. Clinical assessment of PUS7 and mTOG dysregulation in MDS.
a, Increased risk of AML progression in MDS patients with low PUS7 expression (HR=102, n=100) evaluated in HSPC from a previously published study. b, Decreased overall patient survival (n=44, HR=3.1, 95% CI, 1.4-6.9) and c, increased risk of AML progression (n=38, HR=10.1, 95% CI, 1.2-88) in patients with reduced HSPC mTOG expression. Patients with −7/del(7q) were excluded from the analysis. p-values were calculated using log-rank test. d-e, PUS7 levels in primary MDS-HSPC. Low PUS7 mRNA expression (I quartile) is associated with decreased overall survival (HR = 2.4, 95% CI 1.14–5.04, n=50). p-values were calculated using log-rank test. f, mTOG levels are reduced in high risk MDS and secondary AML (sAML) HSPC. mTOG levels were quantified by RT-qPCR and normalized to mir16 levels. *p =0.0205; **p=0.0082 (one-way ANOVA with multiple comparison). n=30 LR, 15 HR and 11 AML individual patient samples, presented as mean ± SD. g, Pairwise correlation between mTOG and PAIP1 or PABPC1 mRNA levels in primary MDS-HSPC (n=50). Expression of each of the RNAs was quantified by ddPCR and normalized to miR16 (mTOG) or HPRT1 levels (PAIP1 and PABPC1). The shaded region in each graph represents the confidence interval. Source data
Extended Data Fig. 5
Extended Data Fig. 5. mTOG expression is independent from recurrent mutations and cytogenetic abnormalities in MDS.
Mutational landscape of the MDS patient cohort (n=50) used for this study. Patients are stratified based on mTOG levels from low to high. mTOG levels were independent from recurrent MDS genetic abnormalities (Mann-Whitney U test). Source data
Extended Data Fig. 6
Extended Data Fig. 6. Effects of mTOG-Ψ and siPAIP1 on HC and HR-MDS HSPC in vitro expansion.
a, Graph shows mTOG quantification in HC and HR-MDS HSPC cells after transfection with mTOG-Ψ or SCR-Ψ oligo (3 days). n=3 independent biological experiments (except for SCR-Ψ of HR-MDS, where n=2) subject to limited patient sample availability. b, Graph shows quantification of CD34+ cells in HC and MDS-HSPC transduced with mTOG-Ψ or SCR. ns, no statistically significant difference was observed (Welch’s two-tailed t test). n=3 independent biological experiments. c, Graph shows no changes in HC and MDS-HSPC cell viability in the presence of mTOG-Ψ or SCR-Ψ oligo. d, Steady-state HC and MDS-HSPC proliferation is not affected by mTOG-Ψ in culture. Graphs show number of HC and MDS-HSPC at different days in the presence or absence of mTOG-Ψ. e, No significant changes in proliferation of HR-MDS HSPC were detected at different days upon SCR-Ψ, siPAIP1 and the combination mTOG-Ψ/siPAIP1 treatment For each patient, n=3 independent experimental replicates. Data is shown as mean ± SD. Source data
Extended Data Fig. 7
Extended Data Fig. 7. Effects of PUS7 depletion and mTOG-Ψ treatment on tRNA levels in MDS-L and HR-MDS cells.
a, Northern blot analysis shows no differences in the levels of precursor and mature tRNA-Tyr (GUA) in PUS7-KD MDS-L ± mTOG-Ψ (left) and CD34- MNC from two aged-matched HC and HR-MDS patients (bottom right). U6 RNA is included as a loading control. Data represent n=3 independent experiments for MDS-L, except when n=1 due to limited patient material availability. b, Representative FACS analysis shows increase immature MDS propagating cells (CD34+/CD45RA+/CD123+) in PUS7-KD MDS-L compared to controls. Graph shows % of CD34+/CD45RA+/CD123+ cells in CTRL and PUS7-KD MDS-L lines. n=5 independent biological replicates, ****p<0.0001 (two-sided t test). Data is shown as mean ± SD. Source data
Extended Data Fig. 8
Extended Data Fig. 8. Effects of PUS7 depletion and mTOG-Ψ treatment on HC HSPC colony-forming capacity.
a, Top, representative images of CFUs obtained using HSPC isolated from HC and HR-MDS patients treated with mTOG-Ψ or SCR-Ψ oligos. Bottom, graph shows FC colony number obtained HC HSPC transduced with SCR-Ψ, mTOG-Ψ, siPAIP1 and the combination mTOG-Ψ/siPAIP1 at day 15. ns, no statistical significance (one-way ANOVA with multiple comparison). Data is shown as mean ± SD. n=2-8 patient samples as indicated, dots show individual patients. b, Protein analysis show reduced levels of EIF6, RPL23 and RPL29 in CFUs obtained from a HSPC of an HR-MDS patient (MDS304) in the presence of mTOG-Ψ and siPAIP1. In contrast, no differences were detected in CFUs obtained from HC HSPC (NBM141). Data represent two independent healthy and MDS patients in duplicate experiments. Source data
Extended Data Fig. 9
Extended Data Fig. 9. mTOG-Ψ promote HR-MDS HSPC multi-lineage differentiation.
a, Graph shows mTOG quantification in HC and HR-MDS HSPC cells after transfection with mTOG-Ψ or SCR-Ψ oligo following erythroid (Ery) and myeloid (Mye) differentiation (day 15). Data show two independent biological experiments. b, mTOG-Ψ promote expansion of HR-MDS cells in erythroid (top) and myeloid (bottom) differentiation media. No effects were observed in n=3 individual HC patient samples, (two-sided t test). Graphs show number erythroid (CD235a+/CD36+) and myeloid (CD66b+/CD33-) cells. during differentiation in the presence or absence of mTOG-Ψ. c, PAIP1 downregulation increase erythroid (top) and myeloid (bottom) HR-MDS cells expansion. Differentiation is not further enhanced by co-transfection with mTOG-Ψ oligos. For each patient, n=3 independent experimental replicates. Data is represented as mean ± SD. Source data
Extended Data Fig. 10
Extended Data Fig. 10. mTOG-Ψ does not affect LR-MDS HSPC engraftment and multi-lineage differentiation.
a, Representative FACS plots illustrates hCD45 expression in the BM of NSG-S mice untransplanted and transplanted with LR-MDS HSPC ± mTOG-Ψ. Graphs show FC human engraftment to SCR-Ψ-treated mice in 8 weeks post-transplantation (n=3 mice). ns, no statistical significance (two-sided t test). b, FACS plot shows the expression of myeloid (CD33) and B cell (CD19) markers in the BM of transplanted mice. Graph shows FC lymphoid (CD19+) cells to SCR-Ψ in individual mice transplanted with LR-MDS HSPC ± mTOG-Ψ. ns, no statistical significance (two-sided t test). Dots represent individual mice (n=3 mice) transplanted with cells from two LR-MDS patient samples. Data is shown as mean ± SD. Source data

References

    1. Rosace, D., Lopez, J. & Blanco, S. Emerging roles of novel small non-coding regulatory RNAs in immunity and cancer. RNA Biol.17, 1196–1213 (2020). - PMC - PubMed
    1. Guzzi N, et al. Pseudouridylation of tRNA-derived fragments steers translational control in stem cells. Cell. 2018;173:1204–1216. doi: 10.1016/j.cell.2018.03.008. - DOI - PubMed
    1. Craig AWB, Haghighat A, Yu ATK, Sonenberg N. Interaction of polyadenylate-binding protein with the eIF4G homologue PAIP enhances translation. Nature. 1998;392:520–523. doi: 10.1038/33198. - DOI - PubMed
    1. Pelletier J, Graff J, Ruggero D, Sonenberg N. Targeting the eIF4F translation initiation complex: a critical nexus for cancer development. Cancer Res. 2015;75:250–263. doi: 10.1158/0008-5472.CAN-14-2789. - DOI - PMC - PubMed
    1. Ge J, Yu YT. RNA pseudouridylation: new insights into an old modification. Trends Biochem. Sci. 2013;38:210–218. doi: 10.1016/j.tibs.2013.01.002. - DOI - PMC - PubMed

Publication types

MeSH terms