

CD4/CD8 Ratio and Cancer Risk Among Adults With HIV
- PMID: 35292820
- PMCID: PMC9194634
- DOI: 10.1093/jnci/djac053
CD4/CD8 Ratio and Cancer Risk Among Adults With HIV
Abstract
Background: Independent of CD4 cell count, a low CD4/CD8 ratio in people with HIV (PWH) is associated with deleterious immune senescence, activation, and inflammation, which may contribute to carcinogenesis and excess cancer risk. We examined whether low CD4/CD8 ratios predicted cancer among PWH in the United States and Canada.
Methods: We examined all cancer-free PWH with 1 or more CD4/CD8 values from North American AIDS Cohort Collaboration on Research and Design observational cohorts with validated cancer diagnoses between 1998 and 2016. We evaluated the association between time-lagged CD4/CD8 ratio and risk of specific cancers in multivariable, time-updated Cox proportional hazard models using restricted cubic spines. Models were adjusted for age, sex, race and ethnicity, hepatitis C virus, and time-updated CD4 cell count, HIV RNA, and history of AIDS-defining illness.
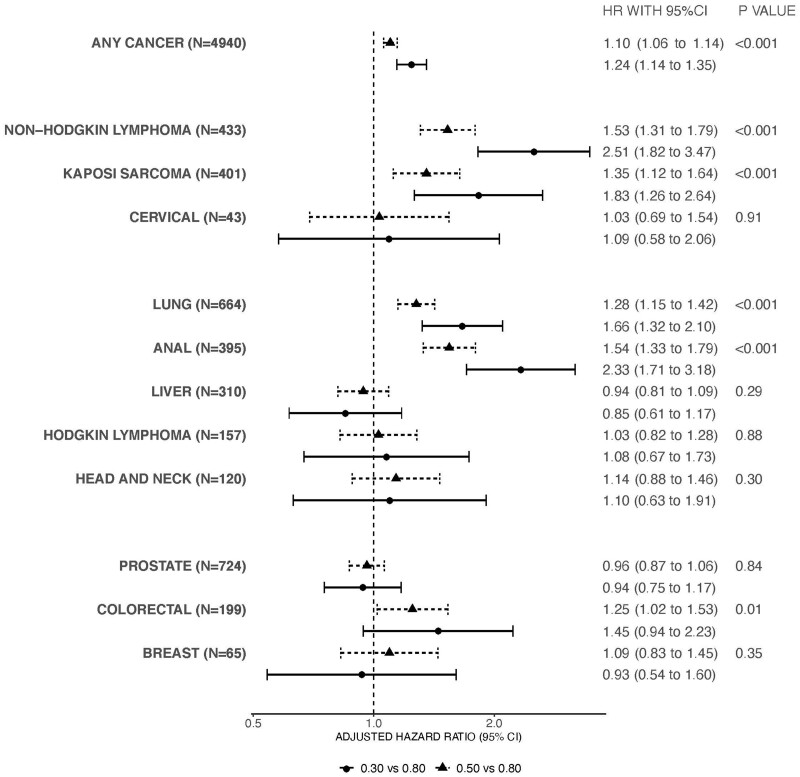
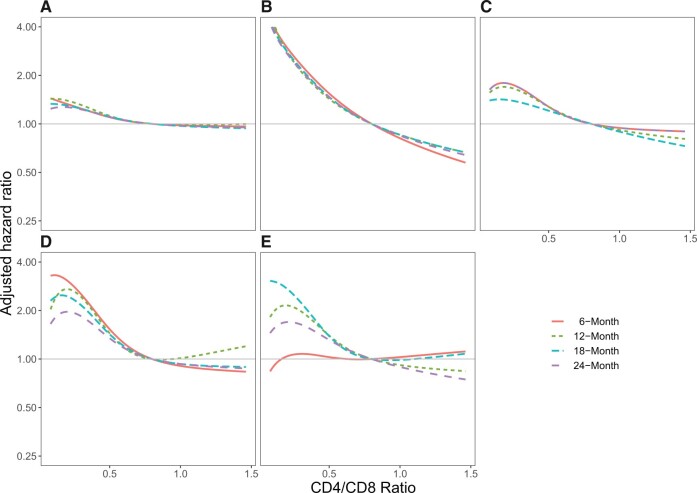
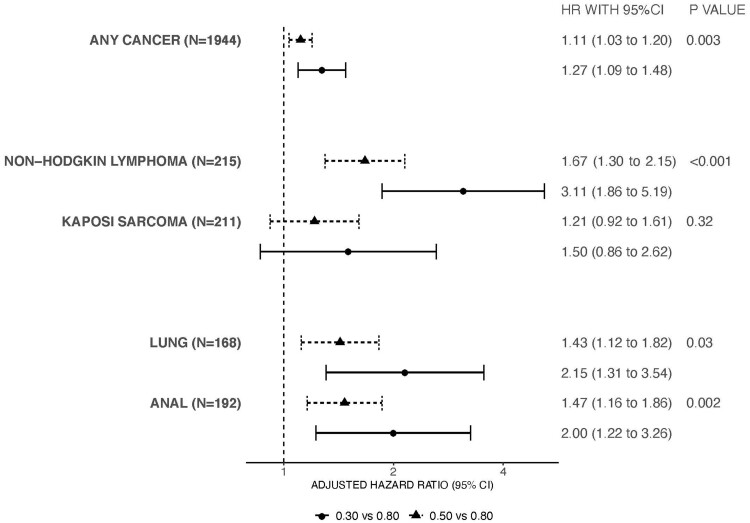
Results: Among 83 893 PWH, there were 5628 incident cancers, including lung cancer (n = 755), Kaposi sarcoma (n = 501), non-Hodgkin lymphoma (n = 497), and anal cancer (n = 439). The median age at cohort entry was 43 years. The overall median 6-month lagged CD4/CD8 ratio was 0.52 (interquartile range = 0.30-0.82). Compared with a 6-month lagged CD4/CD8 of 0.80, a CD4/CD8 of 0.30 was associated with increased risk of any incident cancer (adjusted hazard ratio = 1.24 [95% confidence interval = 1.14 to 1.35]). The CD4/CD8 ratio was also inversely associated with non-Hodgkin lymphoma, Kaposi sarcoma, lung cancer, anal cancer, and colorectal cancer in adjusted analyses (all 2-sided P < .05). Results were similar using 12-, 18-, and 24-month lagged CD4/CD8 values.
Conclusions: A low CD4/CD8 ratio up to 24 months before cancer diagnosis was independently associated with increased cancer risk in PWH and may serve as a clinical biomarker.
© The Author(s) 2022. Published by Oxford University Press. All rights reserved. For permissions, please email: journals.permissions@oup.com.
Figures
Comment in
-
Room to Grow: The Need for Cancer Site-Specific Research Into Biomarkers of Aging and Immunity in People With HIV.J Natl Cancer Inst. 2022 Jun 13;114(6):790-791. doi: 10.1093/jnci/djac056. J Natl Cancer Inst. 2022. PMID: 35292810 Free PMC article. No abstract available.
References
-
- Engels EA, Biggar RJ, Hall HI, et al. Cancer risk in people infected with human immunodeficiency virus in the United States. Int J Cancer. 2008;123(1):187–194. - PubMed
-
- Hessol NA, Seaberg EC, Preston-Martin S, et al. Cancer risk among participants in the women’s interagency HIV study. J Acquir Immune Defic Syndr. 2004;36(4):978–985. - PubMed
-
- Silverberg MJ, Lau B, Achenbach CJ, et al. ; North American AIDS Cohort Collaboration on Research and Design of the International Epidemiologic Databases to Evaluate AIDS. Cumulative incidence of cancer among persons with HIV in North America: a cohort study. Ann Intern Med. 2015;163(7):507–518. - PMC - PubMed
-
- Althoff KN, Chandran A, Zhang J, et al. ; North American AIDS Cohort Collaboration on Research and Design (NA-ACCORD) of IeDEA. Life-expectancy disparities among adults with HIV in the United States and Canada: the impact of a reduction in drug- and alcohol-related deaths using the lives saved simulation model. Am J Epidemiol. 2019;188(12):2097–2109. - PMC - PubMed
Publication types
MeSH terms
Grants and funding
- K23 EY013707/EY/NEI NIH HHS/United States
- U54 AG062334/AG/NIA NIH HHS/United States
- U54 GM133807/GM/NIGMS NIH HHS/United States
- U01 HL146208/HL/NHLBI NIH HHS/United States
- UL1 RR024131/RR/NCRR NIH HHS/United States
- U01 HL146192/HL/NHLBI NIH HHS/United States
- UM1 AI068634/AI/NIAID NIH HHS/United States
- U01 AI069432/AI/NIAID NIH HHS/United States
- U01 AA020790/AA/NIAAA NIH HHS/United States
- KL2 TR000421/TR/NCATS NIH HHS/United States
- K01 AI131895/AI/NIAID NIH HHS/United States
- U01 HL146241/HL/NHLBI NIH HHS/United States
- R01 AA016893/AA/NIAAA NIH HHS/United States
- P30 AI027767/AI/NIAID NIH HHS/United States
- U01 DA036297/DA/NIDA NIH HHS/United States
- P30 AI050409/AI/NIAID NIH HHS/United States
- U01 HL146333/HL/NHLBI NIH HHS/United States
- F31 AI124794/AI/NIAID NIH HHS/United States
- P30 MH062246/MH/NIMH NIH HHS/United States
- U01 AI069434/AI/NIAID NIH HHS/United States
- P01 AA029545/AA/NIAAA NIH HHS/United States
- R01 DA011602/DA/NIDA NIH HHS/United States
- P30 AI094189/AI/NIAID NIH HHS/United States
- U01 HL146245/HL/NHLBI NIH HHS/United States
- UM1 AI069432/AI/NIAID NIH HHS/United States
- G12 MD007583/MD/NIMHD NIH HHS/United States
- K24 DA000432/DA/NIDA NIH HHS/United States
- U01 HL146205/HL/NHLBI NIH HHS/United States
- K23 AI120875/AI/NIAID NIH HHS/United States
- U01 DA036935/DA/NIDA NIH HHS/United States
- U01 AI038855/AI/NIAID NIH HHS/United States
- K01 AI162247/AI/NIAID NIH HHS/United States
- R24 AI067039/AI/NIAID NIH HHS/United States
- U01 HL146242/HL/NHLBI NIH HHS/United States
- U01 AI038858/AI/NIAID NIH HHS/United States
- U10 EY008057/EY/NEI NIH HHS/United States
- U01 AI068636/AI/NIAID NIH HHS/United States
- L30 AI133812/AI/NIAID NIH HHS/United States
- U01 HL146201/HL/NHLBI NIH HHS/United States
- U01 HL146193/HL/NHLBI NIH HHS/United States
- U10 EY008052/EY/NEI NIH HHS/United States
- UL1 TR002378/TR/NCATS NIH HHS/United States
- P30 CA068485/CA/NCI NIH HHS/United States
- P30 AI110527/AI/NIAID NIH HHS/United States
- R34 DA045592/DA/NIDA NIH HHS/United States
- P30 AI027763/AI/NIAID NIH HHS/United States
- K01 AI093197/AI/NIAID NIH HHS/United States
- U01 AI069918/AI/NIAID NIH HHS/United States
- K24 AI118591/AI/NIAID NIH HHS/United States
- K24 AI065298/AI/NIAID NIH HHS/United States
- U01 AA013566/AA/NIAAA NIH HHS/United States
- N02 CP055504/CP/NCI NIH HHS/United States
- UL1 TR000083/TR/NCATS NIH HHS/United States
- P30 AI027757/AI/NIAID NIH HHS/United States
- U01 HL146204/HL/NHLBI NIH HHS/United States
- R01 DA012568/DA/NIDA NIH HHS/United States
- U01 HL146202/HL/NHLBI NIH HHS/United States
- UL1 TR000004/TR/NCATS NIH HHS/United States
- U01 HL146240/HL/NHLBI NIH HHS/United States
- K07 CA225404/CA/NCI NIH HHS/United States
- F31 DA037788/DA/NIDA NIH HHS/United States
- R01 AG053100/AG/NIA NIH HHS/United States
- U10 EY008067/EY/NEI NIH HHS/United States
- P30 AI036219/AI/NIAID NIH HHS/United States
- U01 HL146194/HL/NHLBI NIH HHS/United States
- U24 AA020794/AA/NIAAA NIH HHS/United States
- U01 HL146203/HL/NHLBI NIH HHS/United States
- U01 AI068634/AI/NIAID NIH HHS/United States
- P30 AI050410/AI/NIAID NIH HHS/United States
