. 2022 Apr;12(4):835-851.
doi: 10.1002/2211-5463.13377. Epub 2022 Mar 15.

Nanoscale-tipped wire array injections transfer DNA directly into brain cells ex vivo and in vivo

Affiliations

Nanoscale-tipped wire array injections transfer DNA directly into brain cells ex vivo and in vivo

Rika Numano et al. FEBS Open Bio. 2022 Apr.

Abstract

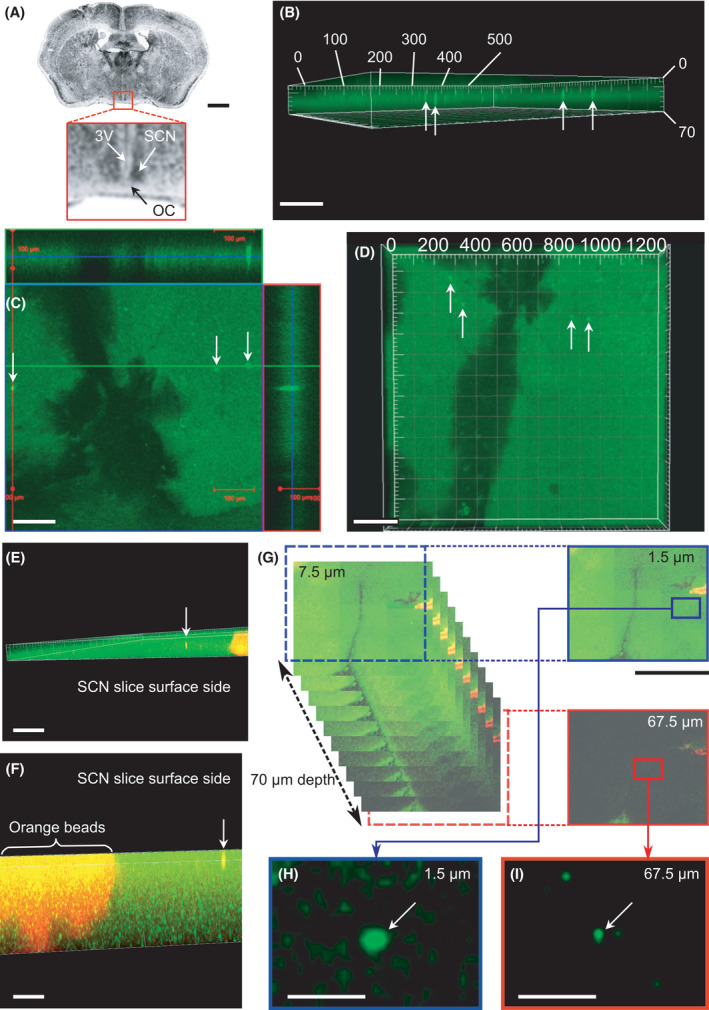
Genetic modification to restore cell functions in the brain can be performed through the delivery of biomolecules in a minimally invasive manner into live neuronal cells within brain tissues. However, conventional nanoscale needles are too short (lengths of ~10 µm) to target neuronal cells in ~1-mm-thick brain tissues because the neuronal cells are located deep within the tissue. Here, we report the use of nanoscale-tipped wire (NTW) arrays with diameters < 100 nm and wire lengths of ~200 µm to address biomolecule delivery issues. The NTW arrays were manufactured by growth of silicon microwire arrays and nanotip formation. This technique uses pinpoint, multiple-cell DNA injections in deep areas of brain tissues, enabling target cells to be marked by fluorescent protein (FP) expression vectors. This technique has potential for use for electrophysiological recordings and biological transfection into neuronal cells. Herein, simply pressing an NTW array delivers and expresses plasmid DNA in multiple-cultured cells and multiple-neuronal cells within a brain slice with reduced cell damage. Additionally, DNA transfection is demonstrated using brain cells ex vivo and in vivo. Moreover, knockdown of a critical clock gene after injecting a short hairpin RNA (shRNA) and a genome-editing vector demonstrates the potential to genetically alter the function of living brain cells, for example, pacemaker cells of the mammalian circadian rhythms. Overall, our NTW array injection technique enables genetic and functional modification of living cells in deep brain tissue areas, both ex vivo and in vivo.

Keywords: ex vivo; NTW array injection; circadian rhythms; clock genes; nanoscale-tipped wire; short hairpin RNA.


Conflict of interest statement

The authors declare no conflict of interest.

Figures

Fig. 1
Fig. 1
SEM images of silicon‐NTW arrays after the wire tip sharpening process. (A) 20 × 20 arrays of 100‐µm‐long silicon‐NTWs with a 100‐µm gap between the wires. Scale bar, 100 µm. (B) Individual wires in the same array are shown in (A). Scale bar, 50 µm. (C) Tip section of the same wire in (B) showing a curvature radius less than 100 nm. Scale bar, 1 µm (D–F) 20 × 20 arrays of 200‐µm‐long silicon‐NTWs. Scale bars, (D) 100 µm, (E) 50 µm, and (F) 1 µm.
Fig. 2
Fig. 2
NTW arrays for delivering transgenes into multiple cells. (A–C) Schematics showing FP gene transfers using an NTW array injection. (Di) A SEM image showing an NTW array with a wire height of 25 µm. Scale bar, 50 µm. The inset shows an individual wire in the array. Scale bar, 5 µm. (Dii, Diii) SEM images of other NTW arrays with heights of (Dii) 100 µm and (Diii) 200 µm. Scale bars, 50 µm. (Div) Tip section of a wire showing the gold nanotip exposed from the parylene shell with a height of 2 µm. Scale bar, 500 nm. (E) Schematics showing gene transfers using an NTW array injection. (Ei) Image showing dropping of a solution with plasmid DNA onto cells. (Eii) Plasmid DNA injection into cells using an NTW array. (Eiii) NTW array evacuation from the cells. (F) Photograph of a packaged 20 × 20 NTW array chip electrically connected to a metal plate to provide device bias. The length of the wire is 25 µm. An NTW array chip was mounted on a manipulation system. (G) Microscope images of Venus plasmid DNA transferred into HEK293 cells using an NTW array injection. White arrows indicate HEK293 cells containing Venus plasmid DNA emitting a yellow fluorescent signal as observed through different objective lenses: (Gi, Gii) 10× and (Giii, Giv) 60×. Scale bars, (Gi, Gii) 100 µm and (Giii, Giv) 20 µm.
Fig. 3
Fig. 3
FP transgene injection into a brain slice using a 100‐µm‐height NTW array. (A) Coronal sections of the mouse brain. Scale bar, 1 mm. Red squares show the SCN, optic chiasm (OC), and third ventricle (3V). (B) Three‐dimensional imaging of the SCN slice by confocal microscopy with a 10× objective lens 2 days after the NTW array injection. White arrows indicate SCN cells containing Venus plasmid DNA molecules expressing fluorescent signals deep within the slice. Scale bar, 100 µm. (C, D) Three‐dimensional imaging of the SCN slice with Venus signals in the deep area. Scale bars, (C) 100 µm and (D) 200 µm. (E, F) Three‐dimensional images of the SCN slice with a Venus yellow signal inside the slice and an orange fluorescent signal from beads deposited onto 3V. Several cells containing Venus signals were aligned with the vertical NTW injection pathway. Scale bars, (E) 200 µm and (F) 100 µm. (G) Montage images of the SCN slice subjected to NTW injections along the z‐axis of each 3 µm Z stack. Scale bar, 1 mm. (H, I) Enlarged images of injected cells at 1.5 µm and 67.5 µm depths taken from the montage images of (G). The FP transgene was injected deep into the cells (~ 70 µm below the surface of the slice). Scale bars, (H, I) 100 µm.
Fig. 4
Fig. 4
FP transgene injection into a brain slice using a 200‐µm‐long NTW array. (A, B) Three‐dimensional confocal microscopy imaging of the Venus signal in the SCN slice after injection using a 200‐µm‐long NTW array. Scale bars, 100 µm. (C–F) Enlarged images of a section of injected cells at depths ranging from 63 to 86 µm. The FP transgene can be injected more profoundly in the SCN slice using a more extended NTW array chip. The distance between the SCN slices' surface and the deepest cell of a Venus signal was more than 80 µm for a 200‐µm wire length vs ~ 70 µm for an array with a 100‐µm wire length (Fig. 3G). Scale bars, 20 µm.
Fig. 5
Fig. 5
In vivo injection of Venus expressional vector plasmids into a brain tissue sample using a 200‐µm‐long NTW array. (A) Schematics showing the in vivo injection of FP into a mouse's cortex using an NTW array. The NTW array, which was held in place by a micromanipulator, penetrated the tissue's barrel area through the window of the skull. (B) A photograph showing the NTW chip positioned over the barrel area of the cortical surface. Scale bar, 200 µm. (C) Three‐dimensional images of the Venus fluorescent signal in the brain. The image was obtained from the whole brain, extracted from the mouse after the injection. Scale bar, 100 µm. (D) Z‐stack images of 140, 185, 230, 275, and 320‐µm depths obtained from the three‐dimensional images along the z‐axis of each 5 µm Z stack. Scale bar, 100 µm.
Fig. 6
Fig. 6
Bmal1 shRNA vector knocks down Per1 expression in the stable Per1 :: luc cell line and the SCN slice of Per1 :: luc Tg mouse using an NTW array. (A) The construction of Per1::luc Tg mice, the 6.7kb Per1 promoter region was followed by the firefly luciferase. The five green circles indicate Ebox consensus sequences where heterodimer of BMAL1 and CLOCK transcription factors bind. Inductivity of luciferase activity driven by the Per1 promoter was 1.2 times that induced by basal Bmal1 or Clock gene expression in the Per1 :: luc cell line compared to the basal level. Per1 :: luc expression was reduced by 1/3 when the Bmal1 or Clock shRNA is expressed. Each value represents the mean ± standard error of the mean (SE, n = 5). Control: neither shRNA is expressed; Bmal1RNAi: Bmal1 shRNA is expressed; Clock RNAi: Clock shRNA is expressed; Bmal1 + Clock RNAi: Bmal1 and Clock shRNA are expressed. Dunnett's test was used to compare rhythmicity between knockdown groups for each RNAi and control group. Statistical significance was set to ***P < 0.0001. (B, C) Three‐dimensional images of the GFP signal for the Bmal1 shRNA plasmid deep within the SCN slice after NTW array injections. White arrows indicate SCN cells injected with Bmal1 shRNA using an NTW array. A white dashed circle indicates the whole area of the ventrolateral SCN, and a red dashed circle shows the core of the dorsomedial SCN. Since most Bmal1 shRNA‐injected cells with GFP signal are identified as pacemaker neurons in the white circle area of SCN, Per1 :: luc emission oscillation of whole SCN slices from Tg mice was derived mainly from the white circle area (ventrolateral) rather than the red circle area (dorsomedial). Scale bars, 100 µm. (D, E) The luciferase emission rhythms from an injected SCN slice receiving NTW array‐based injection of Bmal1 shRNA or only buffer, with a final concentration of 100 µm luciferin, measured during incubation of the SCN slice and detrended.

References

    1. Obataya I, Nakamura C, Han S. Nanoscale operation of a living cell using an atomic force microscope with a nanoneedle. Nano Lett. 2004;5:27–30. - PubMed
    1. Chen X, Kis A, Zettl A, Bertozzi CR. A cell nanoinjector based on carbon nanotubes. Proc Natl Acad Sci USA. 2007;104:8218–22. - PMC - PubMed
    1. Xie C, Lin Z, Hanson L, Cui Y, Cui B. Intracellular recording of action potentials by nanopillar electroporation. Nat Nanotechnol. 2012;7:185–90. - PMC - PubMed
    1. Chabri F, Bouris K, Jones T, Barrow D, Hann A, Allender C, et al. Microfabricated silicon microneedles for nonviral cutaneous gene delivery. Br J Dermatol. 2004;150:869–77. - PubMed
    1. Shalek AK, Robinson JT, Karp ES, Lee JS, Ahn D‐R, Yoon M‐H, et al. Vertical silicon nanowires as a universal platform for delivering biomolecules into living cells. Proc Natl Acad Sci USA. 2010;107 170–5. - PMC - PubMed