. 2022 Mar;27(3):036001.
doi: 10.1117/1.JBO.27.3.036001.

Normalization of optical fluence distribution for three-dimensional functional optoacoustic tomography of the breast

Affiliations

Normalization of optical fluence distribution for three-dimensional functional optoacoustic tomography of the breast

Seonyeong Park et al. J Biomed Opt. 2022 Mar.

Abstract

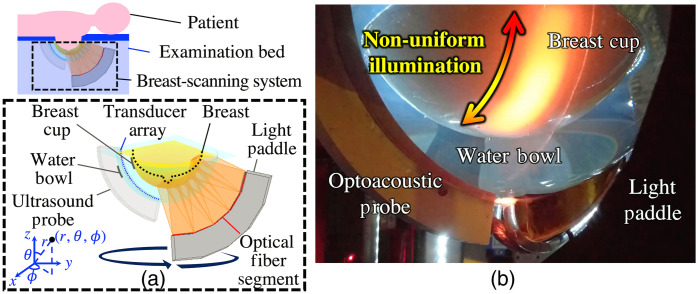
Significance: In three-dimensional (3D) functional optoacoustic tomography (OAT), wavelength-dependent optical attenuation and nonuniform incident optical fluence limit imaging depth and field of view and can hinder accurate estimation of functional quantities, such as the vascular blood oxygenation. These limitations hinder OAT of large objects, such as a human female breast.

Aim: We aim to develop a measurement-data-driven method for normalization of the optical fluence distribution and to investigate blood vasculature detectability and accuracy for estimating vascular blood oxygenation.

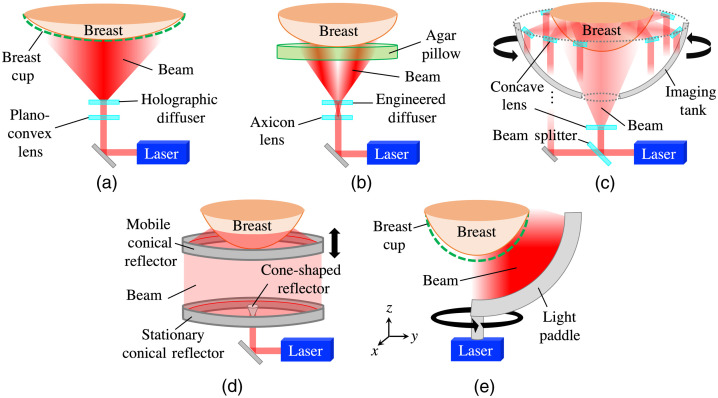
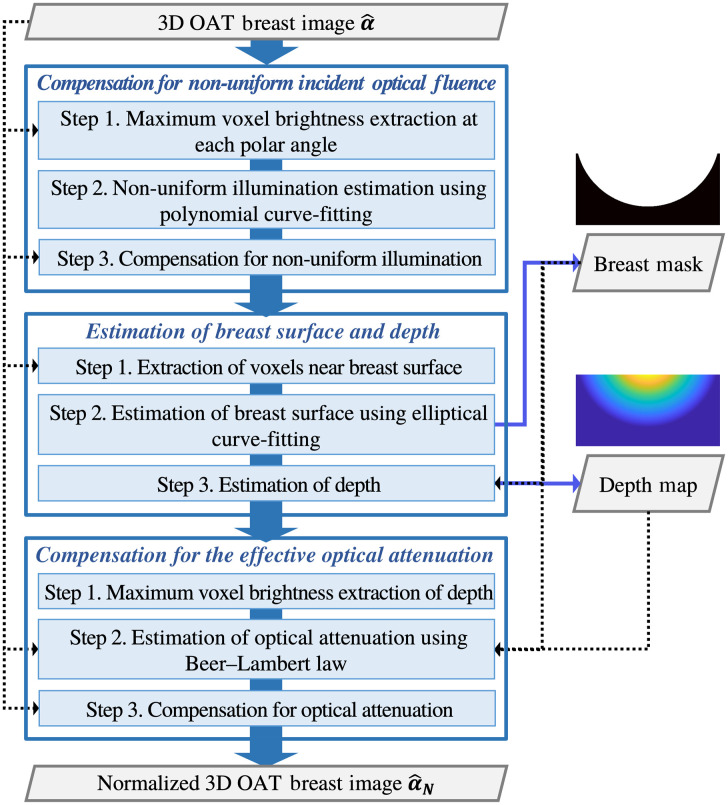
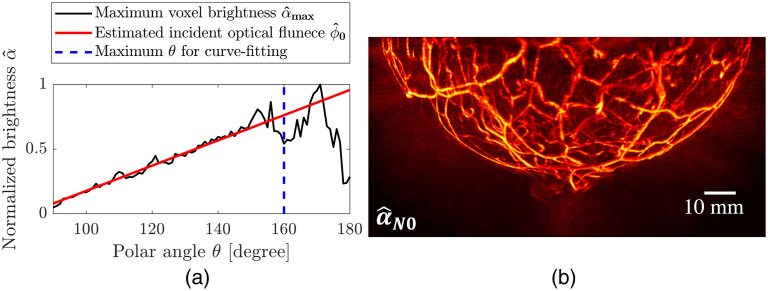
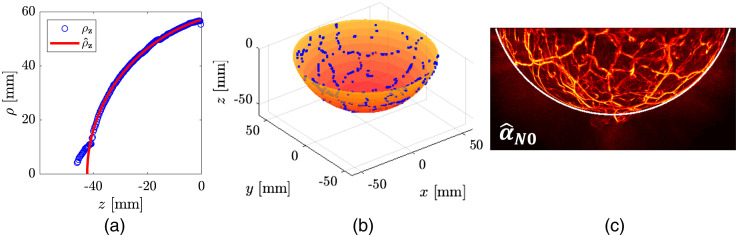
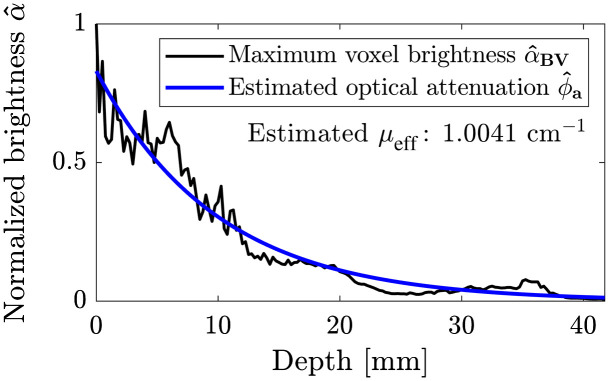
Approach: The proposed method is based on reasonable assumptions regarding breast anatomy and optical properties. The nonuniform incident optical fluence is estimated based on the illumination geometry in the OAT system, and the depth-dependent optical attenuation is approximated using Beer-Lambert law.

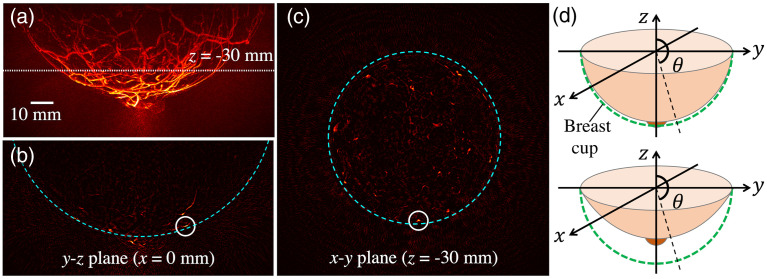
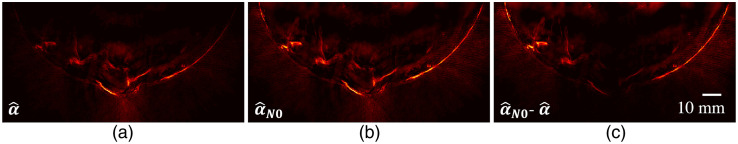
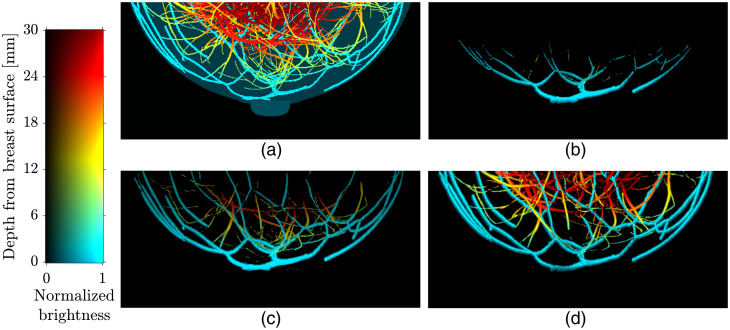
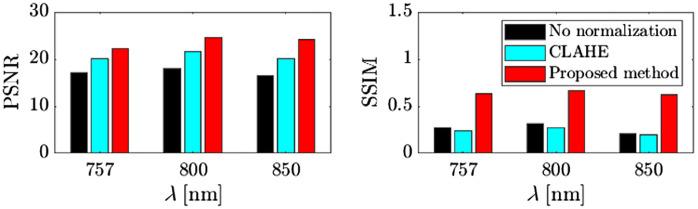
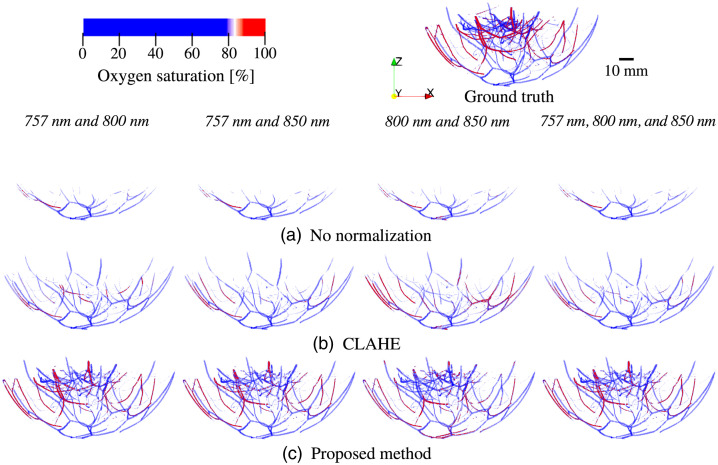
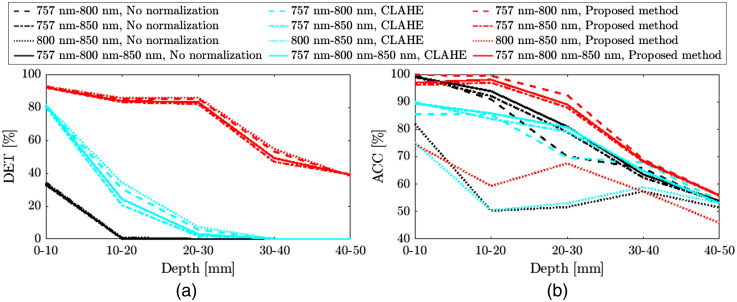
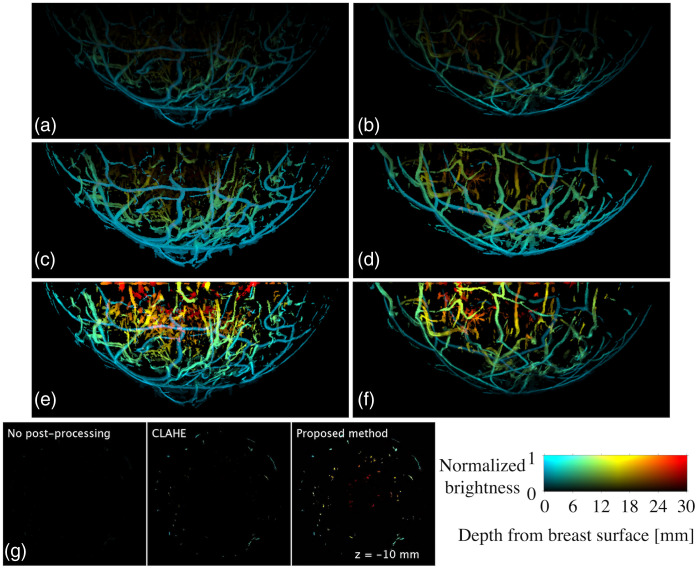
Results: Numerical studies demonstrated that the proposed method significantly enhanced blood vessel detectability and improved estimation accuracy of the vascular blood oxygenation from multiwavelength OAT measurements, compared with direct application of spectral linear unmixing without optical fluence compensation. Experimental results showed that the proposed method revealed previously invisible structures in regions deeper than 15 mm and/or near the chest wall.

Conclusions: The proposed method provides a straightforward and computationally inexpensive approximation of wavelength-dependent effective optical attenuation and, thus, enables mitigation of the spectral coloring effect in functional 3D OAT imaging.

Keywords: breast imaging; functional image; optical fluence estimation; optoacoustic tomography; photoacoustic computed tomography; spectral coloring effect.


Figures

Fig. 1
Fig. 1
Illumination in 3D OAT imaging systems for the breast: (a) Kruger et al. and Toi et al., (b) Lin et al., (c) Schoustra et al., (d) Alshahrani et al., and (e) Oraevsky et al.
Fig. 2
Fig. 2
3D OAT scan using LOUISA-3D: (a) breast scan schematic and (b) photograph of phantom scan. (b) Nonuniform illumination is observed on the surface of the tissue-mimicking physical phantom.
Fig. 3
Fig. 3
(a)–(c) 3D OAT breast image (α^) of a healthy volunteer at a wavelength of 755 nm, scanned by TomoWave Laboratories using LOUISA-3D at MD Anderson Cancer Center, and (d) breast shapes in a given breast cup. Maximum voxel brightness projection (MVBP) along (a) x axis and cross-sections on (b) y-z plane at x=0 mm and (c) x-y plane at z=30  mm. The slice is indicated with a white dotted line in (a). The image (α^) was reconstructed using filtered backprojection (FBP) method. The brightness range of the images was adjusted for better visibility. In panels (b) and (c), a white solid circle indicates the location of the brightest voxel in the cross-section, and a cyan dashed line represents the approximated breast boundary.
Fig. 4
Fig. 4
Flowchart of normalization of optical fluence distribution in 3D OAT breast images.
Fig. 5
Fig. 5
Compensation for nonuniform incident optical fluence: (a) estimated incident optical fluence as a function of polar angle and (b) MVBP of 3D OAT breast image after the compensation (α^N0) along x axis. The results were obtained from Fig. 3(a). In panel (a), a black solid line indicates the maximum voxel brightness according to polar angles, and a red solid line represents a first-degree polynomial curve q1([θ]i) fitted to the maximum voxel brightness. The polar angles to the right of the blue dashed line correspond with nipple and areola in (a).
Fig. 6
Fig. 6
Comparison of images before and after compensation for non-uniform incident optical fluence: MVBP of a 5-mm-thick y slice at y=0 mm (a) before (α^) and (b) after (α^N0) the compensation along y axis and (c) MVBP of their difference (α^N0α^) along y axis. The results were obtained from Fig. 3(a). The voxel brightness near the chest wall (θ=90  deg) in (a) is lower than in the region near the areola (θ160  deg) and, accordingly, the compensation procedure leads to a higher gain near the chest wall as shown in (b) and (c).
Fig. 7
Fig. 7
Breast surface estimation: (a) estimated radii on x-y planes ρ^z; (b) estimated breast surface; and (c) estimated breast boundary on y-z plane at x=0 overlaid on the MVBP of α^N0 along the x axis.
Fig. 8
Fig. 8
Estimation of optical attenuation at a wavelength of 755 nm. A black solid line indicates maximum voxel brightness α^BV at a certain depth range of (dmΔd2,dm+Δd2), and a blue curve is the estimated optical attenuation ϕ^a. The μeff estimated from the 3D OAT breast image was 1.0041  cm1.
Fig. 9
Fig. 9
Comparison between distributions of (a) the optical absorption coefficient μa, (b) initial pressure estimate reconstructed from the noisy measurements, simulated at a wavelength of 800 nm, using FBP with no normalization, and (c) images processed via CLAHE and (d) optical fluence normalization method. The images are presented as MVBP along y axis and color-encoded by depth. A depth range of 0 to 30 mm was visualized. A Jet color map in MATLAB was used to illustrate the breast tissues at different depths.
Fig. 10
Fig. 10
Comparison on PSNR and SSIM between no normalization (black), CLAHE (cyan), and the proposed method (red).
Fig. 11
Fig. 11
Estimates of vascular blood oxygenation obtained using (a) no optical fluence normalization, (b) CLAHE, and (c) the proposed method. The used wavelength pairs are 757 and 800 nm (first column), 757 and 850 nm (second column), 800 and 850 nm (third column), and 757, 800, and 850 nm (fourth column). The vascular blood oxygenation of the numerical phanton (ground truth) is shown on the top right. Paraview was used for volume rendering.
Fig. 12
Fig. 12
(a) Artery/vein detectability and (b) classification accuracy of no optical fluence normalization (black color), CLAHE (cyan color), and the proposed method (red color), according to 10 mm-depth ranges. The used wavelength pairs are 757 and 800 nm (dashed lines); 757 and 850 nm (dash-dotted lines); 800 and 850 nm (dotted lines); and 757, 800, and 850 nm (solid lines).
Fig. 13
Fig. 13
Comparison between reconstructed images with [(a), (b)] no optical fluence normalization, [(c), (d)] CLAHE, and [(e), (f)] the proposed method. The used wavelength was 755 nm. Images in the left column [(a), (c), and (e)] are from the left breast and those in the right column [(b), (d), and (f)] are from the right breast. The images (a) to (f) are presented in MVBP of the entire breast volume along y axis. The still images in panel (g) of Video 1 (Video 1, MP4, 944 kB [URL: https://doi.org/10.1117/1.JBO.27.3.036001.1]) illustrate a z slice (x-y plane) at z=10  mm. The images were color-encoded by depth using the Jet color map in MATLAB.

References

    1. Oraevsky A. A., et al. , “Clinical optoacoustic imaging combined with ultrasound for coregistered functional and anatomical mapping of breast tumors,” Photoacoustics 12, 30–45 (2018).10.1016/j.pacs.2018.08.003 - DOI - PMC - PubMed
    1. Lou Y., et al. , “Generation of anatomically realistic numerical phantoms for photoacoustic and ultrasonic breast imaging,” J. Biomed. Opt. 22(4), 041015 (2017).JBOPFO10.1117/1.JBO.22.4.041015 - DOI - PMC - PubMed
    1. Lin L., et al. , “Single-breath-hold photoacoustic computed tomography of the breast,” Nat. Commun. 9, 2352 (2018).10.1038/s41467-018-04576-z - DOI - PMC - PubMed
    1. Oraevsky A. A., et al. , “Laser optoacoustic imaging of breast cancer in vivo,” Proc. SPIE 4256, 6–15 (2001).PSISDG10.1117/12.429300 - DOI
    1. Oraevsky A., et al. , “Full-view 3D imaging system for functional and anatomical screening of the breast,” Proc. SPIE 10494, 104942Y (2018).PSISDG10.1117/12.2318802 - DOI

Publication types