. 2022 Mar 16:11:e71945.
doi: 10.7554/eLife.71945.

SARS-CoV-2 Nsp14 mediates the effects of viral infection on the host cell transcriptome

Affiliations

SARS-CoV-2 Nsp14 mediates the effects of viral infection on the host cell transcriptome

Michela Zaffagni et al. Elife. .

Abstract

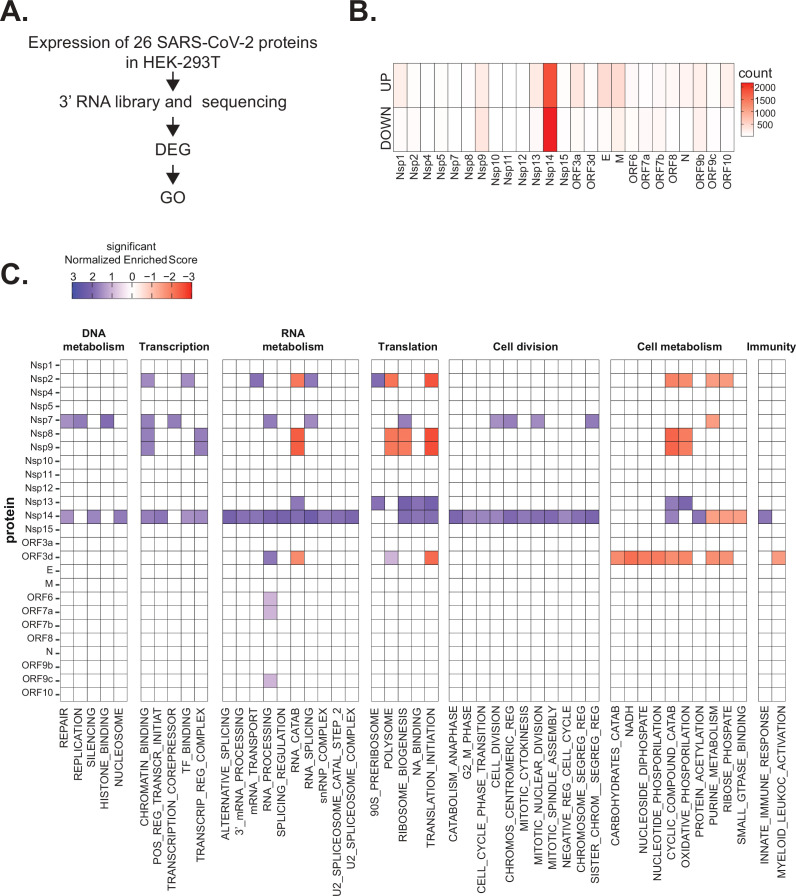
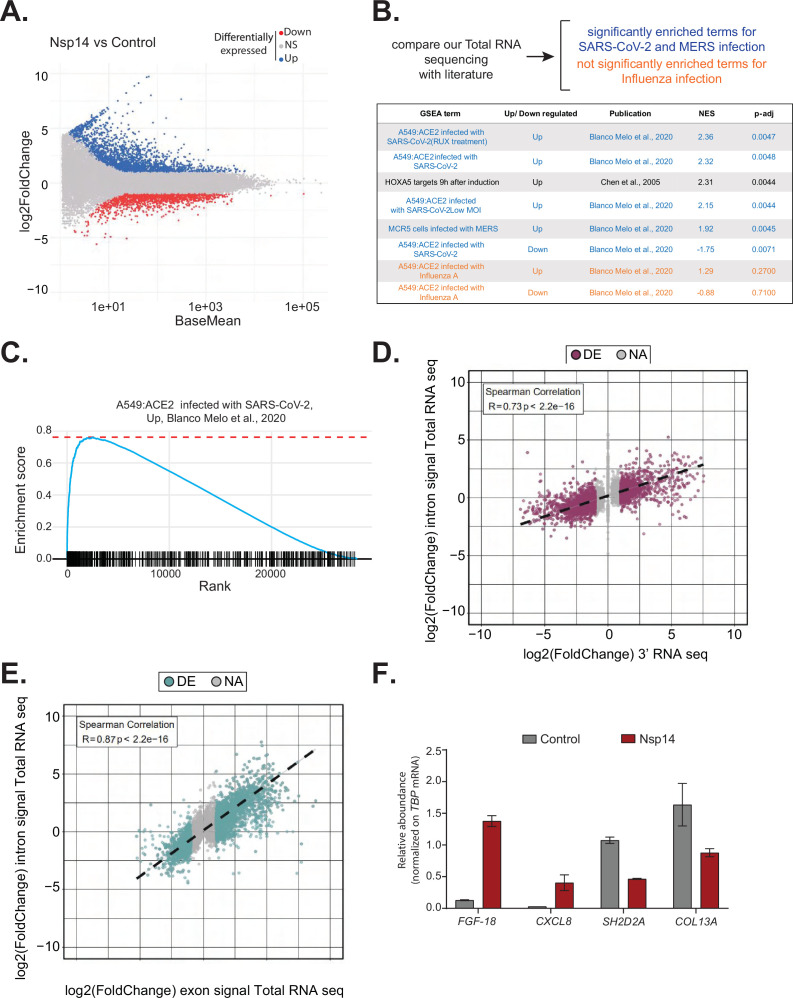
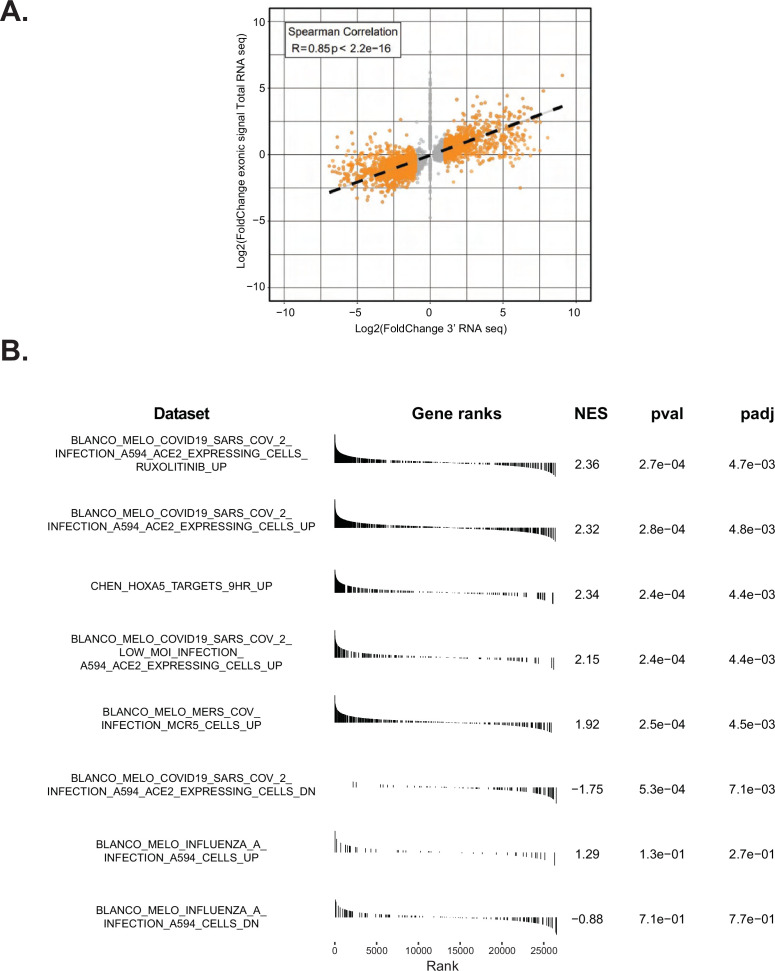
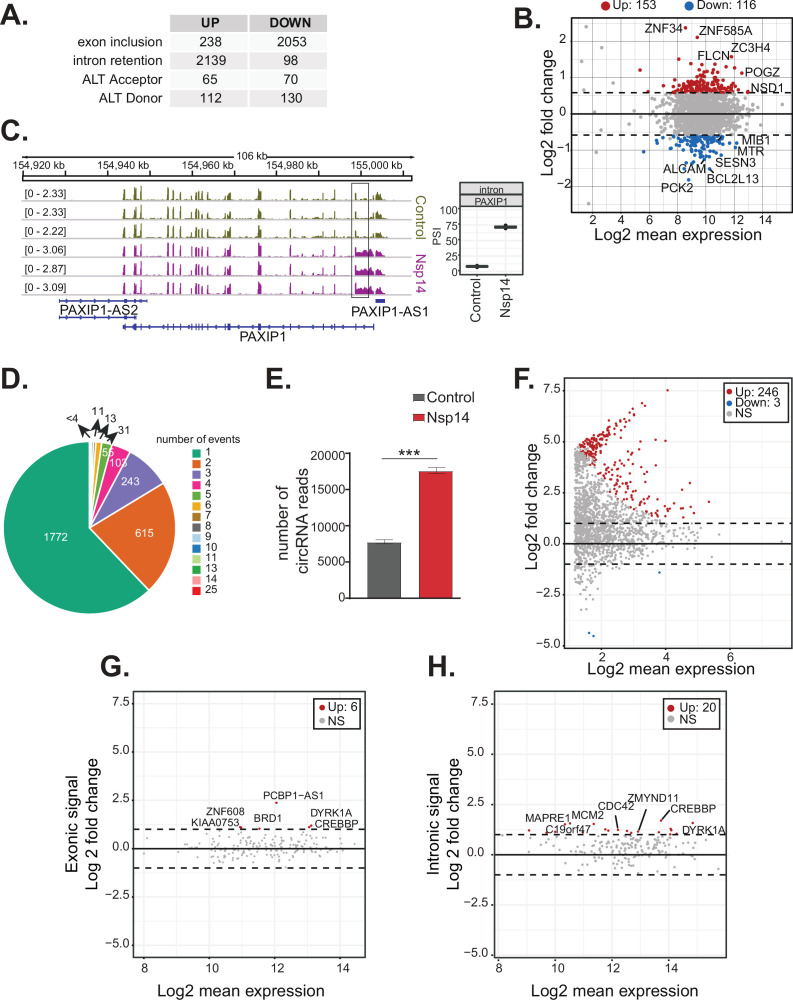
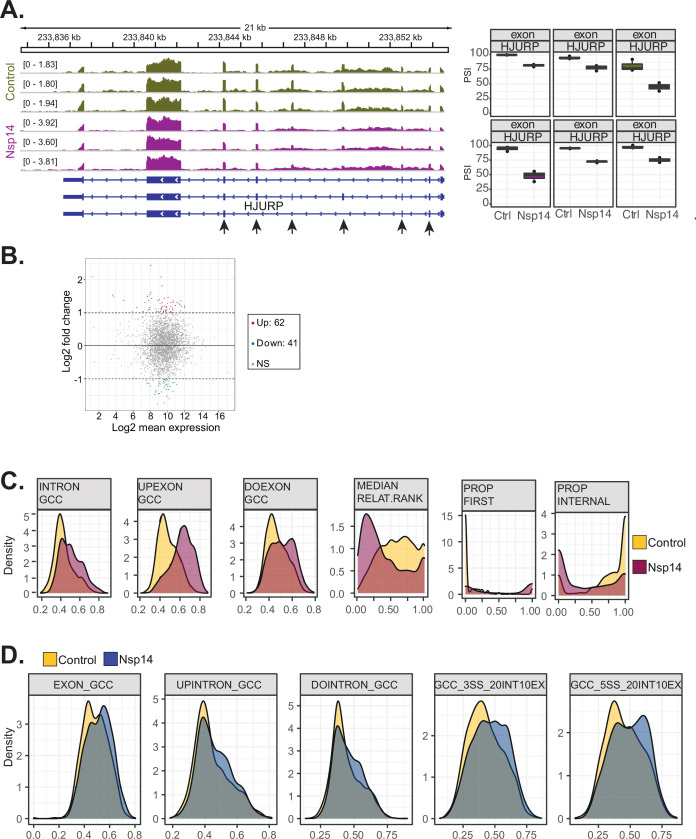
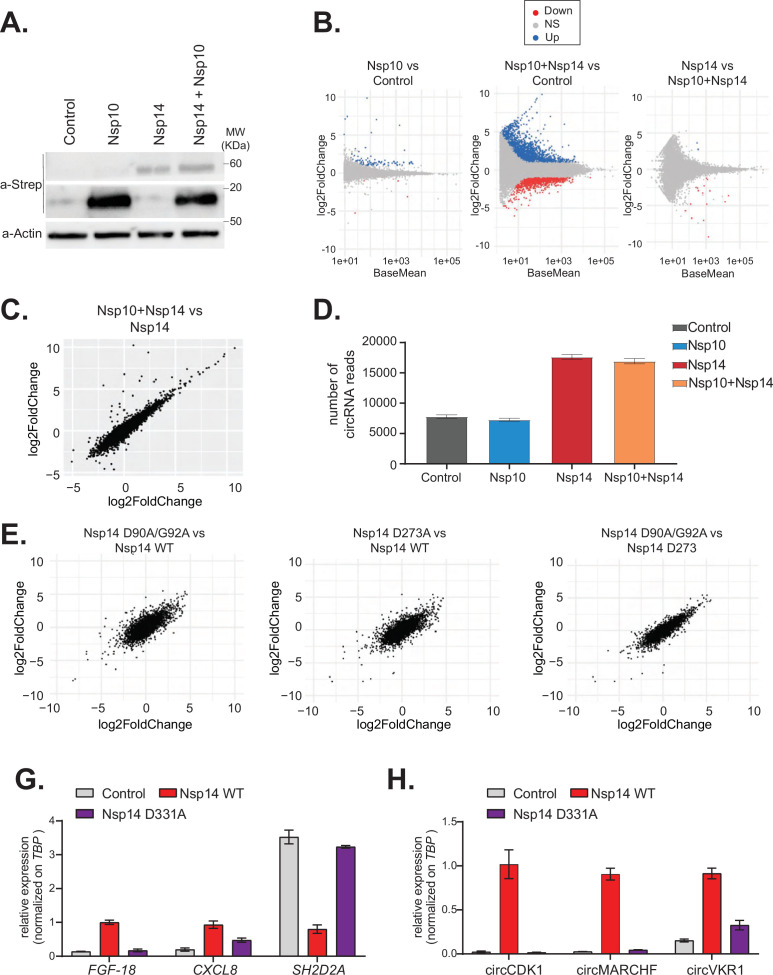
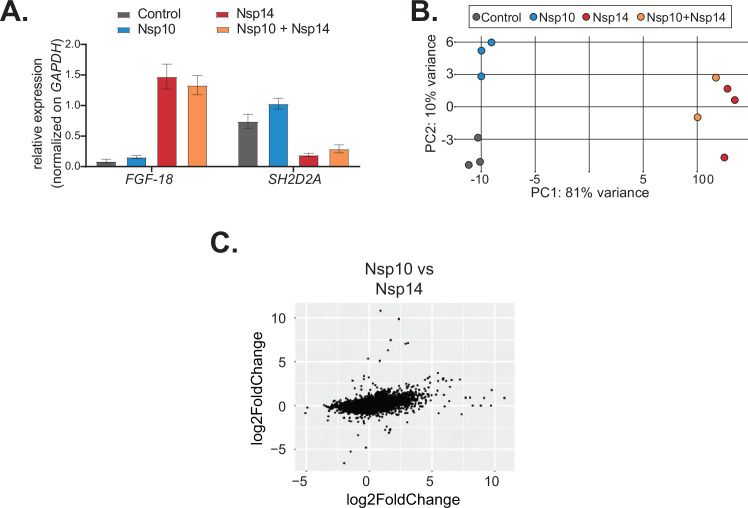
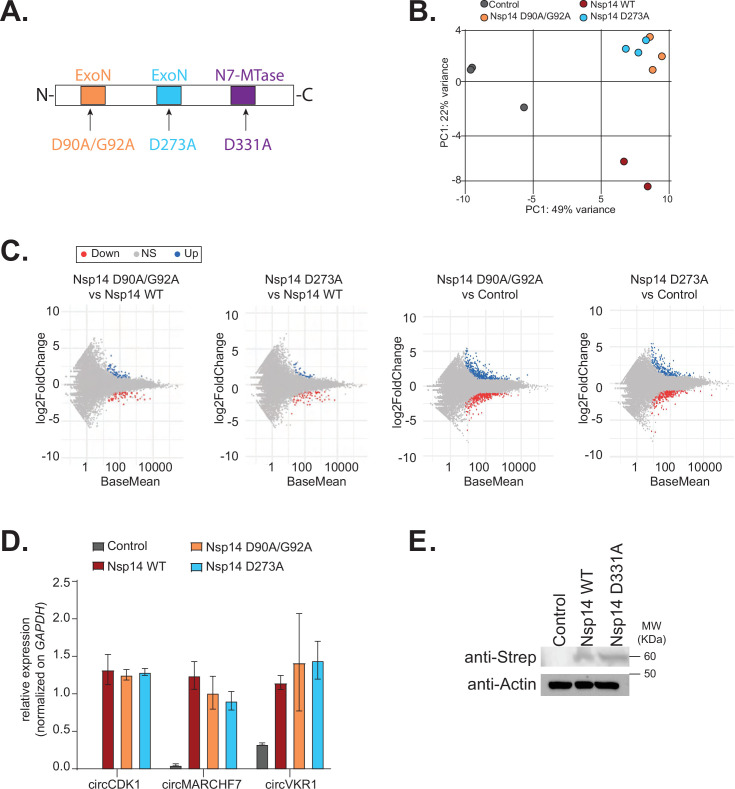
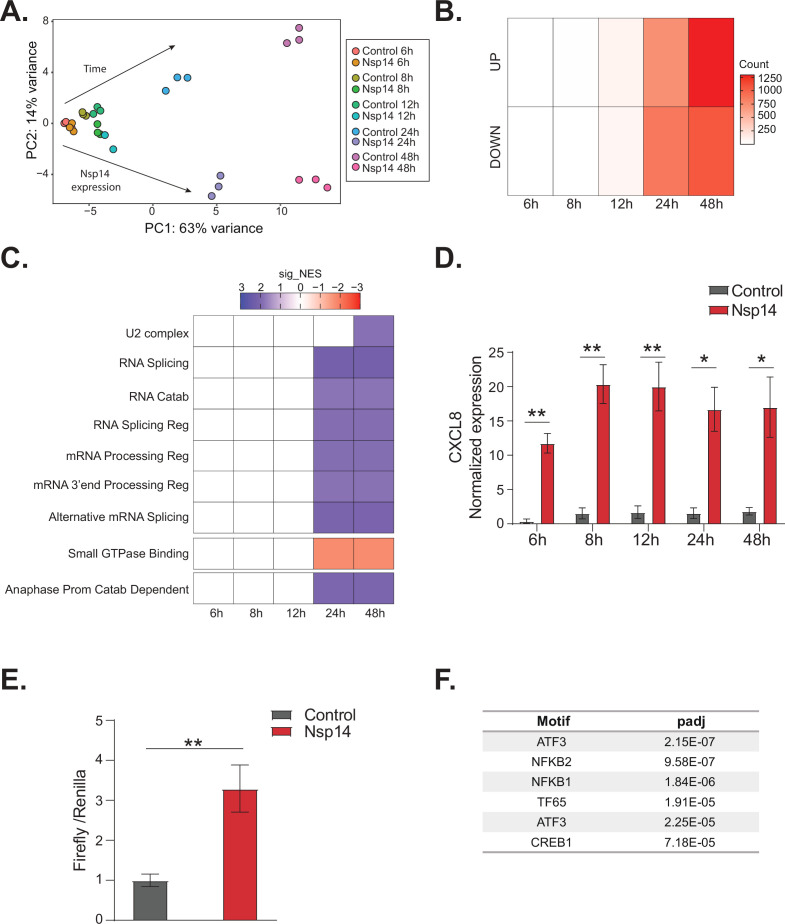
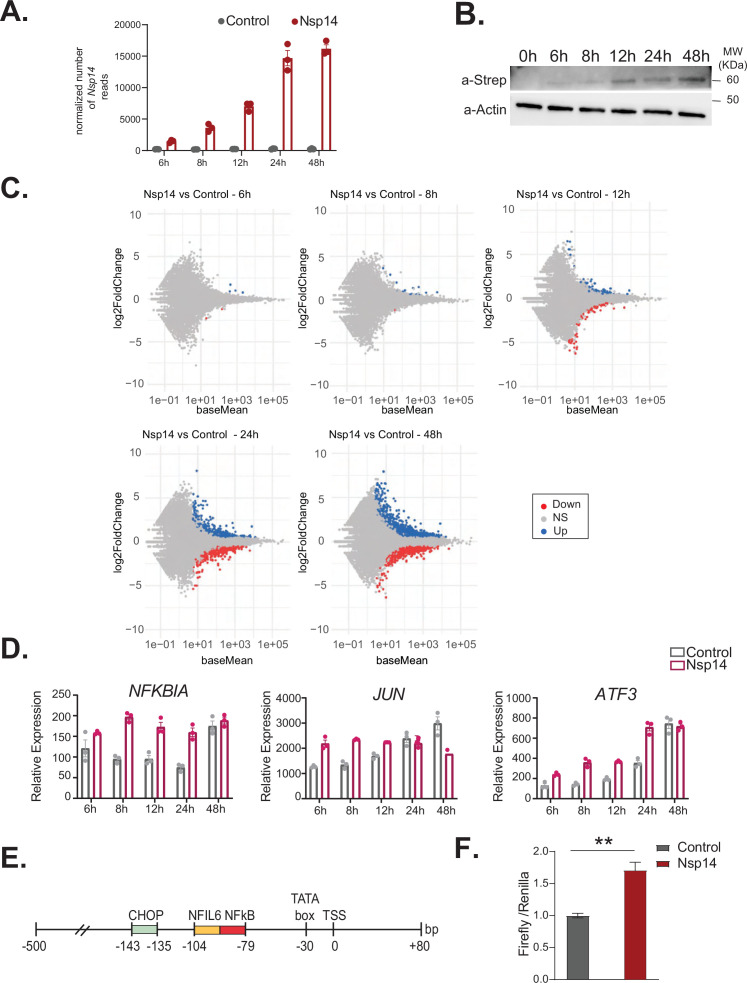
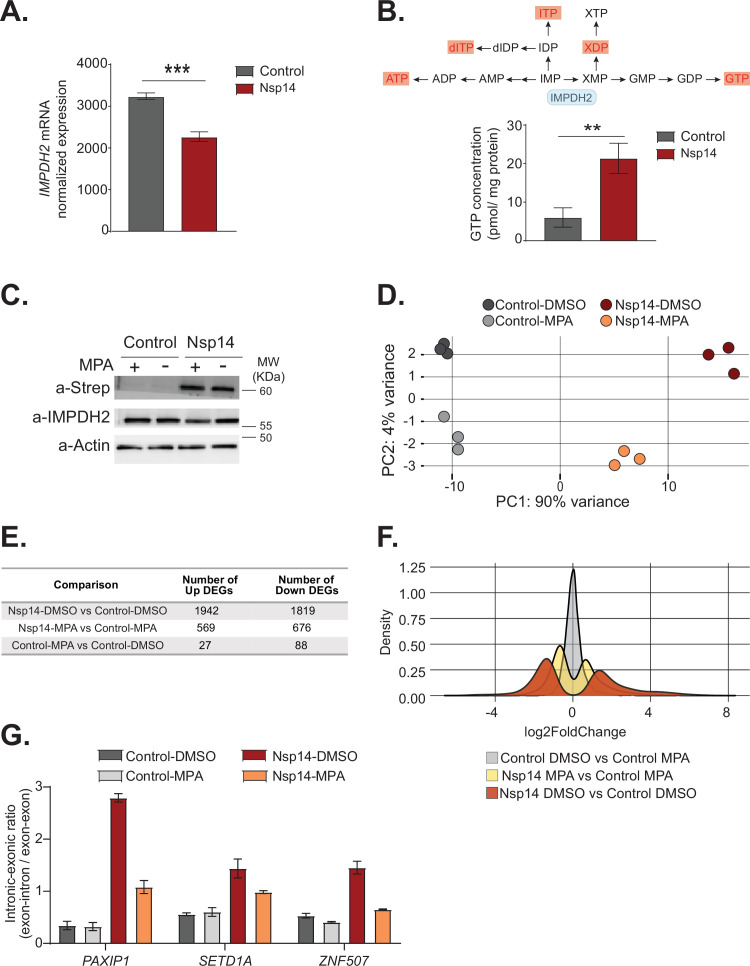
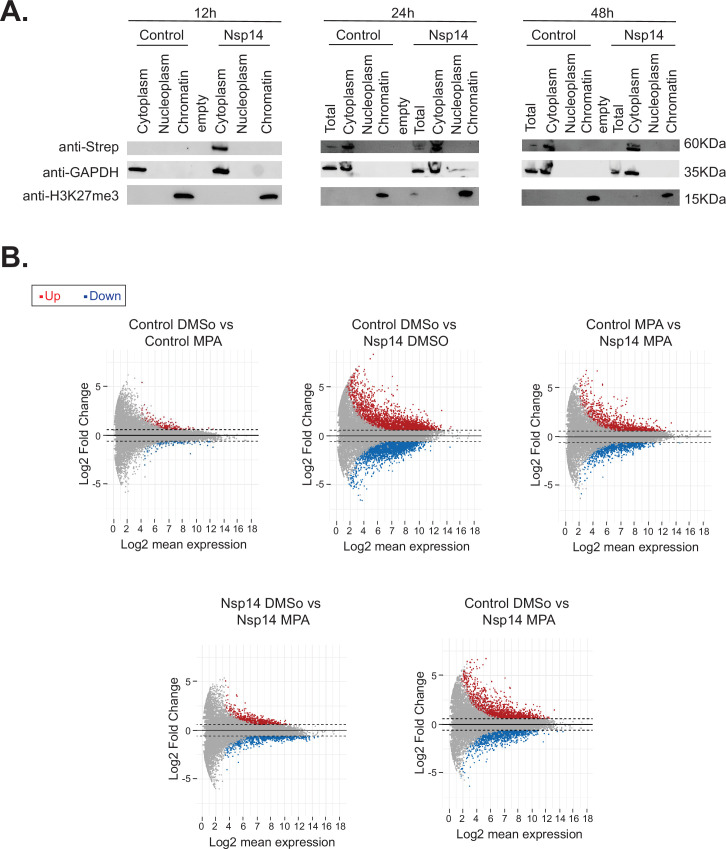
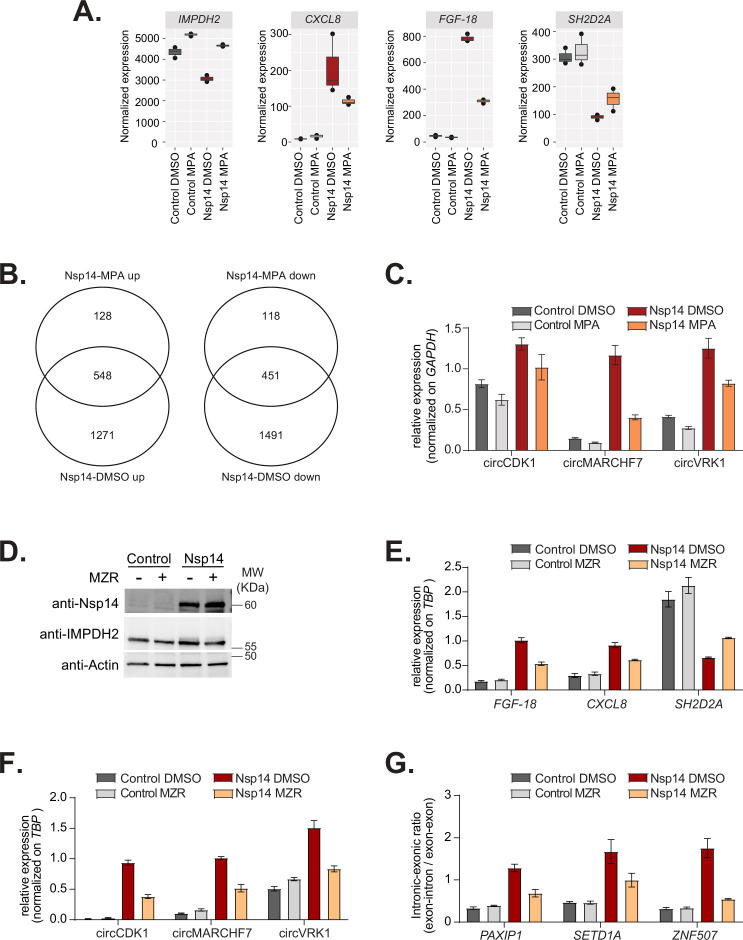
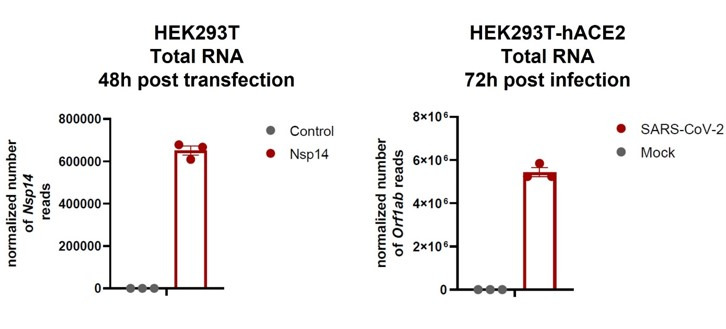
Viral infection involves complex set of events orchestrated by multiple viral proteins. To identify functions of SARS-CoV-2 proteins, we performed transcriptomic analyses of cells expressing individual viral proteins. Expression of Nsp14, a protein involved in viral RNA replication, provoked a dramatic remodeling of the transcriptome that strongly resembled that observed following SARS-CoV-2 infection. Moreover, Nsp14 expression altered the splicing of more than 1000 genes and resulted in a dramatic increase in the number of circRNAs, which are linked to innate immunity. These effects were independent of the Nsp14 exonuclease activity and required the N7-guanine-methyltransferase domain of the protein. Activation of the NFkB pathway and increased expression of CXCL8 occurred early upon Nsp14 expression. We identified IMPDH2, which catalyzes the rate-limiting step of guanine nucleotides biosynthesis, as a key mediator of these effects. Nsp14 expression caused an increase in GTP cellular levels, and the effect of Nsp14 was strongly decreased in the presence of IMPDH2 inhibitors. Together, our data demonstrate an unknown role for Nsp14 with implications for therapy.

Keywords: CXCL8; IMPDH2; Nsp14; SARS-CoV-2; chromosomes; circRNA; gene expression; human; infectious disease; microbiology; transcription.

Plain language summary

Viruses are parasites, relying on the cells they infect to make more of themselves. In doing so they change how an infected cell turns its genes on and off, forcing it to build new virus particles and turning off the immune surveillance that would allow the body to intervene. This is how SARS-CoV-2, the virus that causes COVID, survives with a genome that carries instructions to make just 29 proteins. One of these proteins, known as Nsp14, is involved in both virus reproduction and immune escape. Previous work has shown that it interacts with IMPDH2, the cellular enzyme that controls the production of the building blocks of the genetic code. The impact of this interaction is not clear. To find out more, Zaffagni et al. introduced 26 of the SARS-CoV-2 proteins into human cells one at a time. Nsp14 had the most dramatic effect, dialing around 4,000 genes up or down and changing how the cell interprets over 1,000 genes. Despite being just one protein, it mimicked the genetic changes seen during real SARS-CoV-2 infection. Blocking IMPDH2 partially reversed the effects, which suggests that the interaction of Nsp14 with the enzyme might be responsible for the effects of SARS-CoV-2 on the genes of the cell. Understanding how viral proteins affect cells can explain what happens during infection. This could lead to the discovery of new treatments designed to counteract the effects of the virus. Further work could investigate whether interfering with Nsp14 helps cells to overcome infection.


Conflict of interest statement

MZ, JH, IP, NP, SN, SK No competing interests declared

Figures

Figure 1.
Figure 1.. Severe acute respiratory syndrome coronavirus 2 (SARS-CoV-2) proteins alter gene expression distinctively.
(A) Scheme of the experimental approach. DEGs stands for differentially expressed genes and GO for Gene Ontology. (B) Heatmap showing the number of DEGs detected in 3’ RNA sequencing for each expressed SARS-CoV-2 protein. ‘Up’ stands for upregulated genes, ‘Down’ for downregulated genes. Lfc < 0.5, corrected p-value < 0.05. (C) Heatmap showing the GO analysis (colors represent the significant normalized enriched score).
Figure 2.
Figure 2.. Expression of Nsp14 induces transcriptional changes like severe acute respiratory syndrome coronavirus 2 (SARS-CoV-2) infection.
(A) MA plot showing the fold change of expression in samples expressing Nsp14 compared to control detected in the total RNA sequencing (RNA-seq). In red significantly downregulated genes, in blue upregulated genes, and in gray non significantly deregulated genes. (B) Scheme representing the approach to determine the overlap with our total RNA-seq data and already published dataset (top). Table reporting the gene set enrichment analysis (GSEA) terms, up- or downregulation, publication, the normalized enriched score (NES), and adjusted p-value (p-adj) when comparing our total RNA-seq data with previously published datasets. Significant terms related to SARS-CoV-2 and MERS infection are indicated in blue, non-significant terms related to influenza A infection are indicated in orange (bottom). (C) Example of GSEA. (D) Nsp14 expression vs. control fold change of intronic signal from total RNA-seq vs. 3’ RNA-seq signal in logarithmic scale for each detected gene. Colored dots represent significantly changing genes (fold change = 2, adjusted p-value < 0.05, N = 3). (E) Nsp14 expression vs. control fold change of intronic signal from total RNA-seq vs. exonic signal from total RNA-seq in logarithmic scale for each detected gene. Colored dots represent significantly changing genes (fold change = 2, adjusted p-value < 0.05, N = 3). (F) RT-qPCR showing the abundance of FGF-18, CXCL8, SH2D2A, and COL13A in the chromatin-bound RNA fraction in cells transfected with an empty plasmid (control) or with Nsp14 (Nsp14). Data represented as mean ± SEM, N = 3.
Figure 2—figure supplement 1.
Figure 2—figure supplement 1.. Expression of Nsp14 induces transcriptional changes as SARS-CoV2 infection.
(A) Plot showing the overlap between the 3’ RNA sequencing (RNA-seq) dataset and the total RNA-seq dataset. (B) Gene set enrichment analysis (GSEA) showing that Nsp14 expression resembles severe acute respiratory syndrome coronavirus 2 (SARS-CoV-2) infection.
Figure 2—figure supplement 2.
Figure 2—figure supplement 2.. Controls for subcellular fractionations and nascent RNA extractions.
(A) Representative RT-qPCR showing the abundance of the indicated targets (circVKR1, 18S rRNA, U6, and TBP pre-mRNA) in the indicated subcellular fractions (cytoplasmatic RNA, nucleoplasm RNA, and chromatin-bound RNA) from cells transfected with an empty plasmid. Data represented as mean ± SEM, N = 3.
Figure 3.
Figure 3.. Nsp14 expression alters the splicing of a subgroup of genes and increases circRNAs expression.
(A) Table summarizing splicing analysis comparison between Nsp14 expression and control. Thresholds used: ∆PSI (percentage of inclusion) > 15% and a non-overlapping distribution with minimum of 5% difference (N = 3). (B) Fold change vs. expression in logarithmic scale for the genes with upregulated intron retention. In red genes with increased expression and in blue the ones with downregulated expression (fold change = 2, adjusted p-value < 0.05, N = 3). (C) Representative IGV alignment tracks of on gene (PAXIP1) with intronic events differentially changing between conditions (control and Nsp14 expression). The box marks the changing event. On the right, quantification of PSI. (D) Pie chart representing number of alternative splicing events deregulated upon Nsp14 expression by gene; 1772 genes have only one alternative splicing event changing between conditions, 615 has two events and 243 genes have three alternative splicing events changing. (E) Number of circRNAs reads detected in the total RNA sequencing (RNA-seq) experiment. Data represented as mean ± SEM, N = 3, t-test, ***p-value < 0.0005. (F) Fold change vs. expression in logarithmic scale for circRNAs in Nsp14 expression vs. control. In red upregulated genes and in blue downregulated genes (fold change = 2, adjusted p-value < 0.05, N = 3). (G) Plot of fold change vs. expression in logarithmic scale for exonic signal detected in the total RNA-seq dataset in Nsp14 vs. control for genes with upregulated circRNA expression. In red genes with increased expression and (fold change = 2, adjusted p-value < 0.05, N = 3). (H) Plot of fold change vs. expression in logarithmic scale for intronic signal detected in the total RNA-seq dataset in Nsp14 vs. control for genes with upregulated circRNA expression. In red genes with increased expression and in gray non-significant ones (fold change = 2, adjusted p-value < 0.05, N = 3).
Figure 3—figure supplement 1.
Figure 3—figure supplement 1.. Examples and features of genes showing altered splicing upon Nsp14 expression.
(A) Representative IGV alignment tracks of on gene (HJURP) with multiple exonic events differentially changing between conditions (control and Nsp14expression). The box marks the changing event. On the right, quantification of percentage of inclusion (PSI). (B) Fold change vs. expression in logarithmic scale for the genes with altered splicing. In red genes with increased expression and in blue the ones with downregulated expression (fold change = 2, adjusted p-value < 0.05, N = 3). (C) Kernel density plot for six intronic features that are significantly changing (Mann Whitney U test, adjusted p-value < 0.05, N = 3) in upregulated intron retention upon Nsp14expression. Thresholds used: ∆PSI > 15% and a non-overlapping distribution with minimum of 5% difference (N = 3). (D) Kernel density plot of intron GC content. In gray the distribution for internal introns (never in first position). In blue introns that appear 10% of the times at first position and in red introns that are in first position in more than 10% of the transcripts.
Figure 4.
Figure 4.. The N7-guanine-methyltransferase domain but not the exonuclease activity of Nsp14 is required for changing gene expression.
(A) Western blot in cells transfected with an empty plasmid (control), Nsp10, Nsp14, or co-expressing Nsp10 and Nsp14 (Nsp10 + Nsp14). Nsp10 and Nsp14 were detected through the Strep tag. Actin was used as loading control. See Figure 4—source data 1. (B) MA plots showing the expression fold change in-between the indicated conditions in the total RNA sequencing (RNA-seq) dataset. Significantly upregulated genes in blue, downregulated in red, and not significantly deregulated in gray. (C) Plot showing the fold change of deregulated genes in samples co-expressing Nsp10 and Nsp14 vs. control (on the y-axis) and Nsp14 vs. control (on the x-axis). (D) Number of circRNAs reads detected in each indicated condition. Data represented as mean ± SEM, N = 3. (E) Plots showing the fold change of deregulated genes in the indicated condition vs. control. (G) RT-qPCR showing the expression of FGF-18, CXCL8, and SH2D2A upon the transfection with an empty plasmid (control), Nsp14 WT, or Nsp14 D331A. Data represented as mean ± SEM, N = 3. (H) RT-qPCR showing the expression of circCDK1, circMARCHF7, and circVKR1 upon the transfection with an empty plasmid (control), Nsp14 WT, or Nsp14 D331A. Data represented as mean ± SEM, N = 3.
Figure 4—figure supplement 1.
Figure 4—figure supplement 1.. Co-expression of Nsp10 does not change the effects induced by Nsp14.
(A) RT-qPCR showing the expression of FGF-18 and SH2D2A in the indicated conditions. Data represented as mean ± SEM, N = 3. (B) Principal component analysis (PCA) for the 3’ RNA sequencing (RNA-seq) of the indicated samples. (C) Plot showing the fold change of deregulated genes in samples expressing Nsp10 vs. control (on the y-axis) and Nsp14 vs. control (on the x-axis).
Figure 4—figure supplement 2.
Figure 4—figure supplement 2.. The N7-guanine-methyltransferase activity but not the exonuclease one of Nsp14 is required for changing gene expression.
(A) Scheme of the Nsp14 mutants generated in this study. (B) Principal component analysis (PCA) for the 3’ RNA sequencing (RNA-seq) of the indicated samples. (C) MA plots showing the expression fold change in-between the indicated conditions in 3’ RNA-seq. Significantly upregulated genes in blue, downregulated in red, and not significantly deregulated in gray. (D) RT-qPCR showing the expression of circCDK1, circMARCHF7, and circVKR1 in the indicated conditions. Data represented as mean ± SEM, N = 3. (E) Western blot showing the expression of Nsp14 WT and Nsp14 D331A, detected through the Strep tag. Actin was used as loading control. See Figure 4—figure supplement 2—source data 1.
Figure 5.
Figure 5.. NFkB pathway is activated soon after Nsp14 transfection.
(A) Principal component analysis of the 3’ RNA sequencing (RNA-seq) of the time course experiment. Arrows indicate how samples separate according to the time point or condition (Nsp14 expression or control). (B) Heatmap showing increasing number of up- and downregulated genes at different time points after Nsp14 expression. (C) Heatmap representing the Gene Ontology analysis result at the indicated time points. (D) Expression of CXCL8 across the indicated time points in the 3’ RNA-seq data. Data represented as mean ± SEM, N = 3, t-test, **p-value < 0.005, *p-value < 0.05. (E) Luciferase assay showing that CXCL8 is transcriptionally activated after Nsp14 expression. Firefly expression is controlled by CXCL8 promoter, whereas Renilla is under the control of a constitutive promoter. Data represented as mean ± SEM, N = 6, t-test, **p-value < 0.005. (F) Table showing the enrichment for specific transcription factor (TF) binding sites in the promoter (100 bp upstream the transcription starting site of the upregulated genes) (lfc >0.8, adjusted p-value < 0.05) at 8 hr after Nsp14 transfection.
Figure 5—figure supplement 1.
Figure 5—figure supplement 1.. NFkB pathway is one of the first pathways activated after Nsp14 transfection.
(A) Plot showing the normalized number of Nsp14 reads from the 3’ RNA sequencing (RNA-seq) experiment, at the indicated time points, in cells transfect with a control plasmid (control), or the Nsp14 plasmid (Nsp14). (B) Western blot showing increasing amount of Nsp14 at the indicated time points in cells transfected with the Nsp14 plasmid. Nsp14 was detected through the Strep tag. Actin was used as loading control. See Figure 5—figure supplement 1—source data 1. (C) MA plots showing the expression fold change in-between the indicated conditions in 3’ RNA-seq. Significantly upregulated genes in blue, downregulated in red, and not significantly deregulated in gray. (D) Expression of selected genes across the indicated time points from the 3’ RNA-seq dataset. Data represented as mean ± SEM, N = 3. (E) Scheme of the CXCL8 promoter region used for the Firefly reporter. (F) Luciferase assay showing NFkB activation. Firefly expression is controlled by a minimal transcriptional activator recognized by NFkB, whereas Renilla is under the control of a ubiquitous promoter. Data represented as mean ± SEM, N = 6, t-test, **p-value < 0.005.
Figure 6.
Figure 6.. Pharmacological inhibition of inosine-monophosphate dehydrogenase 2 (IMPDH2) partially reverts the transcriptional changes induced by Nsp14.
(A) Expression of IMPDH2 mRNA is reduced upon Nsp14 expression. Data from the total RNA sequencing (RNA-seq) experiment. Data represented as mean ± SEM, N = 3, t-test, ***p-value < 0.0005. (B) In the upper panel, scheme reporting some of the tested metabolites deriving from inosine-5'-monophosphate (IMP) metabolism. IMPDH2 (highlighted in light blue) catalyzes the conversion of IMP to xanthine-5’-monophosphate (XMP), precursor of guanosine-5'-triphosphate (GTP). Significantly upregulated metabolites are highlighted in red. In the lower panel, GTP cellular concentration significantly increases in Nsp14-expressing cells. Data represented as mean ± SEM, N = 3, t-test, **p-value < 0.005. (C) Western blot showing that mycophenolic acid (MPA) treatment does not alter Nsp14 (detected through the Strep-tag) or IMPDH2 expression. Actin used as loading control. See Figure 6—source data 1. (D) Principal component analysis of the 3’ RNA-seq library of the indicated samples. (E) Table reporting the number of upregulated and downregulated genes in the indicated comparisons. (F) Plot showing the distribution of fold changes of all genes detected in the 3’ RNA-seq in the indicated conditions. (G) RT-qPCR showing the retention of the first intron for PAXIP1, SETD1A, and ZNF507 in the indicated conditions. Data represented as mean ± SEM, N = 3.
Figure 6—figure supplement 1.
Figure 6—figure supplement 1.. Nsp14 localizes in the cytoplasm and IMPDH2 mediates the effects induced by Nsp14.
(A) Western blots of the subcellular fractionation and chromatin precipitation at the indicated time points post transfection (12, 24, and 48 hr) in cells transfected with an empty plasmid (control), or Nsp14 (Nsp14). Nsp14 was detected through the Strep tag. GAPDH is used as cytoplasmatic marker, and H3K27me3 as a chromatin-bound marker. See Figure 6—figure supplement 1—source data 1. (B) MA plots relative to the 3’ RNA sequencing (RNA-seq) experiment of cells transfected with a control plasmid (control) or Nsp14 (Nsp14) and treated with the vehicle (DMSO) or mycophenolic acid (MPA) (MPA). Significantly upregulated genes in blue, downregulated in red, and not significantly deregulated in gray.
Figure 6—figure supplement 2.
Figure 6—figure supplement 2.. Inhibition of IMPDH2 partially reverts the changes induced by Nsp14.
(A) Expression of inosine-monophosphate dehydrogenase 2 (IMPDH2), FGF-18, SH2D2A, and CXCL8 in the 3’ RNA sequencing (RNA-seq) dataset in the indicated conditions. (B) Venn diagram showing the common genes upregulated (left) or downregulated (right) in samples expressing Nsp14 and treated with or without mycophenolic acid (MPA). (C) RT-qPCR showing the expression of circCDK1, circMARCHF7, and circVKR1 in the indicated conditions. Data represented as mean ± SEM, N = 3. (D) Western blot showing that mizoribine (MZR) treatment does not alter Nsp14 or IMPDH2 expression. Actin used as loading control. See Figure 6—figure supplement 2—source data 1. (E) RT-qPCR showing the expression of FGF-18, CXCL8, and SH2D2A, in the indicated conditions. Data represented as mean ± SEM, N = 3. (F) RT-qPCR showing the expression of circCDK1, circMARCHF7, and circVKR1 in the indicated conditions. Data represented as mean ± SEM, N = 3. (G) RT-qPCR showing the retention of the first intron for PAXIP1, SETD1A, and ZNF507 in the indicated conditions. Data represented as mean ± SEM, N = 3.
Author response image 1.

Update of

Similar articles

Cited by

References

    1. Adcock IM, Hashemian SMR, Mortaz E, Masjedi MR, Folkerts G. Severity of acute respiratory distress syndrome resulting from tuberculosis correlates with bronchoalveolar lavage CXCL-8 expression. International Journal of Mycobacteriology. 2015;4:71. doi: 10.1016/j.ijmyco.2014.11.039. - DOI
    1. Ahangari N, Munoz DG, Coulombe J, Gray DA, Engle EC, Cheng L, Woulfe J. Nuclear IMPDH Filaments in Human Gliomas. Journal of Neuropathology and Experimental Neurology. 2021;80:944–954. doi: 10.1093/jnen/nlab090. - DOI - PMC - PubMed
    1. Ashwal-Fluss R, Meyer M, Pamudurti NR, Ivanov A, Bartok O, Hanan M, Evantal N, Memczak S, Rajewsky N, Kadener S. circRNA Biogenesis Competes with Pre-mRNA Splicing. Molecular Cell. 2014;56:55–66. doi: 10.1016/j.molcel.2014.08.019. - DOI - PubMed
    1. Bachmayr-Heyda A, Reiner AT, Auer K, Sukhbaatar N, Aust S, Bachleitner-Hofmann T, Mesteri I, Grunt TW, Zeillinger R, Pils D. Correlation of circular RNA abundance with proliferation – exemplified with colorectal and ovarian cancer, idiopathic lung fibrosis and normal human tissues. Scientific Reports. 2015;5:8057. doi: 10.1038/srep08057. - DOI - PMC - PubMed
    1. Bailey TL, Boden M, Buske FA, Frith M, Grant CE, Clementi L, Ren J, Li WW, Noble WS. MEME SUITE: tools for motif discovery and searching. Nucleic Acids Research. 2009;37:W202–W208. doi: 10.1093/nar/gkp335. - DOI - PMC - PubMed

Associated data