. 2022 Mar 16:11:e72630.
doi: 10.7554/eLife.72630.

Microtubule rescue at midzone edges promotes overlap stability and prevents spindle collapse during anaphase B

Affiliations

Microtubule rescue at midzone edges promotes overlap stability and prevents spindle collapse during anaphase B

Manuel Lera-Ramirez et al. Elife. .

Abstract

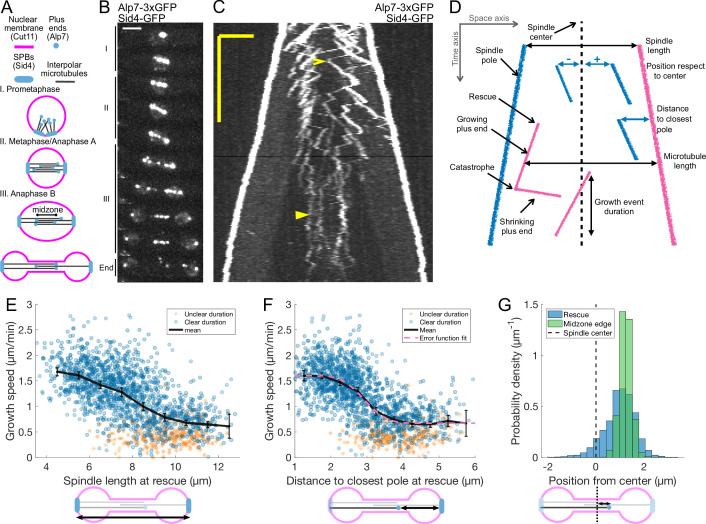
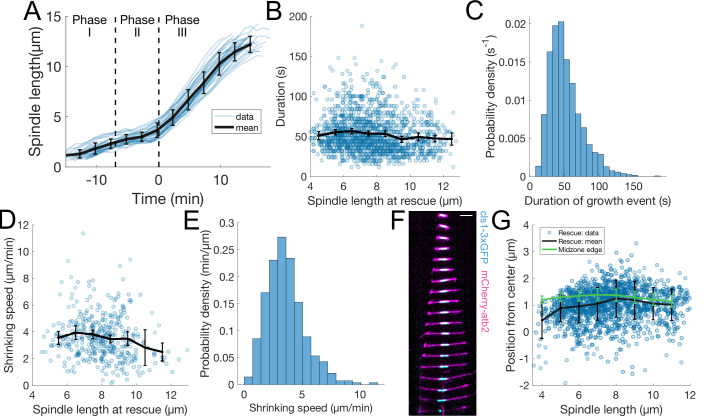
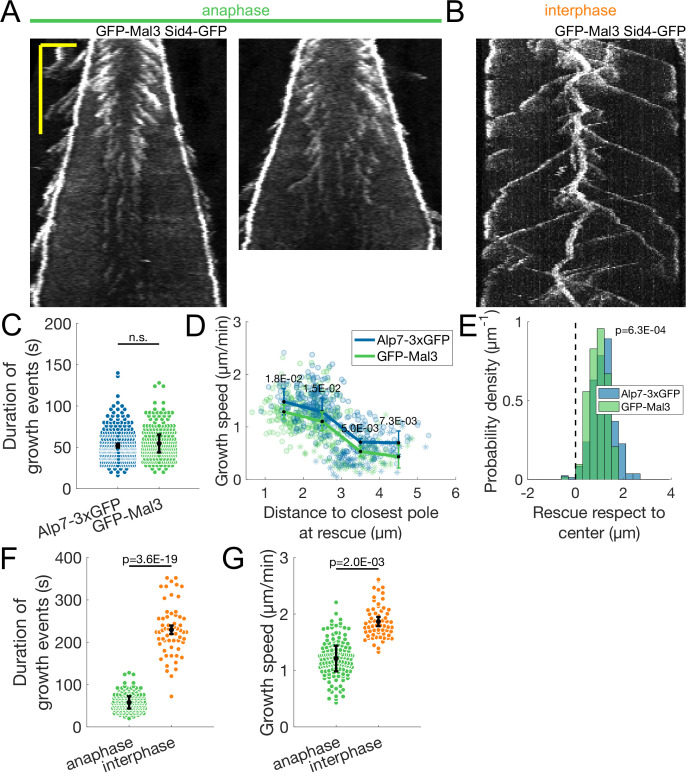
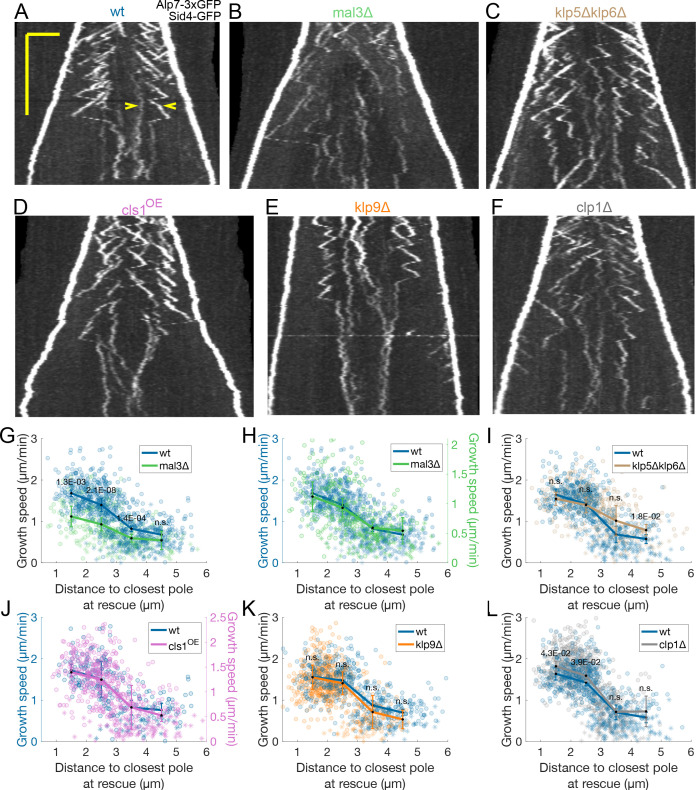
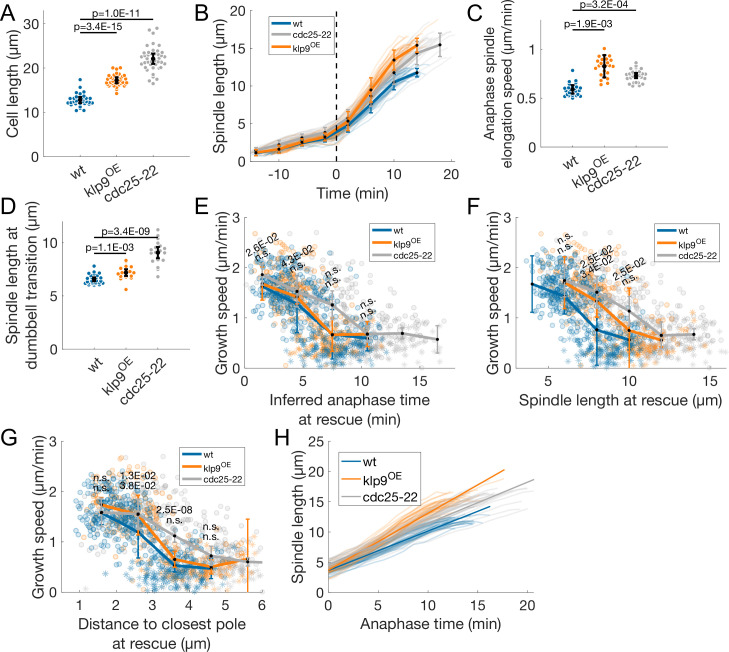
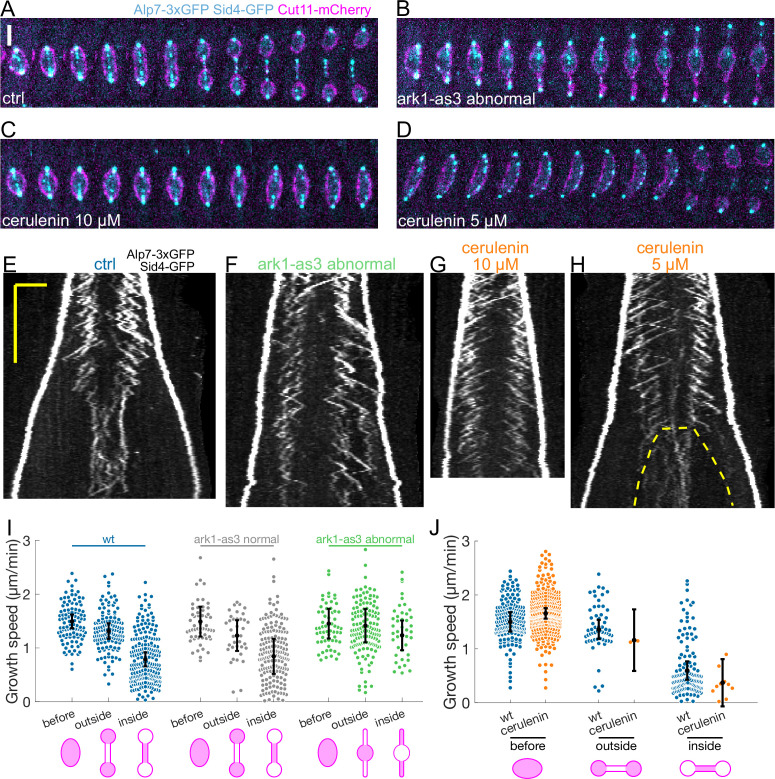
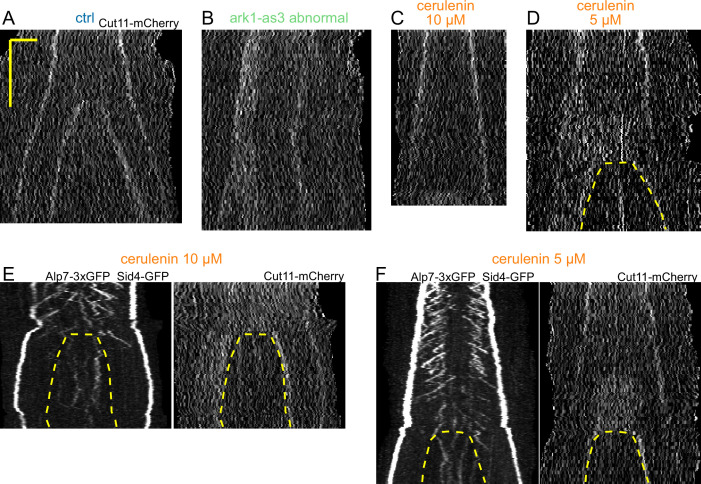
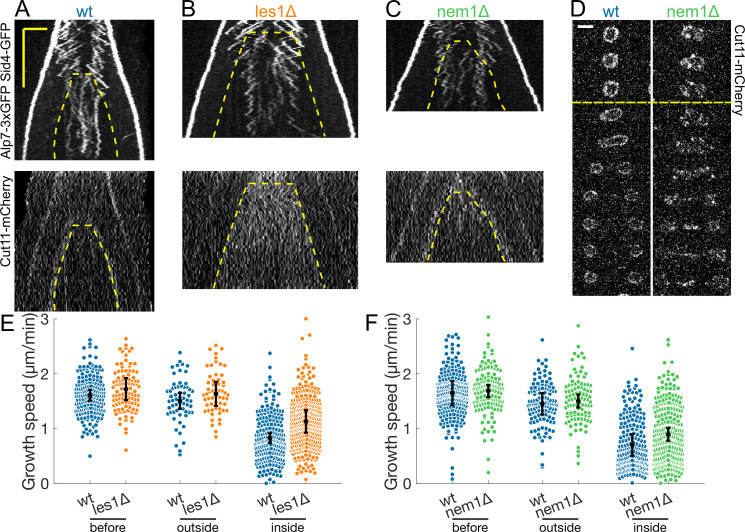
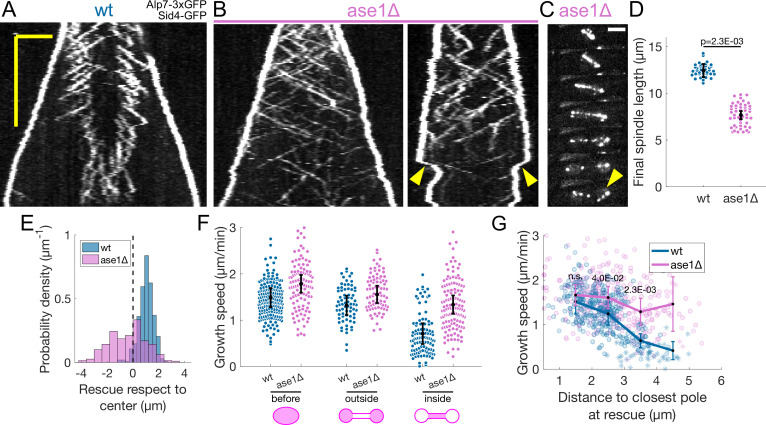
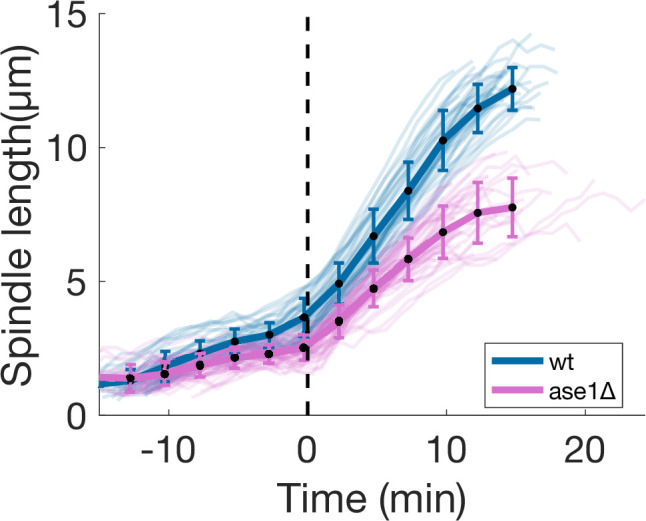
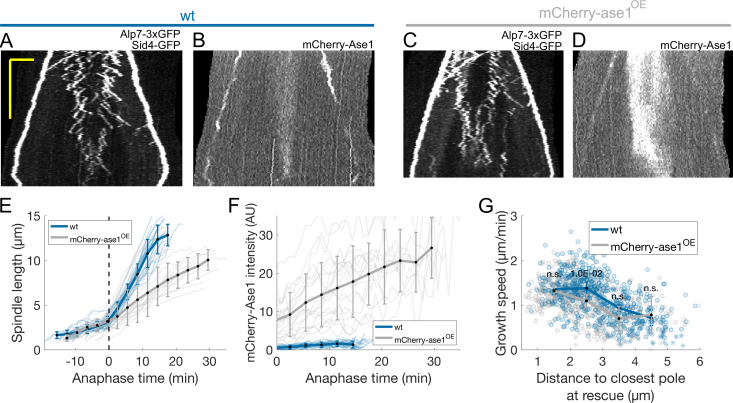
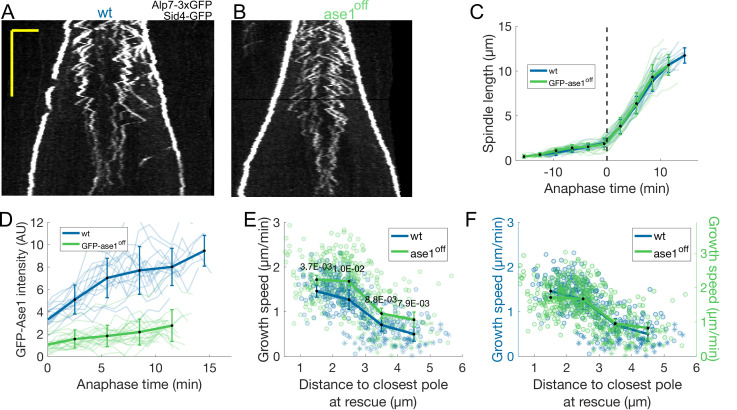
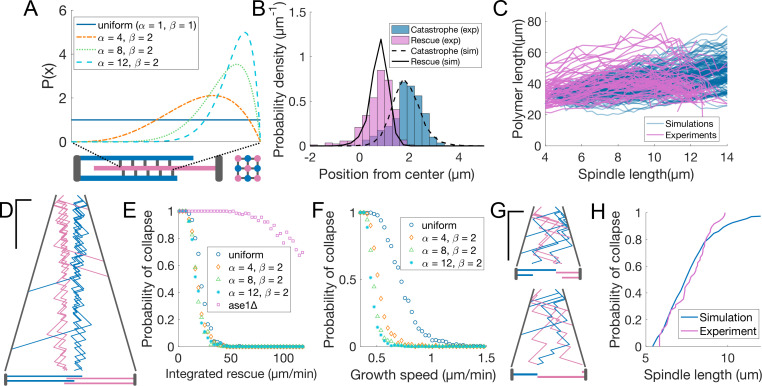
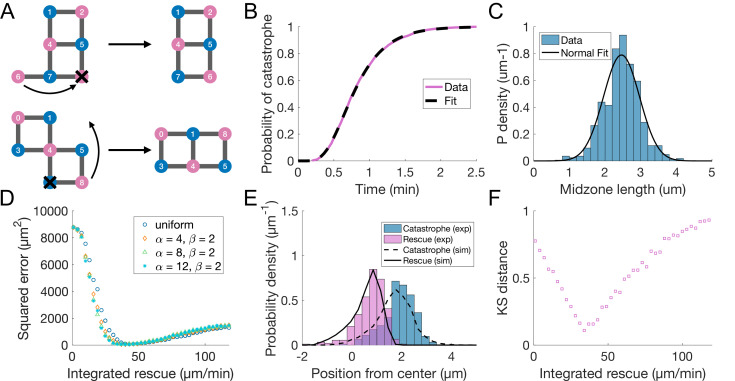
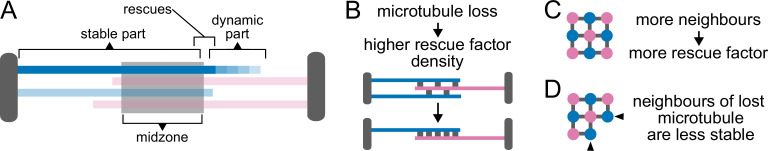
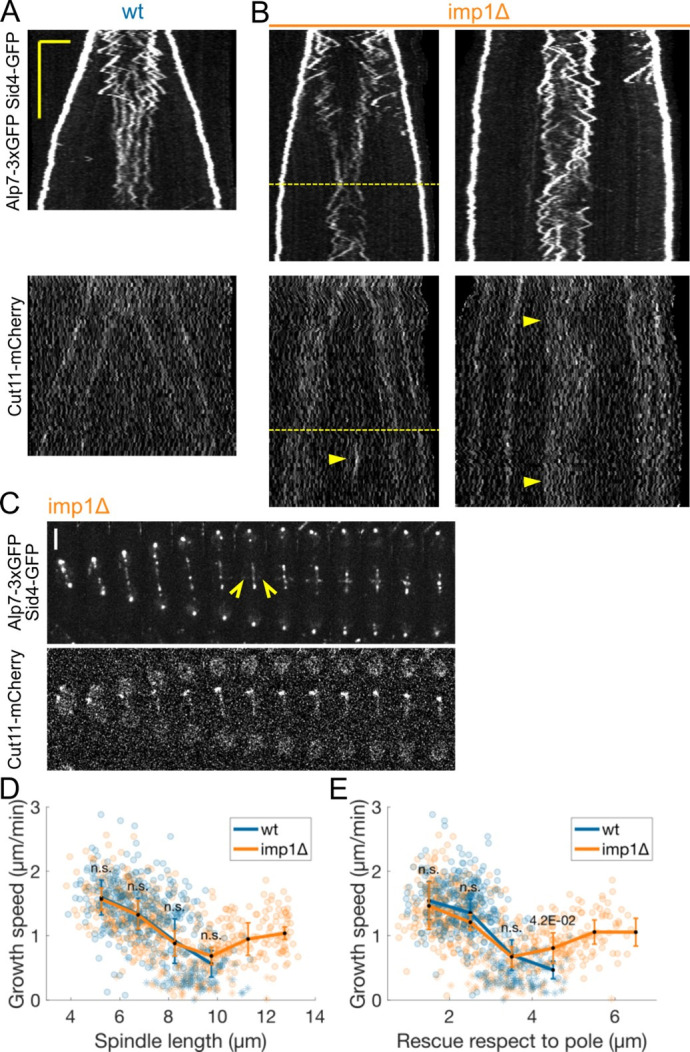
During anaphase B, molecular motors slide interpolar microtubules to elongate the mitotic spindle, contributing to the separation of chromosomes. However, sliding of antiparallel microtubules reduces their overlap, which may lead to spindle breakage, unless microtubules grow to compensate sliding. How sliding and growth are coordinated is still poorly understood. In this study, we have used the fission yeast S. pombe to measure microtubule dynamics during anaphase B. We report that the coordination of microtubule growth and sliding relies on promoting rescues at the midzone edges. This makes microtubules stable from pole to midzone, while their distal parts including the plus ends alternate between assembly and disassembly. Consequently, the midzone keeps a constant length throughout anaphase, enabling sustained sliding without the need for a precise regulation of microtubule growth speed. Additionally, we found that in S. pombe, which undergoes closed mitosis, microtubule growth speed decreases when the nuclear membrane wraps around the spindle midzone.

Keywords: S. pombe; anaphase; cell biology; live cell imaging; microtubule dynamics; microtubule sliding; modelling; spindle.


Conflict of interest statement

ML, FN, PT No competing interests declared

Figures

Figure 1.
Figure 1.. Characterization of microtubule dynamics during S. pombe anaphase B.
(A) The three phases of mitosis in the S. pombe spindle. Prophase (I), metaphase/anaphase A (II) and anaphase B (III). Names of proteins in parenthesis indicate the markers used to label the different components. (B) Time-lapse images of a mitotic spindle in a cell expressing Alp7-3xGFP and Sid4-GFP. Mitotic phases are indicated on the left. Time between images is 3 min, scalebar 3 μm. (C) Kymograph of a mitotic spindle during anaphase in a cell expressing Alp7-3xGFP and Sid4-GFP. Time is in the vertical axis (scalebar 5 min), and space is in the horizontal axis (scalebar 2 μm). Empty arrowhead marks a growth event mentioned in the main text. Filled arrowhead marks a microtubule growth event in which the start and finish cannot be clearly determined. (D) Elements that can be identified in a kymograph (left) and the derived measurements (right). Pink plus ends have their minus end at the pink pole, and blue plus ends have their minus end at the blue pole. (E–F) Microtubule growth speed as a function of spindle length (E) or distance from the plus-end to closest pole (F) at rescue (or first point if rescue could not be exactly determined). Microtubule growth events of clear duration are shown as round blue dots, others as orange stars. Thick black lines represent average of binned data, error bars represent 95% confidence interval of the mean. Pink line in (F) represents a fit of the data to an error function. (G) Histogram showing the distribution of the position of rescues with respect to the spindle center in cells expressing Sid4-GFP and Alp7-3xGFP (blue), and position of midzone edges with respect to the spindle center in cells expressing mCherry-Atb2 and Cls1-3xGFP (green, see Figure 1—figure supplement 1F, G). Dashed lines represent spindle center. Cartoons below the axis in (E–G) illustrate how the magnitudes represented are measured. Data shown in blue and orange in (E–G) comes from 1671 growth events (119 cells), from 14 independent experiments (wild-type data in Figure 2G and K and Figure 2—figure supplement 2E combined). Data shown in green in (G) comes from 832 midzone length measurements during anaphase, from 60 cells in 10 independent experiments.
Figure 1—figure supplement 1.
Figure 1—figure supplement 1.. Extra wild-type characterisation.
Characterization of microtubule dynamics during S. pombe anaphase B (A) Spindle length measured from Sid4-GFP Alp7-3xGFP signal in time (Figure 1B), from spindle formation to spindle disassembly. Time is zero at anaphase onset. The dashed lines indicate transition between mitotic phases. Thin lines represent individual trajectories, thick black line represent average of binned data. Error bars represent standard deviation of binned data. (B) Microtubule growth event duration as a function of spindle length at rescue. Thick black line represent average of binned data, error bars 95% confidence interval of the mean. (C) Histogram of values in (B). (D) Microtubule shrinkage speed as a function of spindle length at catastrophe. Thick black line represent average of binned data, error bars 95% confidence interval of the mean. (E) Histogram of values in (D). (F) Time-lapse images of the anaphase spindle of a cell expressing mCherry-Atb2 (magenta) and Cls1-3xGFP (cyan). Time between images is 1 min, scalebar 3 μm. (G) Position of rescues with respect to spindle center in cells expressing Sid4-GFP and Alp7-3xGFP (dots and black line), and position of midzone edge with respect to spindle center in cells expressing mCherry-Atb2 and Cls1-3xGFP (green line). Thick lines represent average of binned data, error bars standard deviation of binned data. Number of observations: (A) 37 cells, from three independent experiments, (B, C, F) 1425 microtubule growth events, from 119 cells, from 14 independent experiments (D) 391 microtubule shrinkage events, from 89 cells, from 14 independent experiments (F) 60 cells, from six independent experiments.
Figure 1—figure supplement 2.
Figure 1—figure supplement 2.. Microtubule dynamics in cells expressing GFP-Mal3.
(A) Two kymographs of mitotic spindles during anaphase of cells expressing Sid4-GFP and GFP-Mal3. Time is in the vertical axis (scalebar 5 min), and space is in the horizontal axis (scalebar 2 μm). Note how the signal of GFP-Mal3 is lost at late anaphase. (B) Kymographs of interphase microtubules in cells expressing Sid4-GFP and GFP-Mal3. Time is in the vertical axis and space is in the horizontal axis, scale as in (A). The persistent thick comet at the kymograph center is the SPB, labelled by Sid4-GFP, the comets emanating outwards are plus ends of interphase growing microtubules, labelled by GFP-Mal3. (C) Microtubule growth event duration in cells expressing Alp7-3xGFP (blue) and GFP-Mal3 (green). Error bars represent 95% confidence interval of the mean, p-value represents statistical significance of the difference of means between the two conditions (see Materials and methods). ‘n.s’ (not significant) indicates p > 0.05. (D) Microtubule growth speed as a function of the distance between the plus end and the closest pole at rescue (or first point if rescue could not be exactly determined) in cells expressing Alp7-3xGFP and GFP-Mal3. Microtubule growth events of clear duration are shown as round dots, others as stars. Thick lines represent average of binned data, error bars represent 95% confidence interval of the mean. p-Values represent statistical significance of the difference of means between the two conditions at each bin (see Materials and methods). (E) Histogram showing the distribution of the position of rescues with respect to the spindle center in cells expressing Sid4-GFP and Alp7-3xGFP. The dashed line represents the spindle center, p-value represents statistical significance of the difference of means between the two conditions (see Materials and methods). (F–G) Comparison of duration of growth events (F) and microtubule growth speed during anaphase and interphase in cells expressing sid4-GFP and GFP-mal3. Statistical significance shown as in (C). Data from 351 (29 cells) anaphase growth events from cells expressing Alp7-3xGFP, and 293 (33 cells) anaphase growth events and 61 (14 cells) interphase growth events from cells expressing GFP-Mal3, from four independent experiments.
Figure 2.
Figure 2.. Transition from fast to slow microtubule growth occurs in the absence of important MAPs.
(A–F) Kymographs of anaphase mitotic spindles in cells expressing Alp7-3xGFP and Sid4-GFP in different genetic backgrounds, indicated on top of each kymograph. Time is in the vertical axis (scalebar 5 minutes), and space is in the horizontal axis (scalebar 2 μm). Empty arrowheads in (A) mark two growth events mentioned in the main text. (G–L) Microtubule growth speed as a function of the distance between the plus end and the closest pole at rescue (or first point if rescue could not be exactly determined) in the genetic backgrounds indicated by the legends, and shown in (A–F). Microtubule growth events of clear duration are shown as round dots, others as stars. Thick lines represent average of binned data, error bars represent 95% confidence interval of the mean. p-values represent statistical significance of the difference of means between the two conditions at each bin (see Materials and methods). ‘n.s’ (not significant) indicates p > 0.05. In (H) and (J), the vertical axis for the non wild-type condition (shown on the right) is scaled. This compensates for an overall decrease in growth speed and is equivalent to a plot where the growth speed is normalised, since both vertical axes start at zero. Number of microtubule growth events shown: (G–H) 836 (59 cells) wt, 301 (37 cells) mal3Δ from six experiments (I) 589 (47 cells) wt, 424 (31 cells) klp5Δklp6Δ from five experiments (J) 248 (22 cells) wt, 532 (40 cells) from cls1OE from three experiments (K) 531 (36 cells) wt, 610 (40 cells) klp9Δ from four experiments (L) 589 (47 cells) wt, 753 (58 cells) clp1Δ from five experiments.
Figure 2—figure supplement 1.
Figure 2—figure supplement 1.. Comparison of growth event duration in wild-type and klp5Δklp6Δ cells.
Error bars represent 95% confidence interval of the mean, p-value represents statistical significance of the difference of means between the two conditions (see Materials and methods). Number of observations: 431 (47 cells) wt, 368 (31 cells) klp5Δklp6Δ microtubule growth events from five independent experiments.
Figure 2—figure supplement 2.
Figure 2—figure supplement 2.. Cls1-3xGFP quantifications and extra analysis of cls1off and cls1OE.
(A, C) Cls1-3xGFP total intensity on the spindle as a function of time after anaphase onset in wt, cls1-3xGFP off (A) and cls1-3xGFPOE (C) cells. (B, D) Total intensity of Cls1-3xGFP divided by total intensity of mCherry-Atb2 in a window of 2 μm at the spindle center as a function of time after anaphase onset in wt, cls1-3xGFP off (B) and cls1-3xGFPOE (D) cells. (E–F) Microtubule growth speed as a function of the distance from the plus-end to the closest pole at rescue (or first point if rescue could not be exactly determined) in wt, cls1off (E) and cls1OE (F) cells. Microtubule growth events of clear duration are shown as round dots; other events are shown as stars. (G) Same as (E), but the vertical axis for cls1off (shown on the right) is scaled. This compensates for an overall increase in growth speed and is equivalent to a plot where the growth speed is normalised, since both vertical axes start at zero. In (A–D) thin lines represent individual trajectories, thick lines represent average of binned data, and error bars represent standard deviation of binned data. In (E–G) thick lines represent average of binned data, error bars represent 95% confidence interval of the mean. p-values represent statistical significance of the difference of means between the two conditions at each bin (see Materials and methods). ‘n.s’ (not significant) indicates p > 0.05. Number of observations: (A, B) 30 wt, 31 cls1off anaphase spindles from three independent experiments, (C, D) 21 wt, 20 cls1OE anaphase spindles from two independent experiments, (E, G) 304 (24 cells) wt, 277 (31 cells) cls1off microtubule growth events from four independent experiments, (F) 248 (22 cells) wt, 532 (40 cells) cls1OE microtubule growth events from three independent experiments.
Figure 2—figure supplement 3.
Figure 2—figure supplement 3.. Extra analysis of klp9Δ and dis1Δ cells.
(A) Spindle length measured from Sid4-GFP Alp7-3xGFP signal in time (Figure 1B), from spindle formation to spindle disassembly in wild-type and klp9Δ cells. Time is zero at anaphase onset, indicated by the dashed line. Thin lines represent individual trajectories, thick lines represent average of binned data, and error bars represent standard deviation of binned data. (B) Microtubule growth speed as a function of anaphase time at rescue (or first point if rescue could not be exactly determined), inferred from the spindle length using the polynomial fits shown in (C) (see Materials and methods). (C) Anaphase spindle length as a function of time, as in (A), thin lines represent individual trajectories, thick lines represent fits to first degree polynomials of each condition used to calculate inferred anaphase time in (B) (see Materials and methods). (D) Microtubule growth speed as a function of the distance from the plus-end to the closest pole at rescue (or first point if rescue could not be exactly determined) in wt and dis1Δ cells. In (B, D) thick lines represent average of binned data, error bars represent 95% confidence interval of the mean. p-values represent statistical significance of the difference of means between the two conditions at each bin (see Materials and methods). ‘n.s’ (not significant) indicates p > 0.05. Number of observations: (A, C) 37 wt, 37 klp9Δ spindles from three independent experiments, (B) 531 (36 cells) wt, 610 (40 cells) klp9Δ microtubule growth events from four independent experiments, (D) 614 (50 cells) wt, 367 (26 cells) dis1Δ microtubule growth events from three independent experiments.
Figure 2—figure supplement 4.
Figure 2—figure supplement 4.. Rescues are clustered when deleting these MAPs.
Distribution of the position of rescues with respect to the spindle center in the genetic backgrounds indicated by the legends, and corresponding to experiments from Figure 2 and its supplements. Dotted line marks the spindle center. p-value represents statistical significance of the difference of means between the two conditions (see Methods). ‘n.s.’ (not significant) indicates p > 0.05.
Figure 3.
Figure 3.. Microtubules grow slower when they enter the nuclear membrane bridge formed at the dumbbell transition.
(A) Time-lapse images of an anaphase B mitotic spindle in a cell expressing Alp7-3xGFP, Sid4-GFP (cyan) and Cut11-mCherry (magenta). Time between images is 3 minutes, scalebar 3 μm. Filled arrowheads denote spindle poles, and empty arrowheads denote limits of the nuclear membrane bridge. Equivalent positions are marked in the kymograph in (C). (B–C) Kymographs of an anaphase B mitotic spindle in a cell expressing Alp7-3xGFP, Sid4-GFP (B) and Cut11-mCherry (C). Time is in the vertical axis (scalebar 5 min), and space is in the horizontal axis (scalebar 2 μm). Dashed lines outline the nuclear membrane bridge formed after the dumbbell transition (see Figure 1A). See legend of (A) for arrowheads. (D) Microtubule growth speed in wild-type (blue), klp9OE (orange), and cdc25-22 (grey) cells. Events are categorised according to whether rescue occurred before the dumbbell transition, and inside or outside the nuclear membrane bridge (see cartoons under x-axis). Error bars represent 95% confidence interval of the mean. For values of confidence intervals and statistical significance see Appendix 1—table 1. (E) Distance from the plus-end to the nuclear membrane bridge edge at rescue as a function of distance from the plus-end to the closest pole at rescue. Dots represent individual microtubule growth events, with colour code as in (D). Lines represent first-degree polynomial fit to the data in each condition, of which the R2 is shown in the legend. Number of events: 442 (30 cells) wt, 260 (27 cells) klp9OE, 401 (35 cells) cdc25-22, from three independent experiments.
Figure 3—figure supplement 1.
Figure 3—figure supplement 1.. Comparison of wild-type, klp9OE and cdc25-22 cells.
(A) Cell length at mitosis start. (B) Spindle length measured from Sid4-GFP Alp7-3xGFP signal in time (Figure 1B), from spindle formation to spindle disassembly. Time is zero at anaphase onset (dashed line). Thin lines represent individual trajectories, thick lines represent average of binned data. Error bars represent standard deviation of binned data. (C) Anaphase spindle elongation speed. (D) Spindle length at dumbbell transition. (E–G) Microtubule growth speed as a function of inferred anaphase time (E, see Materials and methods), spindle length (F) and distance to closest pole (G) at rescue (or first point if rescue could not be exactly determined). Microtubule growth events of clear duration are shown as round dots; other events are shown as stars. Thick lines represent average of binned data, error bars represent 95% confidence interval of the mean. p-values (top value for cdc25-22 and bottom value for klp9OE) represent statistical significance of the difference of means with respect to wild-type at each bin (see Materials and methods). ‘n.s’ (not significant) indicates p > 0.05. Inferred anaphase time in (E) is calculated from the polynomial fits in (H) (see Materials and methods). (H) Anaphase spindle length as a function of time, as in (B), thin lines represent individual trajectories, thick lines represent fits to first degree polynomials of each condition used to calculate inferred anaphase time in (E) (see Materials and methods). In (A, C, D) error bars represent 95% confidence interval of the mean, p-values represent statistical significance of the difference of means with respect to wild-type (see Materials and methods). Number of observations: (A) 33 wt, 36 klp9OE, 42 cdc25-22 cells from three independent experiments. (B, H) 30 cells of each condition, from one experiment. (C) 25 wt, 24 klp9OE, 30 cdc25-22 cells from three independent experiments. (D) 26 wt, 18 klp9OE, 19 cdc25-22 cells from three independent experiments. (E–G) 442 (30 cells) wt, 260 (27 cells) klp9OE, 401 (35 cells) cdc25-22 microtubule growth events from three independent experiments.
Figure 4.
Figure 4.. Preventing the dumbbell transition abolishes the switch from fast to slow microtubule growth.
(A–D) Time-lapse images of mitotic spindles in cells expressing Alp7-3xGFP, Sid4-GFP (cyan) and Cut11-mCherry (magenta), in different conditions: (A) wild-type +DMSO (cerulenin control), (B) ark1-as3 with 5 µM 1NM-PP1, (C) wild-type with 10 µM cerulenin, (D) wild-type with 5 µM cerulenin in which the nuclear membrane eventually undergoes dumbbell transition. Time between images is 1 min, scalebar 3 µm. (E–H) Kymographs of anaphase mitotic spindles in cells expressing Alp7-3xGFP, Sid4-GFP and Cut11-mCherry in the same conditions as (A–D). Time is in the vertical axis (scalebar 5 min), and space is in the horizontal axis (scalebar 2 μm). Dashed line in (H) outlines the nuclear membrane bridge formed after the dumbbell transition. See corresponding Cut11-mCherry kymographs in Figure 4—figure supplement 1A–D. (I) Microtubule growth speed in cells treated with 5 µM 1NM-PP1, blue: wild-type cells, grey: ark1-as3 cells that underwent normal chromosome segregation (‘ark1-as3 normal’), green: ark1-as3 cells that failed chromosome segregation and did not undergo dumbbell transition (‘ark1-as3 abnormal’). Events are categorised according to where the rescue occurred (see cartoons under x-axis. Note that for ‘ark1-as3 abnormal’, the meaning of ‘outside’ and ‘inside’ categories is different due to the failure to undergo dumbbell transition). (J) Microtubule growth speed in wild-type cells treated with DMSO (blue) or 10 µM cerulenin (orange). Events are categorised according to where the rescue occurred (see cartoons below). Error bars represent 95% confidence interval of the mean. For values of confidence intervals and statistical significance see Appendix 1—Tables 2 and 3. Number of events: (I) 446 (25 cells) wt, 257 (20 kymographs) ark1-as3 normal, 240 (17 cells) ark1-as3 abnormal, from four experiments. (J) 368 (28 cells) wt, 328 (23 cells) cerulenin, from four experiments.
Figure 4—figure supplement 1.
Figure 4—figure supplement 1.. Kymographs of the Cut11-mCherry channel and more cerulenin examples.
Preventing the dumbbell transition abolishes the transition from fast to slow microtubule growth (A–D) Kymographs of the Cut11-mCherry channel, for the same spindles as Figure 4E–H. Time is in the vertical axis (scalebar 5 minutes), and space is in the horizontal axis (scalebar 2 µm). (E–F) Kymographs of spindles that underwent dumbbell transition in the presence of 10 µM (E) and 5 µM (F) cerulenin. Scale as in A. Dashed lines outline the nuclear membrane bridge formed after the dumbbell transition.
Figure 4—figure supplement 2.
Figure 4—figure supplement 2.. Formation of Les1 stalks is required for normal decrease in growth speed associated with internalisation of microtubules in the nuclear membrane bridge.
(A–C) Kymographs of anaphase B mitotic spindles in cells expressing Alp7-3xGFP, Sid4-GFP (top) and Cut11-mCherry (bottom) in wild-type (A) and cells deleted for les1 (B) and nem1 (C). Time is in the vertical axis (scalebar 5 min), and space is in the horizontal axis (scalebar 2 µm). Dashed lines outline the nuclear membrane bridge formed after the dumbbell transition (see Figure 1A). (D) Time-lapse images of the nuclear membrane during mitosis labelled by Cut11-mCherry in wild-type (left) and nem1Δ (right). Dashed line marks anaphase onset. Time between images is 3 min, scalebar 3 µm. Note how in nem1Δ cells the nuclear membrane is ruffled and shows clusters of Cut11-mCherry, unlike the wild-type. (E–F) Microtubule growth speed in wild-type and cells deleted for les1 (E) and nem1 (F). Events are categorised according to where the rescue occurred (see cartoons under x-axis in Figure 3D). Error bars represent 95% confidence interval of the mean. For values of confidence intervals and statistical significance see Appendix 1—table 2 and Appendix 1—table 3. Number of events: (E) 452 (32 cells) wt, 478 (27 cells) les1Δ from four experiments. (F) 574 (42 cells) wt, 495 (37 cells) nem1Δ from three experiments.
Figure 5.
Figure 5.. Ase1 is required for normal rescue distribution and for microtubule growth speed to decrease normally during anaphase B.
(A, B) Kymographs of anaphase mitotic spindles in wild-type (A) and ase1Δ (B) cells expressing Alp7-3xGFP and Sid4-GFP. Time is in the vertical axis (scalebar 5 min), and space is in the horizontal axis (scalebar 2 μm). (C) Time-lapse images of a mitotic spindle in a cell where ase1 is deleted, expressing Alp7-3xGFP and Sid4-GFP. Time between images is 3 min, scalebar 3 μm. Arrowhead indicates spindle collapse that occurs due to loss of microtubule overlap. (D) Distribution of final spindle length in wild-type and ase1Δ cells. Same data as in Figure 5—figure supplement 1. Error bars represent 95% confidence interval of the mean, p-value represents statistical significance of the difference of means between the two conditions (see Materials and methods). (E) Distribution of the position of rescues with respect to the spindle center in wild-type and ase1Δ cells. Dotted line marks the spindle center. (F) Microtubule growth speed in wild-type (blue) and ase1Δ (pink) cells. Events are categorised according to whether rescue occurred before the dumbbell transition, and inside or outside the nuclear membrane bridge (see cartoons under x-axis). Error bars represent 95% confidence interval of the mean. For values of confidence intervals and statistical significance see Appendix 1—table 4. (G) Microtubule growth speed as a function of the distance between the plus end and the closest pole at rescue (or first point if rescue could not be exactly determined) in wild-type (blue) and ase1Δ (pink) cells expressing Sid4-GFP Alp7-3xGFP and Cut11-mCherry. Microtubule growth events of clear duration are shown as round dots, others as stars. Thick lines represent average of binned data, error bars represent 95% confidence interval of the mean. p-values represent statistical significance of the difference of means between the two conditions at each bin (see Materials and methods). ‘n.s’ (not significant) indicates p > 0.05. Number of events shown: (D) 37 wt, 48 ase1Δ cells from three independent experiments. (E) 402 (34 cells) wt, 316 (39 cells) ase1Δ microtubule growth events from four independent experiments. (F, G) 356 (24 cells) wt, 310 (35 cells) ase1Δ microtubule growth events from 6 independent experiments. Only the cells which underwent dumbbell transition were used for the analysis in (F, G).
Figure 5—figure supplement 1.
Figure 5—figure supplement 1.. ase1Δ spindle elongation dynamics.
Spindle length measured from Sid4-GFP Alp7-3xGFP signal in time, from spindle formation to spindle disassembly in wild-type and ase1Δ cells. Time is zero at anaphase onset. The dashed line indicates the start of anaphase. Same data as Figure 5D. Thin lines represent individual trajectories, thick lines represent average of binned data and error bars represent standard deviation of binned data. Number of observations: 37 wt, 48 ase1Δ cells from three independent experiments.
Figure 5—figure supplement 2.
Figure 5—figure supplement 2.. Overexpression of mCherry-ase1.
(A–D) Kymographs of anaphase mitotic spindles in cells expressing Alp7-3xGFP, Sid4-GFP, and mCherry-Ase1 from its endogenous promoter (wild-type, A, B) or overexpressed under the control of a P1nmt1 promoter (mCherry-ase1OE, C, D). Time is in the vertical axis (scalebar 5 min), and space is in the horizontal axis (scalebar 2 μm). (E) Spindle length as a function of time in wild-type (blue) and mCherry-ase1OE (grey) cells. (F) mCherry-Ase1 total intensity on the spindle as a function of time after anaphase onset in wild-type (blue) and mCherry-ase1OE (grey) cells. (G) Microtubule growth speed as a function of the distance between the plus end and the closest pole at rescue (or first point if rescue could not be exactly determined) in wild-type (blue) and mCherry-ase1OE (grey) cells. Thick lines represent average of binned data, error bars represent 95% confidence interval of the mean. p-values represent statistical significance of the difference of means between the two conditions at each bin (see Methods). In (E, F) thin lines represent individual trajectories, thick lines represent average of binned data and error bars represent standard deviation of binned data. Number of observations: (E, F) 20 wt, 21 mCherry-ase1OEcells from one experiment (G) 567 (50 cells) wt, 490 (43 cells) mCherry-ase1OEmicrotubule growth events from four independent experiments.
Figure 5—figure supplement 3.
Figure 5—figure supplement 3.. Shutoff of GFP-ase1 and ase1.
(A, B) Kymographs of anaphase mitotic spindles in in wild-type (A) and ase1off (B) cells expressing Alp7-3xGFP and Sid4-GFP. Time is in the vertical axis (scalebar 5 minutes), and space is in the horizontal axis (scalebar 2 μm). (C) Spindle length as a function of time in wild-type (blue) and GFP-ase1 off (green) cells. (D) GFP-Ase1 total intensity on the spindle as a function of time after anaphase onset in wild-type (blue) and GFP-ase1 off (green) cells. (E) Microtubule growth speed as a function of the distance between the plus end and the closest pole at rescue (or first point if rescue could not be exactly determined) in wild-type (blue) and ase1off (green) cells. (F) Same as (E), but the axis for ase1off (shown on the right) is scaled. This compensates for an overall increase in growth speed and is equivalent to a plot where the growth speed is normalised, since both vertical axes start at zero. In (C, D), thin lines represent individual trajectories, thick lines represent average of binned data and error bars represent standard deviation of binned data. In (E, F), thick lines represent average of binned data, error bars represent 95% confidence interval of the mean. p-values represent statistical significance of the difference of means between the two conditions at each bin (see Materials and methods). Number of observations: (C, D) 16 wt, 21 GFP-ase1 off cells from two independent experiments (E, F) 304 (24 cells) wt, 430 (41 cells) ase1off microtubule growth events from four independent experiments.
Figure 6.
Figure 6.. Promoting microtubule rescues at the midzone edge is sufficient to coordinate sliding and growth.
(A) Arrangement of microtubules in simulations, shown as longitudinal (bottom left) and perpendicular (bottom right) sections of the spindle. Microtubules are colour coded according to their orientation, SPBs and connections between microtubules are shown in grey. The dashed lines linking the midzone edges to the extremes of the x-axis represent the fact that the parameter x maps the position along the midzone to a value that goes from zero to one. Curves inside the graph represent the value of P(x) from Equation 5 (see Materials and methods) for parameters indicated in the legend. (B) Distribution of positions of microtubule catastrophe and rescue with respect to the spindle center in experiments (histograms, same data as Figure 1G), and 200 simulations (lines), for R = 55 μm/min, α=4, β=2. (C) Total polymerised tubulin as a function of spindle length in 200 simulations (blue) and total mCherry-atb2 intensity (scaled) as a function of spindle length in 60 cells from six independent experiments (pink). Simulation Parameters as in (B). (D) Kymograph generated from a simulation with parameters as in (B). Plus-ends are colour coded according to their orientation, SPBs are shown in grey. Time is in the vertical axis (scalebar 5 min), and space is in the horizontal axis (scalebar 2 µm). Total simulated time is 20 min. Cartoon below the kymograph shows the lengths of microtubules in the spindle at the last timepoint in the kymograph. (E) Probability of spindle collapse as a function of the total rescue factor (R). Each dot represents a set of 200 simulations with equal parameters (Table 2), and its value on the y axis is the fraction of the simulations in which the spindle collapsed in the 20 min of simulated time. (F) Same as (E), but each dot represents 500 simulations, for various values of microtubule growth speed. (G) Simulation kymograph as in (D), for ase1Δ, where rescue activity is uniformly distributed along the whole length of microtubules. Both simulations ended with a spindle collapse due to loss of the overlap between antiparallel microtubules (see cartoons below). R = 34 µm/min (H) Cumulative distribution of final spindle length in ase1Δ cells (pink, same data as Figure 5E), and in 200 ase1Δ simulations (blue). See Table 2 for simulation parameters.
Figure 6—figure supplement 1.
Figure 6—figure supplement 1.. Additional model figures.
Promoting microtubule rescues at the midzone edge is sufficient to coordinate sliding and growth (A) Cartoon depicting microtubule rearrangements occurring in simulations following the loss of a microtubule. They can happen in two ways. (top) A microtubule is lost and there is an existing one in the same orientation which has less neighbours. (bottom) A neighbour of a lost microtubule would have more neighbours if it was in another position. (B) Cumulative distribution of duration of microtubule growth events in cells expressing Sid4-GFP and Alp7-3xGFP (blue line, same data as Figure 1—figure supplement 1C), plotted along the fit of the data to Equation 10 (see Methods, pink dashed line, θ=3.17 min–1 and n=8.53). (C) Histogram showing the distribution of midzone length in cells expressing mCherry-Atb2 and Cls1-3xGFP (same data as in Figure 1G). Black line represents a fit to a normal distribution (μ = 2.5 μm, σ=0.5 μm) (D) Sum of squared error resulting from comparing total polymer length as a function of spindle length in simulations with total tubulin intensity as a function of spindle length in experiments (pink data in Figure 6C, see Materials and methods). Each dot corresponds to a set of 200 simulations with equal parameters, and is placed on the x axis according to the value of integrated rescue R. (E) Distribution of positions of microtubule catastrophe and rescue with respect to the spindle center in experiments (histograms, same data as Figure 1G), and 200 simulations (lines), for R = 55 μm/min, α=1, β=1 (uniform rescue). (F) Kolmogorov-Smirnov distance obtained when comparing the distribution of spindle length at collapse in ase1Δ cells (data in Figure 6H) and simulations. This distance can go from 0 to 1 and is smaller when the probability distributions in experiments and simulations are similar (see Materials and methods). Each dot corresponds to a set of 200 simulations with equal parameters, and is placed on the x axis according to the value of integrated rescue R (Equation 11, see Materials and methods). The minimal value of Kolmogorov-Smirnov distance corresponds to R=34 μm/min, and this is the value used in Figure 6G and H. See Table 2 for simulation parameters.
Figure 7.
Figure 7.. Model schematic Cartoons depicting the main consequences of the model assumptions.
SPBs, the midzone and rescue factor distributed between microtubule overlaps are shown in grey. Microtubules are colour coded according to their orientation. (A) and (B) show longitudinal sections of the spindle. (C) and (D) show perpendicular sections. (A) Since rescues occur most often at midzone edges (Figure 1G), microtubules are stable from pole to midzone, and only their distal parts including the plus ends alternate between assembly and disassembly phases. (B) Because rescue factor levels on the spindle remain constant during anaphase (Figure 2—figure supplement 2A), spindles become increasingly stable as they lose microtubules. (C) We assume that the fixed amount of rescue factor distributes along overlaps, so rescue rate is proportional to the number of neighbours of a microtubule. (D) Therefore, when a microtubule depolymerises, its antiparallel neighbours lose one neighbour, while the microtubules in the same orientation as the lost one keep the same number of neighbours. This simple effect promotes even loss of microtubules from both poles.
Author response image 1.
Author response image 1.. (A-B) Kymographs of anaphase B mitotic spindles in cells expressing Alp7-3xGFP, Sid4-GFP (top) and Cut11-mCherry (bottom) in wild-type (A) and imp1 deleted (B) cells.
Dashed line indicates increase in microtubule growth speed at late anaphase. Arrowheads in (B) mark a cluster of Cut11-mCherry (left) or higher intensity of Cut11-mCherry at the center of the spindle. (C) Time-lapse images of imp1 deleted cells expressing Alp7-3xGFP, Sid4-GFP (top) and Cut11-mCherry (bottom). Time between images is 3 minutes, scalebar 3 μm. Empty arrowheads mark the appearance of the Post Anaphase Array (PAA) (D-E) Microtubule growth speed as a function of spindle length (D) and distance to closest pole (E) at rescue (or first point if rescue could not be exactly determined). Microtubule growth events of clear duration are shown as round dots; other events are shown as stars. Thick lines represent average of binned data, error bars represent 95% confidence interval of the mean. p-values represent statistical significance of the difference of means with respect to wild-type at each bin (see Methods). “n.s” (not significant) indicates p>0.05. Number of observations: 431 (33 cells) wt, 549 (36 cells) imp1Δ microtubule growth events from 4 independent experiments. We have uploaded the source data with the manuscript.

Similar articles

Cited by

References

    1. Aarts E, Dolan CV, Verhage M, van der Sluis S. Multilevel analysis quantifies variation in the experimental effect while optimizing power and preventing false positives. BMC Neuroscience. 2015;16:1–15. doi: 10.1186/s12868-015-0228-5. - DOI - PMC - PubMed
    1. Afonso O., Matos I, Pereira AJ, Aguiar P, Lampson MA, Maiato H. Feedback control of chromosome separation by a midzone Aurora B gradient. Science (New York, N.Y.) 2014;345:332–336. doi: 10.1126/science.1251121. - DOI - PMC - PubMed
    1. Afonso O, Castellani CM, Cheeseman LP, Ferreira JG, Orr B, Ferreira LT, Chambers JJ, Morais-de-Sá E, Maresca TJ, Maiato H. Spatiotemporal control of mitotic exit during anaphase by an aurora B-Cdk1 crosstalk. eLife. 2019;8:e47646. doi: 10.7554/eLife.47646. - DOI - PMC - PubMed
    1. Aist JR, Liang H, Berns MW. Astral and spindle forces in PtK2 cells during anaphase B: A laser microbeam study. Journal of Cell Science. 1993;104:1207–1216. doi: 10.1242/jcs.104.4.1207. - DOI - PubMed
    1. Al-Bassam J, Kim H, Brouhard G, van Oijen A, Harrison SC, Chang F. CLASP promotes microtubule rescue by recruiting tubulin dimers to the microtubule. Developmental Cell. 2010;19:245–258. doi: 10.1016/j.devcel.2010.07.016. - DOI - PMC - PubMed

Publication types