. 2022 Jun 24;73(12):4129-4146.
doi: 10.1093/jxb/erac112.

MtGSTF7, a TT19-like GST gene, is essential for accumulation of anthocyanins, but not proanthocyanins in Medicago truncatula

Affiliations

MtGSTF7, a TT19-like GST gene, is essential for accumulation of anthocyanins, but not proanthocyanins in Medicago truncatula

Ruoruo Wang et al. J Exp Bot. .

Abstract

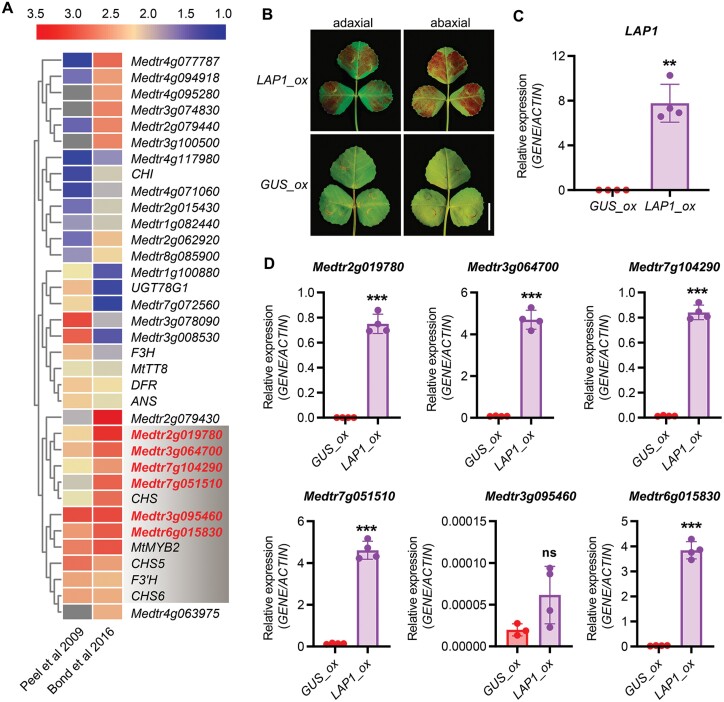
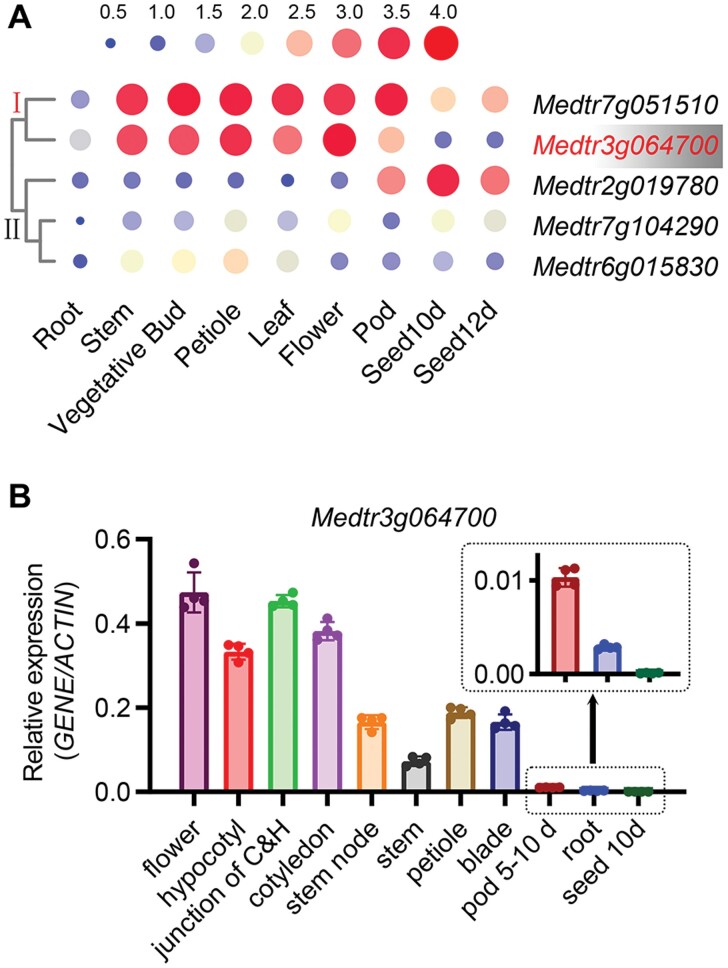
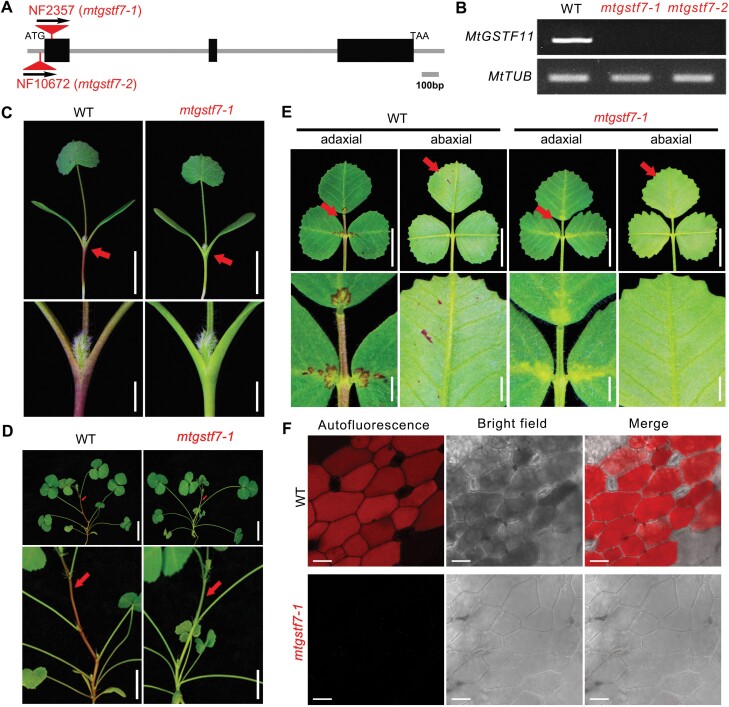
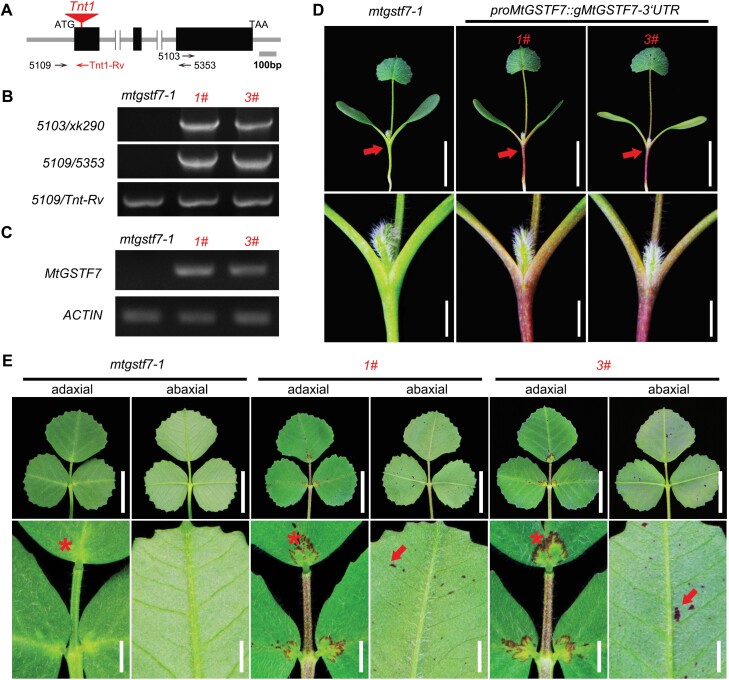
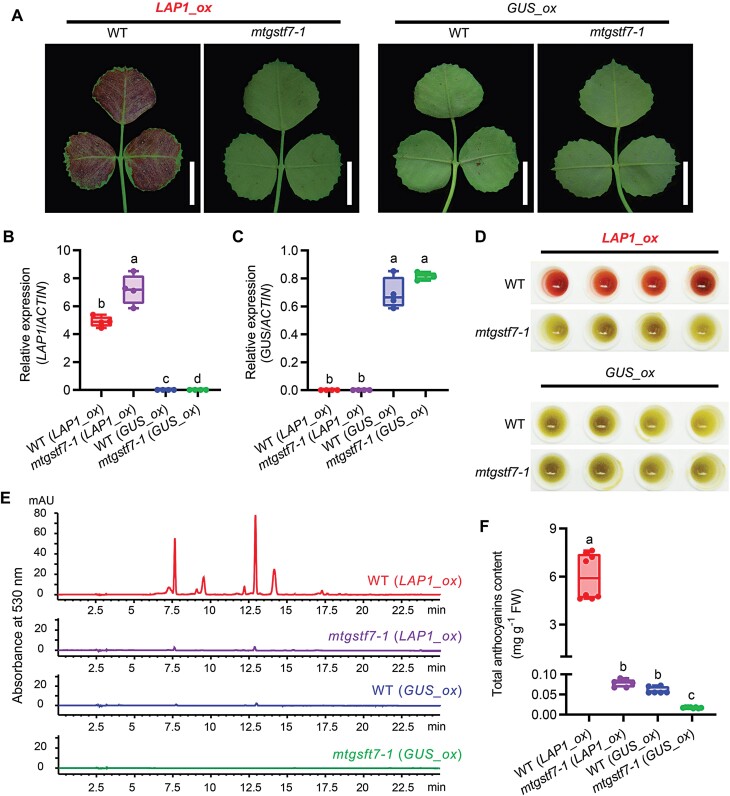
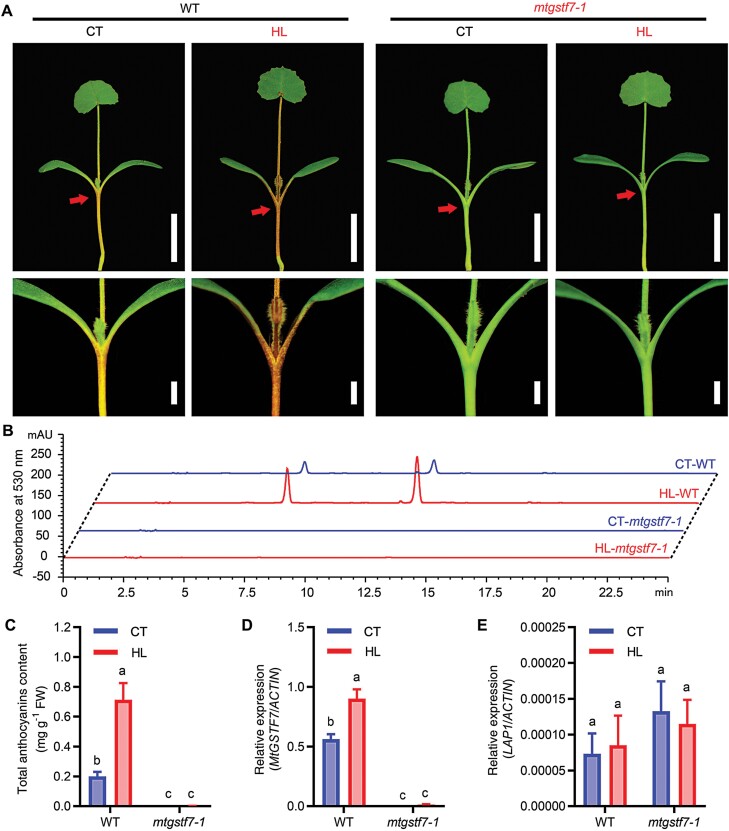
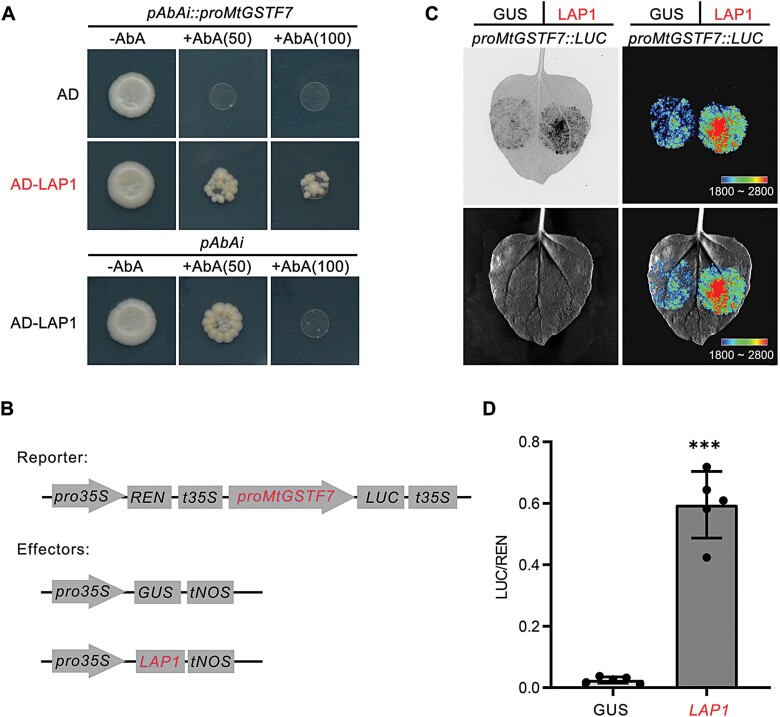
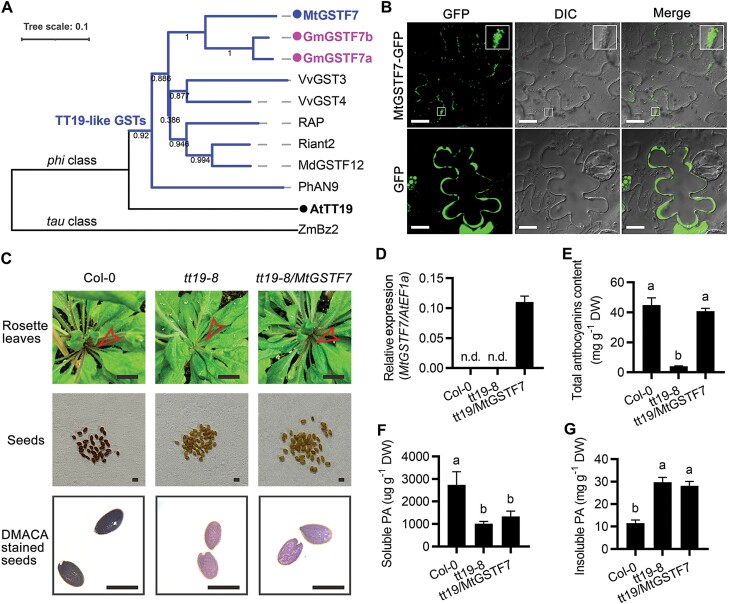
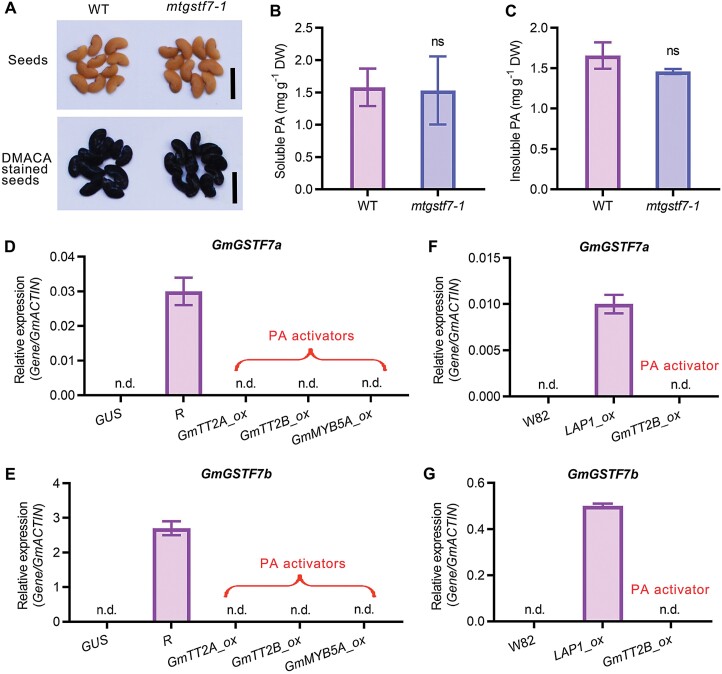
Anthocyanins and proanthocyanins (PAs) are two end products of the flavonoid biosynthesis pathway. They are believed to be synthesized in the endoplasmic reticulum and then sequestered into the vacuole. In Arabidopsis thaliana, TRANSPARENT TESTA 19 (TT19) is necessary for both anthocyanin and PA accumulation. Here, we found that MtGSTF7, a homolog of AtTT19, is essential for anthocyanin accumulation but not required for PA accumulation in Medicago truncatula. MtGSTF7 was induced by the anthocyanin regulator LEGUME ANTHOCYANIN PRODUCTION 1 (LAP1), and its tissue expression pattern correlated with anthocyanin deposition in M. truncatula. Tnt1-insertional mutants of MtGSTF7 lost anthocyanin accumulation in vegetative organs, and introducing a genomic fragment of MtGSTF7 could complement the mutant phenotypes. Additionally, the accumulation of anthocyanins induced by LAP1 was significantly reduced in mtgstf7 mutants. Yeast-one-hybridization and dual-luciferase reporter assays revealed that LAP1 could bind to the MtGSTF7 promoter to activate its expression. Ectopic expression of MtGSTF7 in tt19 mutants could rescue their anthocyanin deficiency, but not their PA defect. Furthermore, PA accumulation was not affected in the mtgstf7 mutants. Taken together, our results show that the mechanism of anthocyanin and PA accumulation in M. truncatula is different from that in A. thaliana, and provide a new target gene for engineering anthocyanins in plants.

Keywords: Medicago truncatula; Anthocyanin; LAP1; MtGSTF7; glutathione-S-transferase; proanthocyanidin.


Figures

Fig. 1.
Fig. 1.
Five common genes are highly induced in LAP1 overexpressing leaves. (A) The clustered heatmap based on the fold change values of 35 common DEGs. Genes in the grey-shaded region were highly induced (log2FC≧3) by overexpressing LAP1. (B) The adaxial and abaxial sides of ecotype R108 WT leaves transiently overexpressing LAP1 (LAP1_ox) and GUS (GUS_ox). The GUS gene was used as a negative control (GUS_ox). The experiment was conducted with three independent repeats with similar results. (C) The relative transcript levels of LAP1 in LAP1_ox and GUS_ox leaves determined by qRT–PCR (**P<0.01, two-tailed Welch’s t-test). The data are mean values ±SD (n=4). Similar results were acquired with two independent biological replicates. (D) The relative transcript levels of genes marked by red letters in the grey-shaded region in (A) verified by qRT–PCR (***P<0.001; ns, P>0.05; two-tailed Welch’s t-test).
Fig. 2.
Fig. 2.
The Medtr3g064700 gene is expressed in anthocyanin accumulating organs. (A) The gene expression atlas of Medtr3g064700, Medtr7g051510, Medtr7g104290, Medtr2g019780, and Medtr6g015830 in different organs of M. truncatula. The normalized expression values were log10 base transformed. The scale is shown at the top. Different sizes and colours in the scale indicate the expression amount. ‘Ⅰ’ and ‘Ⅱ’ show the two different sub-groups clustered by the tissue expression pattern of genes. Genes in cluster ‘Ⅰ’ showed a higher expression in anthocyanin accumulation tissues. (B) The tissue expression pattern of Medtr3g064700 determined by qRT–PCR. Junction of C&H, the junction region of cotyledons and hypocotyl. Two independent biological replicates showed similar results.
Fig. 3.
Fig. 3.
Defective anthocyanin accumulation in the mtgstf7-1 mutant. (A) Diagram showing the gene structure of MtGSTF7 and the Tnt1 insertions in mutant alleles. Blank boxes indicate exons and lines between them represent introns. Vertices of red triangles denote Tnt1 insertion sites. Arrows indicate the orientations of Tnt1 insertions. (B) Transcript abundance of MtGSTF7 in WT and two mtgstf7 mutants determined by RT–PCR. The transcript abundance of MtTUB was used as the internal control. (C) Phenotypes of the WT and mtgstf7-1 seedlings. Red arrows indicate the junctions between cotyledon and hypocotyl. Magnified images of junctions are shown in the lower panel. Scale bars: upper, 1 cm; lower, 2 mm. (D) Phenotype of 45-day-old plants of WT and mtgstf7-1 mutant. Arrows indicate the red and green stems in WT and mtgstf7-1 mutant, respectively. The magnified images are shown in the lower panel. Scale bars: upper, 1 cm; lower, 5 mm. (E) Phenotypes of WT and mtgstf7-1 leaves. Images in the upper panel show the adaxial and the abaxial sides of leaves. Red arrows indicate the spots accumulating anthocyanins in the leaflets, and the magnified images are shown in the lower panel. Scale bars: upper, 1 cm; lower, 2 mm. (F) Anthocyanin autofluorescence captured from the adaxial side of WT and mtgstf7-1 mutant leaflets. Scale bars: 25 µm.
Fig. 4.
Fig. 4.
The anthocyanin deficiency of mtgstf7-1 can be completely rescued by MtGSTF7. (A) Diagram showing the MtGSTF7 gene structure and the locations of primers used for genotyping. Arrows indicate the orientations of primers. (B) The genotyping of independent rescued lines. Primer xk290 is a specific reverse primer located in the ProMtGSTF7::gMtGSTF7-3’UTR construct. The locations of other primers are shown in (A). (C) Transcript abundance of MtGSTF7 in mtgstf7-1 and two rescued lines determined by RT–PCR. MtACTIN was used as an internal control. (D) Phenotypes of mtgstf7-1 and two representative independent rescued lines. Red arrows indicate the junctions between cotyledon and hypocotyl, and magnified images are shown in the lower panel. Scale bars: upper, 1 cm; lower, 2 mm. (E) Leaf phenotypes of mtgstf7-1 and two independent rescued lines. Images in the upper panel show the adaxial and the abaxial sides of leaves. Images in the lower panel show the magnification of the adaxial side of the leaflet basal region and the abaxial side of the terminal leaflets. Asterisks indicate that the disappearance of anthocyanin deposition on the adaxial side of the leaflets was complemented by introducing the MtGSTF7 genomic sequence into the mtgstf7-1 mutant. Red arrows indicate the scattered spots on the abaxial side of terminal leaflets of rescued lines. Scale bars: upper, 1 cm; below, 2 mm.
Fig. 5.
Fig. 5.
LAP1-induced anthocyanin accumulation depends on MtGSTF7 in M. truncatula. (A) The abaxial sides of WT and mtgstf7-1 leaves that transiently overexpress LAP1 (LAP1_ox). The transient overexpression of GUS (GUS_ox) was used as the negative control. Scale bars: 1 cm. (B) Relative transcript levels of LAP1 in leaves that transiently overexpress LAP1 or GUS. (C) Relative transcript levels of GUS in leaves that transiently overexpress LAP1 or GUS. (D) The pigments extracted from leaves which transiently overexpress LAP1 or GUS. Red colours in the extracts are the results of anthocyanin accumulation and the yellowish-green colours are the chlorophyll. Four independent leaves from different plants were extracted for each experimental group. (E) Reverse-phase HPLC chromatograms of anthocyanins extracted from WT and mtgstf7-1 leaves that transiently overexpress LAP1 and GUS. (F) The total anthocyanin contents of WT and mtgstf7-1 leaves that transiently overexpress LAP1 and GUS. The anthocyanin content was calculated as cyanidin chloride equivalents. FW, fresh weight. The data are mean values ±SD (n=4). Gene transcript levels in (B) and (C) were determined by qRT–PCR. MtACTIN was used as the internal control. The data are mean values ±SD (n=4). Different letters in (B), (C) and (F) donate significant differences (P<0.05; two-way ANOVA tests).
Fig. 6.
Fig. 6.
The light-induced accumulation of anthocyanins relies on MtGSTF7. (A) Phenotypes of WT and mtgstf7-1 seedlings in high light conditions. CT, control intensity of lights; HL, high intensity of lights. Red arrows indicate the junctions between cotyledon and hypocotyl (upper panel), and the magnified images are shown in the lower panel. Scale bars: upper, 1 cm; lower, 2 mm. (B) Reverse-phase HPLC chromatograms of anthocyanins extracted from WT and mtgstf7-1 seedlings exposed to different intensity lights. (C) The quantification of anthocyanin contents in WT and mtgstf7-1 seedlings treated under control (CT) and high intensity (HL) light. (D) The relative transcript level of MtGSTF7 in WT and mtgstf7-1 under control (CT) and high intensity (HL) of light. (E) The relative transcript levels of LAP1 in WT and mtgstf7-1 under control (CT) and high intensity (HL) of light. Transcript levels were normalized against MtACTIN. Two independent experiments showed similar results. Different letters denote significant differences between each other (P<0.01, two-way ANOVA tests).
Fig. 7.
Fig. 7.
LAP1 can bind to the MtGSTF7 promoter to activate its expression. (A) Yeast-one-hybrid assay showing the interaction of LAP1 and MtGSTF7 promoter. AD represents the empty pGADT7.1 vector. Numbers in brackets indicate the concentration of Aureobasidin A (AbA), ng ml-1. (B) Schematic diagrams showing the reporter and effector constructs used for promoter-luciferase reporter assays. The effector of GUS was used as the negative control. (C) The promoter-luciferase assays showing activation of the MtGSTF7 promoter by LAP1. The upper left image shows the original chemiluminescence picture after 150 s of exposure. The upper right image shows the chemiluminescence image embellished with pseudo-colours. The lower left image shows the monochrome picture of the infiltrated tobacco leaf. The lower right image shows the merged image of the infiltrated tobacco leaf and pseudo-colour picture. Similar results were obtained with five independent biological replicates. (D) The quantitative result of dual-luciferase assays. Ratio of LUC and REN represents the activation efficiency of effectors (GUS and LAP1) when co-transformed with the same reporter. (***P<0.001, unpaired two-tailed Welch’s t-test). The data are mean values ±SD from five independent biological replicates. Four technical replicates were performed for each biological replicate.
Fig. 8.
Fig. 8.
MtGSTF7 is not involved in PA accumulation in A. thaliana. (A) Phylogenetic tree of MtGSTF7 proteins and other anthocyanin accumulation related-GSTs. MtGSTF7 is the homolog of AtTT19. Neighbor-Joining tree was constructed by the software MEGA 6.06 using the p-distance amino acid substitution model with 1000 bootstrap repetitions, and displayed using the online tool iTOL. The tree scale for branch lengths denotes genetic distance. Bootstrap values are labelled on the middle of the branch. Blue branches indicate TT19-like GSTs clade. (B) The sub-cellular localization of MtGSTF7 in N. bethamiania leaf epidermal cells (upper panels). The sub-cellular location of GFP protein was used as the positive control (lower panels). The MtGSTF7-GFP signal is discontinuous around the cell membrane and the magnified images of the signal in the square areas are presented at the top right corner. Scale bars= 25 µm. (C) Phenotypes of Col-0, tt19-8, and a representative rescued tt19-8/MtGSTF7 transgenic line. Hollow red arrow heads indicate the petiole of rosette leaves. Scale bars: upper=1 cm; central=0.5 mm; lower=0.5 mm. (D) Relative transcript levels of MtGSTF7 in Col-0, tt19-8, and the rescued transgenic line. The gene AtEF1a was used as an internal control. n.d., not detected. (E) The total anthocyanins content of Col-0, tt19-8, and the rescued transgenic line. The anthocyanin content was calculated as C3G (cyanidin-3-O-glucoside) equivalents. DW, dry weight. (F) The soluble PA content of Col-0, tt19-8, and the rescued transgenic line. The soluble PA content was calculated as epicatechin equivalents. (G) The insoluble PA content of Col-0, tt19-8, and the rescued transgenic line. The insoluble PA content was calculated as procyanidin B1 equivalents. Data in (D), (E), (F) and (G) are mean values ±SD (n=3). Different letters in (E), (F) and (G) donate statistically significant differences between each other (P<0.05, Student’s t-test).
Fig. 9.
Fig. 9.
MtGSTF7, and its homologs in soybean, are not responsible for PA accumulation. (A) Phenotype of seeds (upper panel) and DMACA staining of seeds (lower panel) of WT and mtgstf7-1. (B) The soluble PA content of WT and mtgstf7-1 seeds. Scale bars=0.5 cm. (C) The insoluble PA content of WT and mtgstf7-1 seeds. The soluble PA content was calculated as epicatechin equivalents. The insoluble PA content was calculated as procyanidin B1 equivalents. DW, dry weight. Data in (B) and (C) are mean values ±SD (n=4). ‘ns’ above columns denote no statistically significant difference between mtgstf7-1 and WT (P>0.05; unpaired two-tailed Welch’s t-test). (D, E) Relative transcript levels of GmGST7a and GmGSTF7b in G. max hairy roots overexpressing GUS, R, GmTT2A, GmTT2B, and GmMYB5A. Overexpression of GUS was used as the negative control. (F, G) Relative transcript levels of GmGSTF7a and GmGSTF7b in G. max (‘Williams 82’) and transgenic plants overexpressing LAP1 and GmTT2B. Gene transcript levels were determined by qRT–PCR. The GmACTIN gene was used as the internal control. Data are mean values ±SD (n=3). n.d., not detected. GmTT2A, GmTT2B, GmMYB5A are PA activators that induce PA accumulation.

Similar articles

Cited by

References

    1. Albert NW, Lewis DH, Zhang H, Schwinn KE, Jameson PE, Davies KM.. 2011. Members of an R2R3-MYB transcription factor family in Petunia are developmentally and environmentally regulated to control complex floral and vegetative pigmentation patterning. The Plant Journal 65, 771–784. - PubMed
    1. Benedito VA, Torres-Jerez I, Murray JD, Andriankaja A, Allen S, Kakar K, Wandrey M, Verdier J, Zuber H, Ott T, et al. . 2008. A gene expression atlas of the model legume Medicago truncatula. The Plant Journal 55, 504–513. - PubMed
    1. Bond DM, Albert NW, Lee RH, Gillard GB, Brown CM, Hellens RP, Macknight RC.. 2016. Infiltration-RNAseq: transcriptome profiling of Agrobacterium-mediated infiltration of transcription factors to discover gene function and expression networks in plants. Plant Methods 12, 41. - PMC - PubMed
    1. Borevitz JO, Xia Y, Blount J, Dixon RA, Lamb C.. 2000. Activation tagging identifies a conserved MYB regulator of phenylpropanoid biosynthesis. The Plant Cell 12, 2383–2394. - PMC - PubMed
    1. Braidot E, Petrussa E, Bertolini A, Peresson C, Ermacora P, Loi N, Terdoslavich M, Passamonti S, Macrì F, Vianello A.. 2008a. Evidence for a putative flavonoid translocator similar to mammalian bilitranslocase in grape berries (Vitis vinifera L.) during ripening. Planta 228, 203–213. - PubMed

Publication types

MeSH terms