. 2022 Mar 18;8(11):eabk3327.
doi: 10.1126/sciadv.abk3327. Epub 2022 Mar 16.

Extracellular matrix proteins regulate NK cell function in peripheral tissues

Affiliations

Extracellular matrix proteins regulate NK cell function in peripheral tissues

Mark D Bunting et al. Sci Adv. .

Abstract

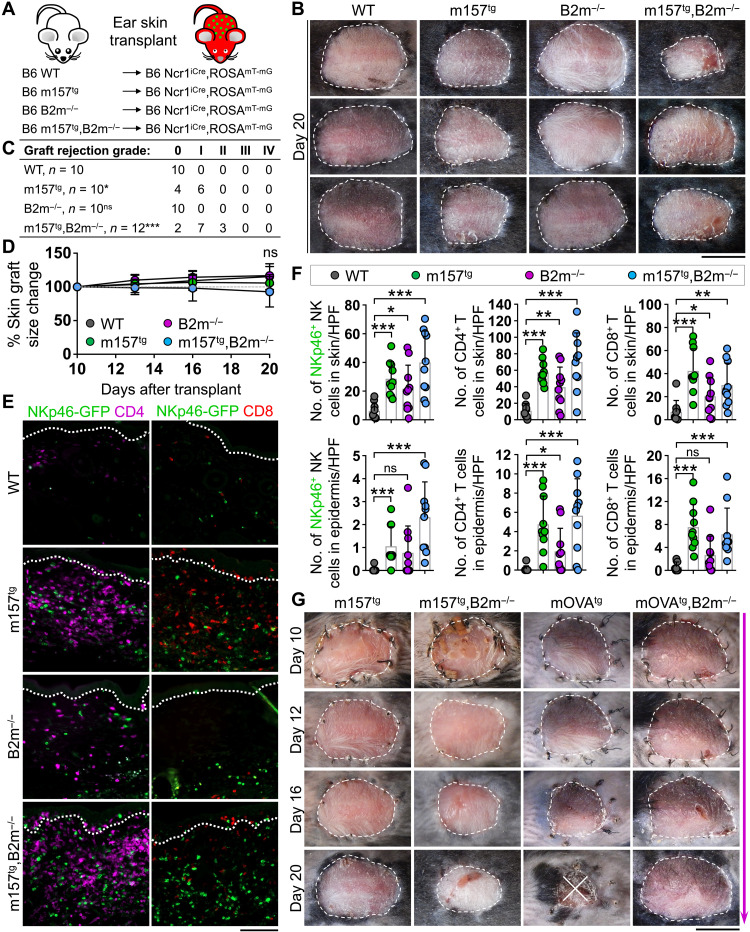
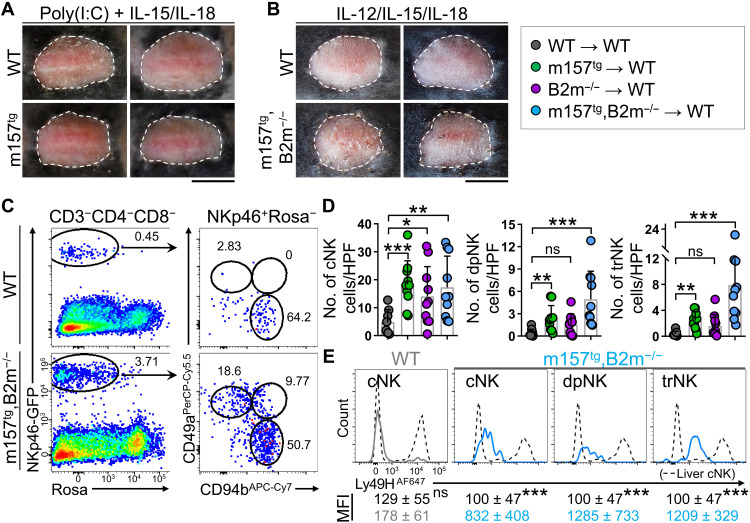
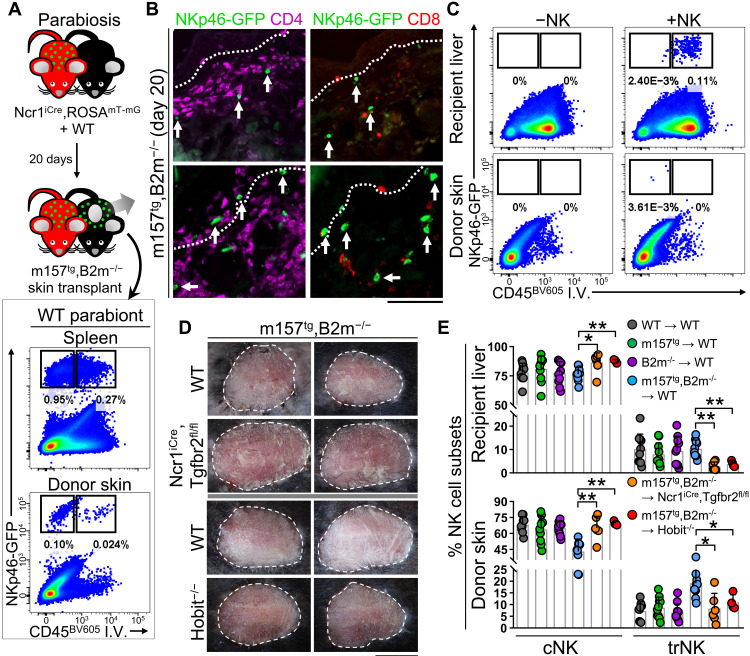
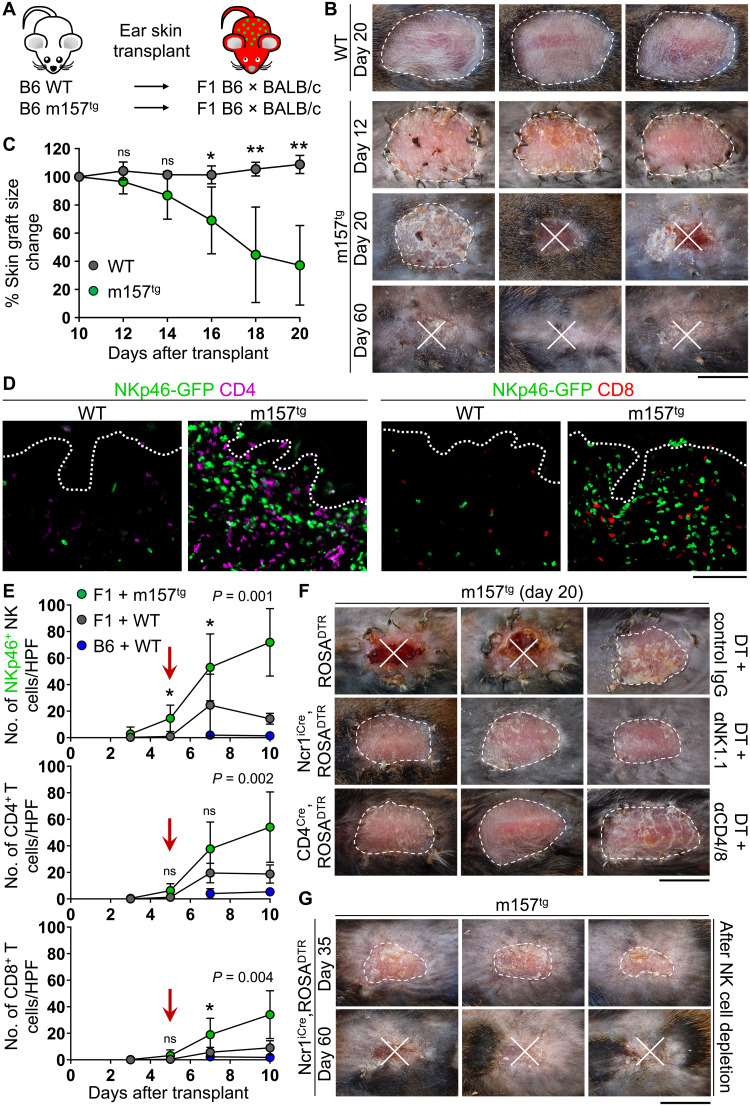
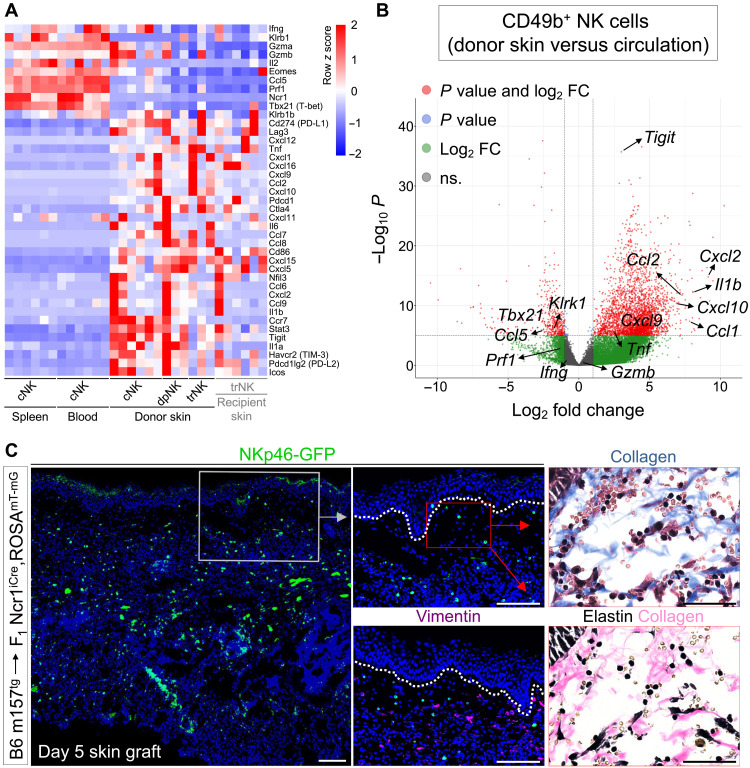
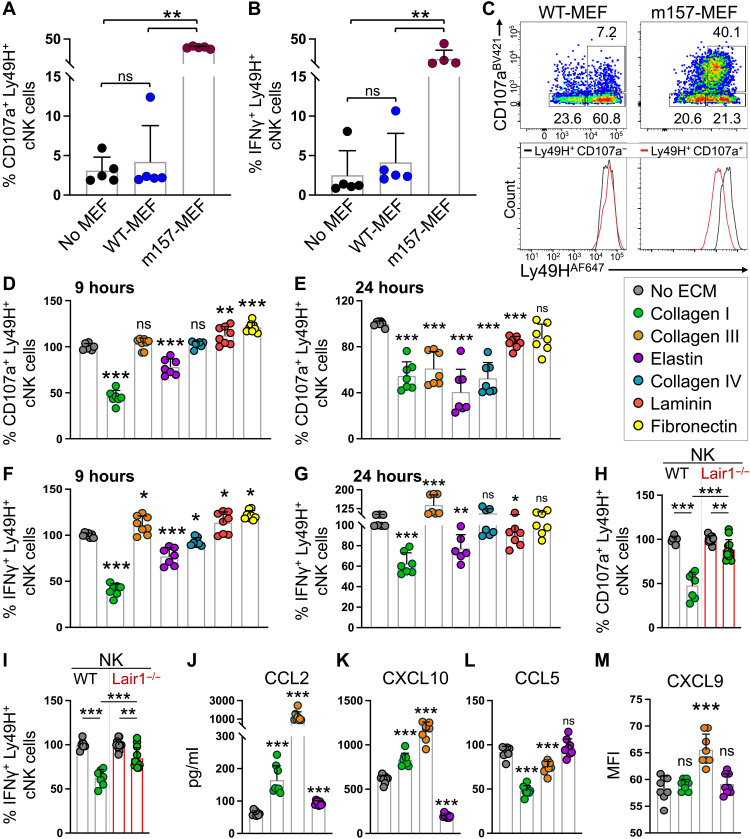
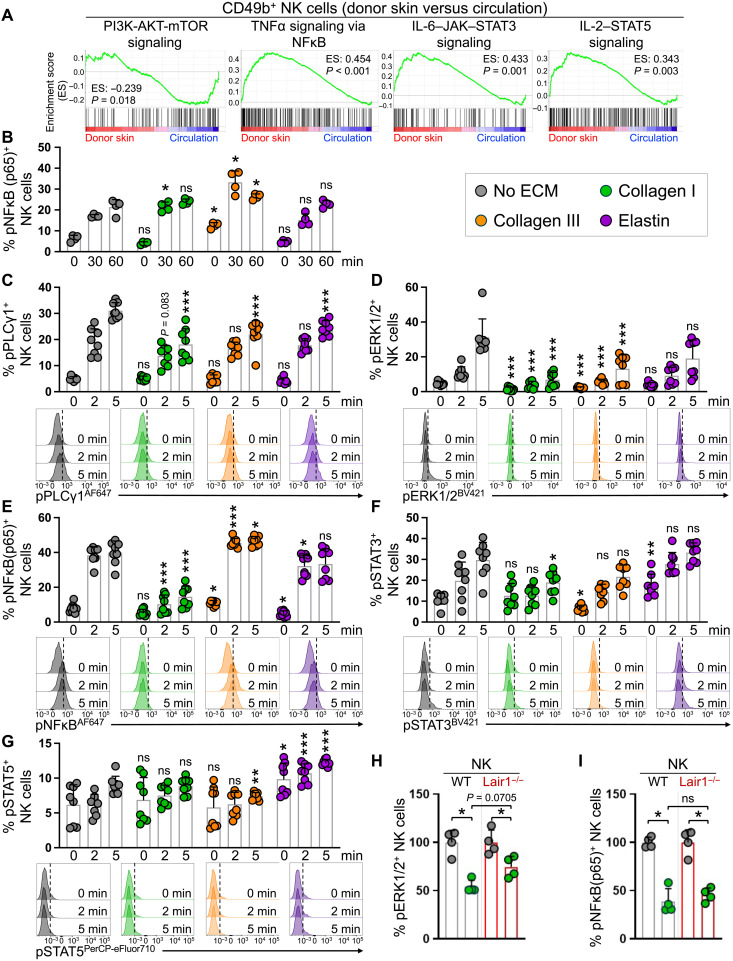
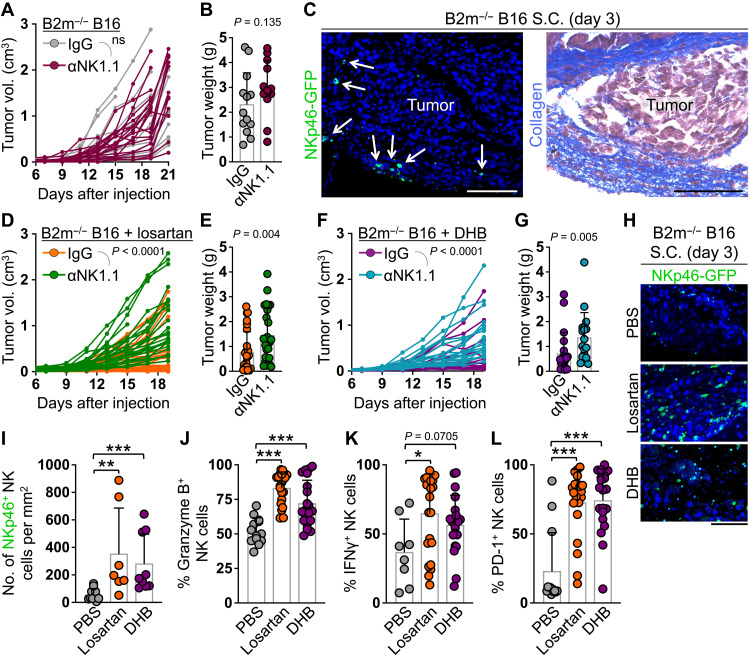
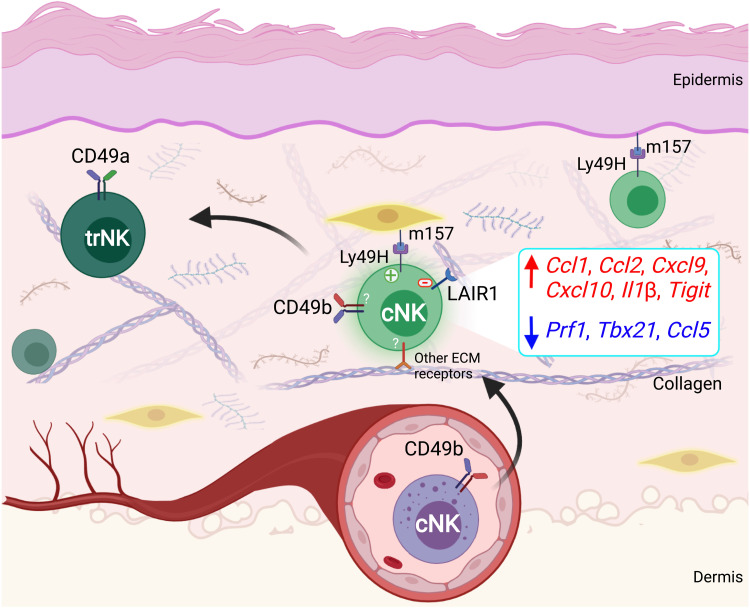
Natural killer (NK) cells reject major histocompatibility complex class I (MHC-I)-deficient bone marrow through direct cytotoxicity but not solid organ transplants devoid of MHC-I. Here, we demonstrate an immediate switch in NK cell function upon exit from the circulation, characterized by a shift from direct cytotoxicity to chemokine/cytokine production. In the skin transplant paradigm, combining an NK cell-specific activating ligand, m157, with missing self MHC-I resulted in complete graft rejection, which was dependent on NK cells as potential helpers and T cells as effectors. Extracellular matrix proteins, collagen I, collagen III, and elastin, blocked NK cell cytotoxicity and promoted their chemokine/cytokine production. NK cell cytotoxicity against MHC-I-deficient melanoma in the skin was markedly increased by blocking tumor collagen deposition. MHC-I down-regulation occurred in solid human cancers but not leukemias, which could be directly targeted by circulating cytotoxic NK cells. Our findings uncover a fundamental mechanism that restricts direct NK cell cytotoxicity in peripheral tissues.


Figures

Fig. 1.
Fig. 1.. Presence of NK cell–activating m157 ligand and loss of inhibitory B2m are insufficient to induce skin graft rejection in syngeneic recipients.
(A) Schematic diagram of ear skin transplantation from B6 albino WT, B2m−/−, m157tg, and m157tg,B2m−/− donor mice to B6 Ncr1iCre,ROSAmT-mG recipients. (B) Representative images of skin grafts at day 20 after transplant. (C) Quantification of graft rejection grades assessed at day 20 after transplant of B6 albino WT, B2m−/−, m157tg, and m157tg,B2m−/− skin grafts transplanted onto B6 Ncr1iCre,ROSAmT-mG recipients. (D) The percentage change in skin graft size from day 10 to day 20 after transplant. (E) Representative IF images of NKp46-GFP+ (green), CD4+ (purple), and CD8+ (red) cells in skin grafts at day 20 after transplant. Dotted lines indicate the epidermal basement membrane. (F) Quantification of NKp46-GFP+ NK, CD4+ T, and CD8+ T cells in the skin and epidermis of skin grafts at day 20 after transplant. (B to F) n = 9 to 12 mice per group from nine independent experiments. HPF, high-power field. (G) Time course of skin graft maintenance from day 10 to day 20 after transplant comparing m157tg, m157tg,B2m−/−, mOVAtg, and mOVAtg,B2m−/− skin grafts. m157tg and m157tg,B2m−/− images from the same experiment as (B). mOVAtg and mOVAtg,B2m−/−, n = 2 to 5 from one to two independent experiments. (C) Fisher’s exact test. ns, not significant; *P < 0.05 and ***P < 0.001 compared with WT group. (D and F) Graphs show means ± SD. Mann-Whitney U test; *P < 0.05, **P < 0.01, and ***P < 0.001. (B and G) Scale bars, 1 cm. (E) Scale bar, 100 μm. Photo Credit: Mark D. Bunting, Massachusetts General Hospital.
Fig. 2.
Fig. 2.. NK cells fail to induce skin graft rejection upon cytokine stimulation.
(A and B) Representative images of WT or m157tg skin grafts treated with poly(I:C)/IL-15/IL-18 (A) and m157tg,B2m−/− skin grafts treated with IL-12/IL-15/IL-18 (B) on WT B6 recipients at day 21 after transplant. n = 2 to 5 mice per group from one to three independent experiments. (C) Representative flow cytometry dot plots of NK cells gated as NKp46-GFP+ROSA-TdTomato (ROSA)CD3CD4CD8 in WT and m157tg,B2m−/− skin grafts. cNK, dpNK, and trNK were distinguished on the basis of CD49a and CD49b expression. Numbers on the dot plots represent the percent cells within each gate. APC, allophycocyanin; PerCP, peridinin chlorophyll protein. (D) Enumeration of cNK, dpNK, and trNK populations in the skin by combining flow cytometry frequency data with NKp46-GFP+ cell counts from Fig. 1. n = 9 to 10 mice per group from nine independent experiments. (E) Ly49H expression by cNK, dpNK, and trNK cells from m157tg,B2m−/− and cNK cells from WT skin grafts at day 20 after transplant compared with cNK cells from the liver. Note that WT skin grafts contain Ly49H+ and Ly49H cNK cells, while all NK subsets in m157tg,B2m−/− skin grafts express low levels of Ly49H. Average ± SD of mean fluorescence intensity (MFI) of Ly49H on NK cell subsets in m157tg,B2m−/− skin grafts, and Ly49H cNK cells in WT skin grafts at day 20 after transplant are compared with Ly49H cNK cells in the liver of the recipient mice. n = 4 to 10 mice per group from three independent experiments. (D and E) Graphs are shown as means ± SD. Mann-Whitney U test; *P < 0.05, **P < 0.01, and ***P < 0.001. (A and B) Scale bars, 1 cm. Photo Credit: Mark D. Bunting, Massachusetts General Hospital.
Fig. 3.
Fig. 3.. Circulating cNK cells enter the skin grafts and give rise to trNK cells.
(A) Schematic of parabiosis between WT and Ncr1iCre,ROSAmT-mG B6 mice followed by m157tg,B2m−/− skin transplantation onto the WT parabiont. Representative dot plots of the spleen and donor skin from the WT parabiont gating on CD3CD4CD8 cells and showing CD45 intravenously (I.V.) and NKp46-GFP at day 20 after skin transplant. (B) Representative IF images of m157tg,B2m−/− skin graft from the WT parabiont showing the presence of NKp46-GFP+ (green, white arrows), CD4+ (purple), and CD8+ (red) cells. Dotted lines indicate the epidermal basement membrane. n = 5 parabiosis pairs. (C) Sorted splenic cNK cells from Ncr1iCre,ROSAmT-mG mice were adoptively transferred into WT mice 1 day after skin transplantation with m157tg,B2m−/− skin grafts. Representative dot plots of transferred NK cells (defined as CD3CD4CD8NKp46-GFP+) in liver and skin grafts of mice that did not (left) and did (right) receive NKp46-GFP+ NK cells. n = 2 mice per +NK group from two independent experiments. (D) Representative images of m157tg,B2m−/− skin grafts transplanted onto WT, Ncr1iCre,Tgfbr2fl/fl, and Hobit−/− recipient mice at day 20 after transplant. n = 4 to 7 mice per group. (E) Frequencies of cNK and trNK cells in the recipient liver (top) and donor skin (bottom) at day 20 after transplant. Ncr1iCre,ROSAmT-mG mice transplanted with B6 albino WT, m157tg, B2m−/−, and m157tg,B2m−/− donor skin from Fig. 1 (n = 9 to 10 mice per group) and Ncr1iCre,Tgfbr2fl/fl and Hobit−/− recipients transplanted with m157tg,B2m−/− donor skin at day 20 after transplant (n = 4 to 7 mice per group). (E) Graphs are shown as means ± SD. Mann-Whitney U test; *P < 0.05 and **P < 0.01. (B) Scale bar, 100 μm. (D) Scale bar, 1 cm. Photo Credit: Mark D. Bunting, Massachusetts General Hospital.
Fig. 4.
Fig. 4.. Presence of activating m157 and loss of self-MHC induces robust skin graft rejection in allogeneic recipients.
(A) Schematic of ear skin transplant from B6 albino WT and m157tg donor mice to F1 B6 × BALB/c Ncr1iCre,ROSAmT-mG recipients. (B) Representative images of skin grafts at days 12, 20, and 60 after transplant. (C) The percentage change in skin graft size from day 10 to day 20 after transplant. n = 4 to 8 mice per group from two independent experiments. (D) Representative IF images of NKp46-GFP+ (green), CD4+ (purple), and CD8+ (red) cells in skin grafts at day 10 after transplant. Dotted lines indicate the epidermal basement membrane. (E) Quantification of NKp46-GFP+ NK, CD4+ T, and CD8+ T cells in the skin grafts at days 3, 5, 7, and 10 after transplant. Red arrows highlight NK cells infiltrating the skin before T cells. n = 3 to 9 mice per group from one to three independent experiments. (F) Comparison of m157tg skin graft rejection in control (ROSADTR + DT/control IgG), NK cell–depleted [Ncr1iCre,ROSADTR + DT/anti-NK1.1 (αNK1.1) antibody], and T cell–depleted [CD4Cre,ROSADTR + DT/anti-CD4/8 (αCD4/8) antibodies] F1 mice at day 20 after transplant. (G) Representative images of m157tg skin graft rejection in NK cell–depleted mice at days 35 and 60 after transplant following cessation of NK cell depletion at day 17 after transplant. (B, D, F, and G) n = 4 to 8 mice per group from two independent experiments. (C and E) Graphs show means ± SD, Mann-Whitney U test; *P < 0.05 and ***P < 0.001. (B, F, and G) Scale bars, 1 cm. (D) Scale bar, 100 μm. Photo Credit: Mark D. Bunting and Marta Requesens, Massachusetts General Hospital.
Fig. 5.
Fig. 5.. cNK cells’ transcriptome changes markedly as they emigrate from the circulation into ECM-rich skin grafts.
(A) Comparison of up- and down-regulated genes in circulating cNK cells, m157-expressing donor skin–derived cNK, dpNK, and trNK cells from donor and recipient skin as determined by RNA-seq analysis of sorted NK cell subpopulations. n = 6 mice for spleen, blood, cNK cell in donor skin, and trNK cells in recipient skin; n = 3 mice for donor dpNK and trNK cells in donor skin. Note that three F1 recipients with m157tg skin graft and three B6 recipients with m157tg,B2m−/− skin graft were included. NK cell sorting strategy is shown in fig. S6A. (B) Gene expression changes in donor skin–derived cNK cells compared with circulating cNK cells in the spleen and blood. FC, fold change. (C) Representative images of NKp46-GFP+ NK cells, vimentin+ fibroblasts, and collagen/elastin-stained adjacent sections of m157tg skin graft at day 5 after transplant onto F1 recipient mice. 4′,6-Diamidino-2-phenylindole (blue) marks the cell nuclei. n = 7 from two independent experiments. Dotted lines indicate the epidermal basement membrane. Scale bars, 100 μm; insets, 50 μm.
Fig. 6.
Fig. 6.. Dermal ECM proteins modulate cNK cell effector function in vitro.
(A and B) Quantification of CD107a (A) and IFNγ (B) by Ly49H+ splenic cNK cells after 7 hours coculture with no MEFs, WT-MEFs, or m157-MEFs in the presence of IL-12 and IL-15. n = 5 per group. (C) Representative dot plots of CD107a by splenic cNK cells cocultured with WT-MEFs or m157-MEFs. Representative histograms of Ly49H expression by Ly49H+CD107a+ NK cells following coculture with m157-MEFs and WT-MEFs. Histograms of Ly49H+CD107a cNK cells (black) are shown as controls. Numbers on the dot plots represent the percent cells within each gate. (D to G) Quantification of CD107a (D and E) and IFNγ (F and G) expression by Ly49H+ splenic cNK cells cocultured with different ECM proteins and m157-MEFs at 9 hours (D and F) and 24 hours (E and G). Percentages are normalized on the basis of the “No ECM” group. n = 7 per group from two independent experiments. (H and I) Comparison of CD107a (H) and IFNγ (I) by Ly49H+ splenic cNK cells from WT and Lair1−/− mice in the presence of m157-MEFs and collagen I. Percentages are normalized on the basis of the no ECM group in WT (n = 7) and Lair1−/− (n = 12) experiments. (J to M) Measurement of CCL2 (J), CXCL10 (K), CCL5 (L), and CXCL9 (M) in the culture medium of splenic cNK cells cocultured with m157-MEFs in the presence of no ECM, collagen I and III, or elastin at 12 hours (CXCL10 and CCL5) and 24 hours (CCL2 and CXCL9). n = 8 per group from two independent experiments. (A, B, and D to M) Graphs show means ± SD. Mann-Whitney U test; *P < 0.05, **P < 0.01, and ***P < 0.001 compared with no ECM group.
Fig. 7.
Fig. 7.. Collagens and elastin modulate cytotoxicity and inflammation-associated signaling pathways in NK cells.
(A) Gene set enrichment analysis (GSEA) enrichment plots of PI3K-AKT-mTOR, TNFα-NFκB, IL-6–JAK–STAT3, and IL-2–STAT5 signaling in CD49b+ cNK cells in the donor skin compared with the circulation. The enrichment scores (ES) and P values are indicated in each plot. (B) Quantification of phospho-NFκB (pNFκB) (p65) in splenic cNK cells at 30 and 60 min after coculture with m157-MEFs in the presence of different ECM proteins. n = 4 per group, data representative of two independent experiments. (C to G) Quantification of phospho-PLCγ1+ (pPLCγ1+) (C), pERK1/2+ (D), pNFκB (p65) + (E), pSTAT3+ (F), and pSTAT5+ (G) in splenic cNK cells at 2 and 5 min after stimulation with H2O2 in the presence of different ECM proteins. n = 8 per group from two independent experiments. Representative flow cytometry histograms comparing the phosphorylation of key signaling proteins at 2 and 5 min after stimulation with H2O2 in response to no ECM (gray), collagen I (green), collagen III (orange), and elastin (purple). Black dotted line corresponds to the gating on the basis of the “no ECM – 0 min” histogram for each signaling protein. (H and I) Comparison of pERK1/2 (H) and pNFκB (p65) (I) in splenic NK cells from WT and Lair1−/− mice in response to 2-min H2O2 stimulation in the presence of collagen I. Percentages are normalized on the basis of the no ECM group in WT and Lair1−/− experiments. n = 4 per group; data are representative of two independent experiments. (B to I) Graphs show means ± SD. Mann-Whitney U test; *P < 0.05, **P < 0.01, and ***P < 0.001. (C to G) Each time point is compared with the corresponding time point in no ECM group.
Fig. 8.
Fig. 8.. Collagen deposition blocks NK cells from eliminating B2m-deficient melanoma cells in the skin.
(A and B) B2m−/− B16 melanoma subcutaneous growth over time (A) and terminal weight (B) in WT mice treated with control IgG [n = 17 for (A) and 13 for (B)] or anti-NK1.1 antibody [n = 19 for (A) and n = 13 for (B)]. (C) Representative images of NKp46-GFP+ NK cell (white arrows) IF and collagen stain in adjacent sections of a B2m−/− B16 melanoma at day 3 after subcutaneous (S.C.) injection in Ncr1iCre,ROSAmT-mG mice. (D to G) B2m−/− B16 melanoma subcutaneous growth over time (D and F) and terminal weight (E and G) in WT mice treated with losartan (D and E) or DHB (F and G) plus control IgG [n = 28 (D), 20 (F), 27 (E), and 20 (G)] or anti-NK1.1 antibody [n = 26 (D), 20 (F), 25 (E), and 18 (G)]. (H and I) Representative images (H) and quantification (I) of NKp46-GFP+ NK cells in B2m−/− B16 melanoma at day 3 after subcutaneous injection in PBS-treated (n = 10), losartan-treated (n = 7), and DHB-treated (n = 9) Ncr1iCre,ROSAmT-mG mice. (J to L) Quantification of granzyme B (J), IFNγ production (K), and PD-1 surface expression (L) on NK cells isolated from B2m−/− B16 melanoma at days 19 to 21 after subcutaneous injection in PBS-treated [n = 13 (J and L) and 8 (K)], losartan-treated [n = 21 (J) and 22 (K and L)], and DHB-treated [n = 20 (J, K, and L)] mice. (A, D, and F) Two-way analysis of variance (ANOVA). (B, E, G, and I to L) Graphs show means ± SD, Mann-Whitney U test. *P < 0.05, **P < 0.01, and ***P < 0.001. (C and H) Scale bars, 100 μm.
Fig. 9.
Fig. 9.. Schematic diagram of ECM protein–mediated switch in cNK cell effector function in the skin.
Created with BioRender.com

Similar articles

Cited by

References

    1. Garrido F., Aptsiauri N., Cancer immune escape: MHC expression in primary tumours versus metastases. Immunology 158, 255–266 (2019). - PMC - PubMed
    1. Bessoles S., Grandclement C., Alari-Pahissa E., Gehrig J., Jeevan-Raj B., Held W., Adaptations of natural killer cells to self-MHC class I. Front. Immunol. 5, 349 (2014). - PMC - PubMed
    1. Long E. O., Kim H. S., Liu D., Peterson M. E., Rajagopalan S., Controlling natural killer cell responses: Integration of signals for activation and inhibition. Annu. Rev. Immunol. 31, 227–258 (2013). - PMC - PubMed
    1. Karlhofer F. M., Ribaudo R. K., Yokoyama W. M., MHC class I alloantigen specificity of Ly-49+ IL-2-activated natural killer cells. Nature 358, 66–70 (1992). - PubMed
    1. Bennett M., Yu Y. Y., Stoneman E., Rembecki R. M., Mathew P. A., Lindahl K. F., Kumar V., Hybrid resistance: ‘Negative’ and ‘positive’ signaling of murine natural killer cells. Semin. Immunol. 7, 121–127 (1995). - PubMed

Publication types