. 2022 Mar 16;14(636):eabl9945.
doi: 10.1126/scitranslmed.abl9945. Epub 2022 Mar 16.

Treatment of a genetic brain disease by CNS-wide microglia replacement

Affiliations

Treatment of a genetic brain disease by CNS-wide microglia replacement

Yohei Shibuya et al. Sci Transl Med. .

Abstract

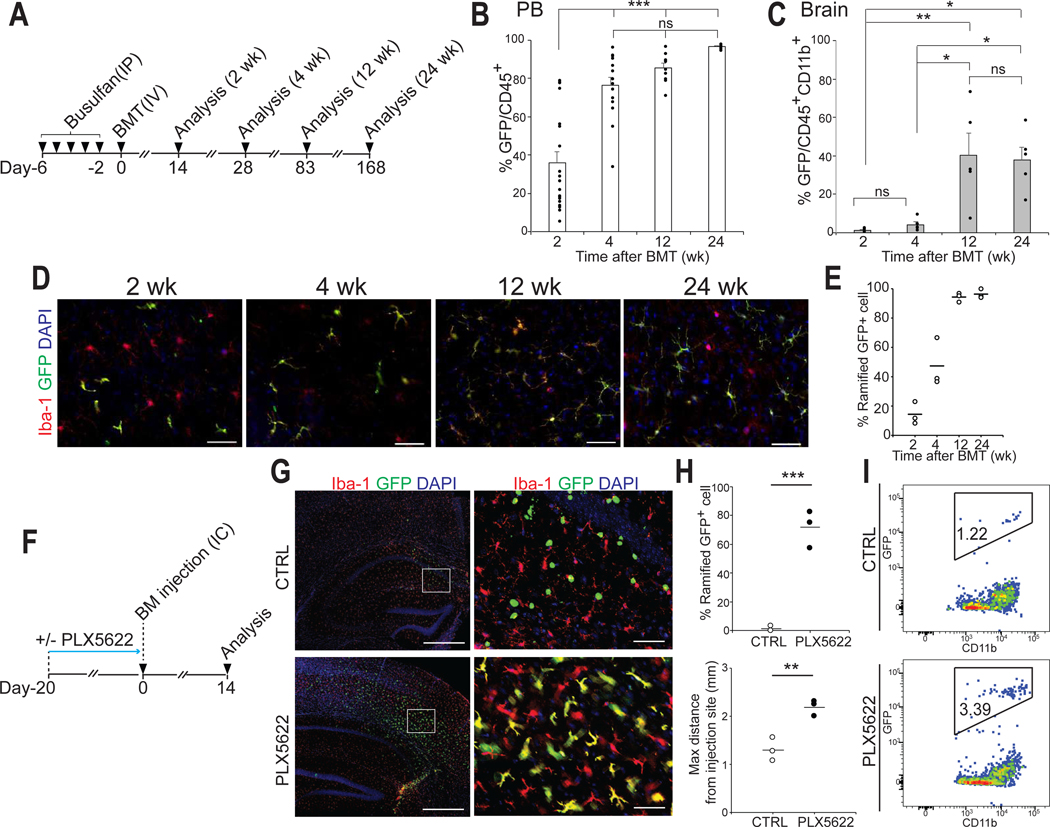
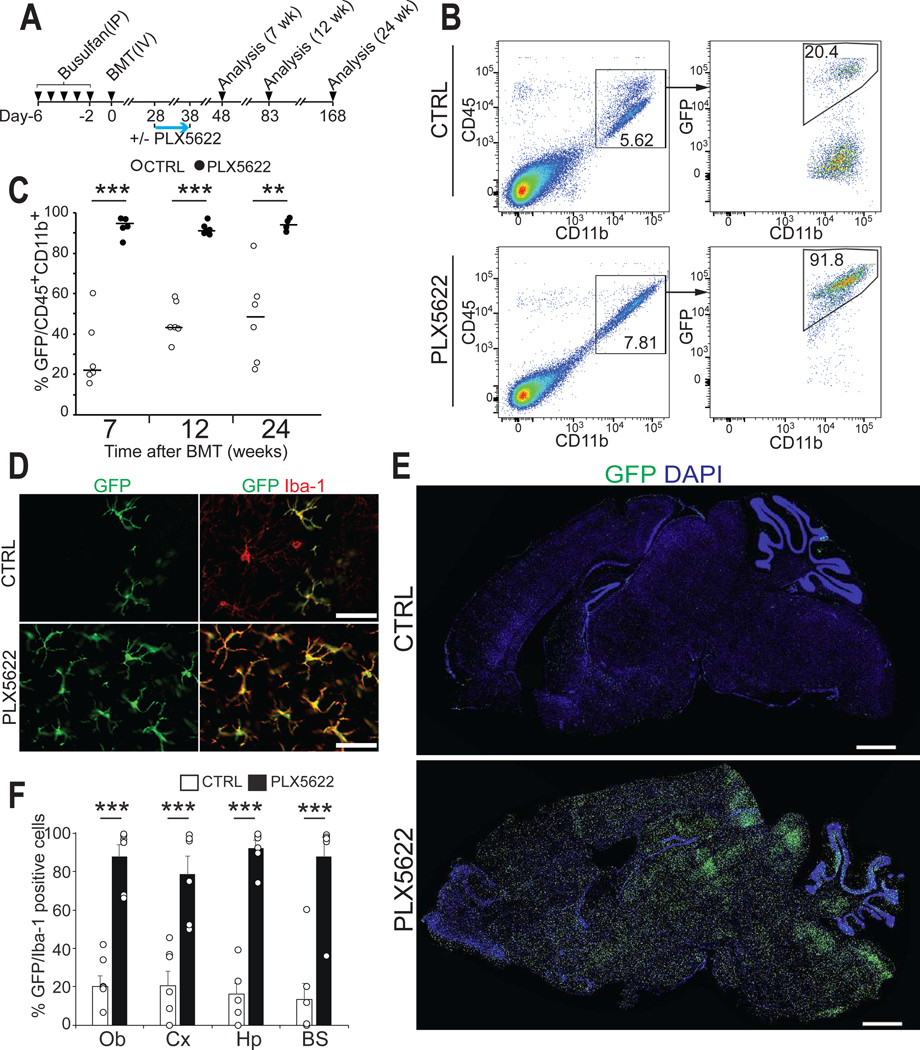
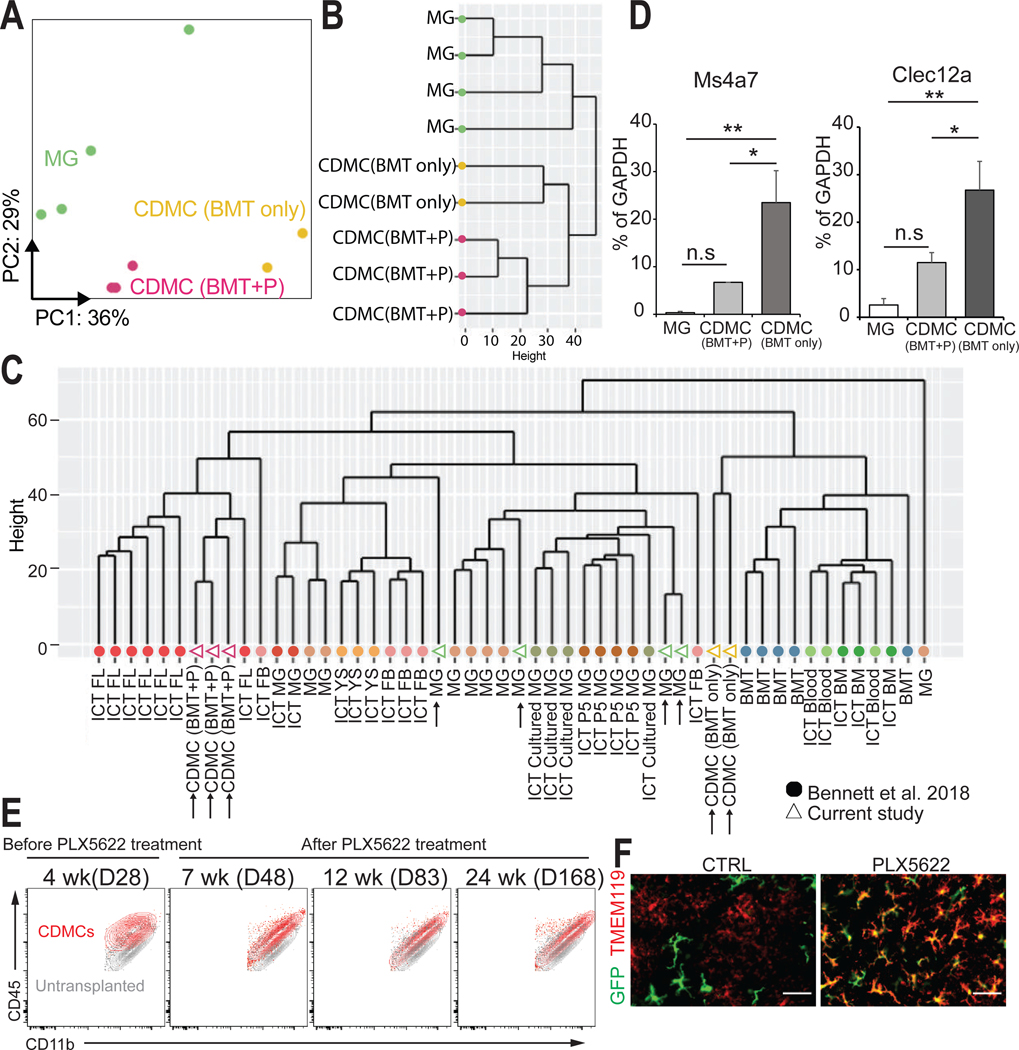
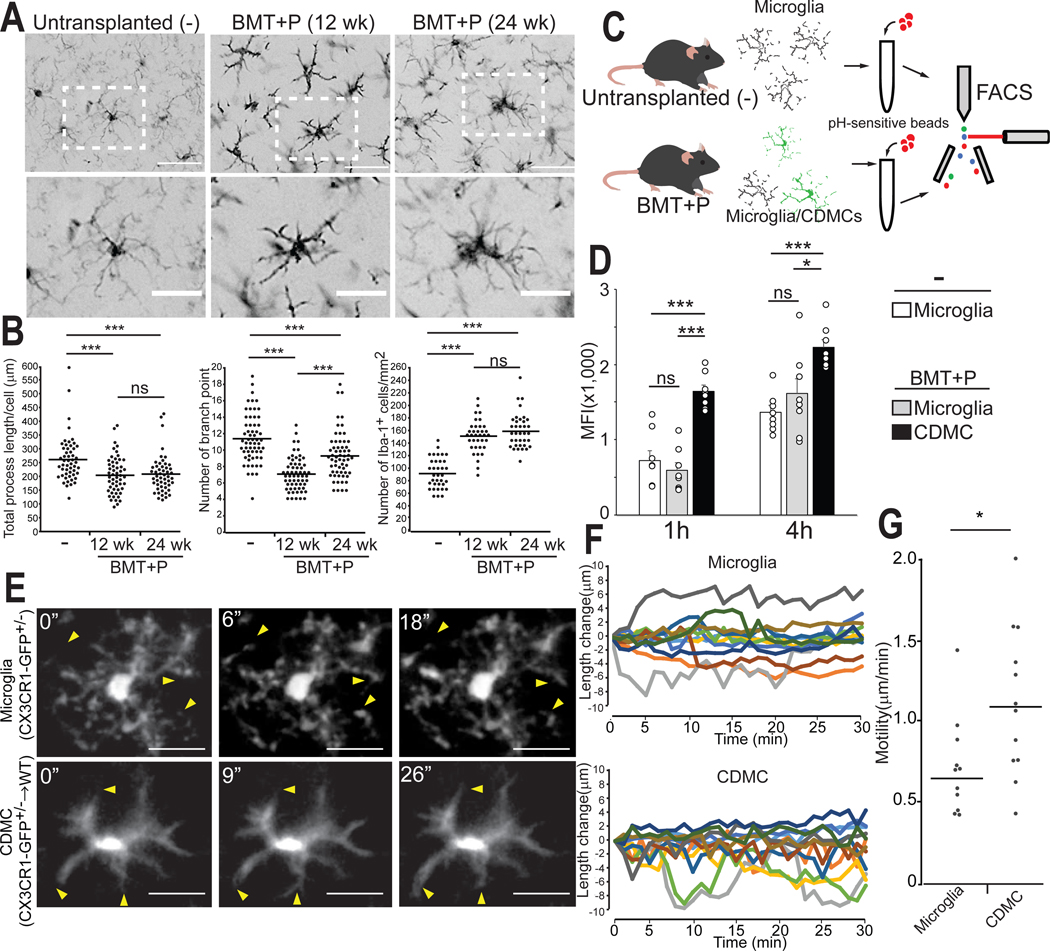
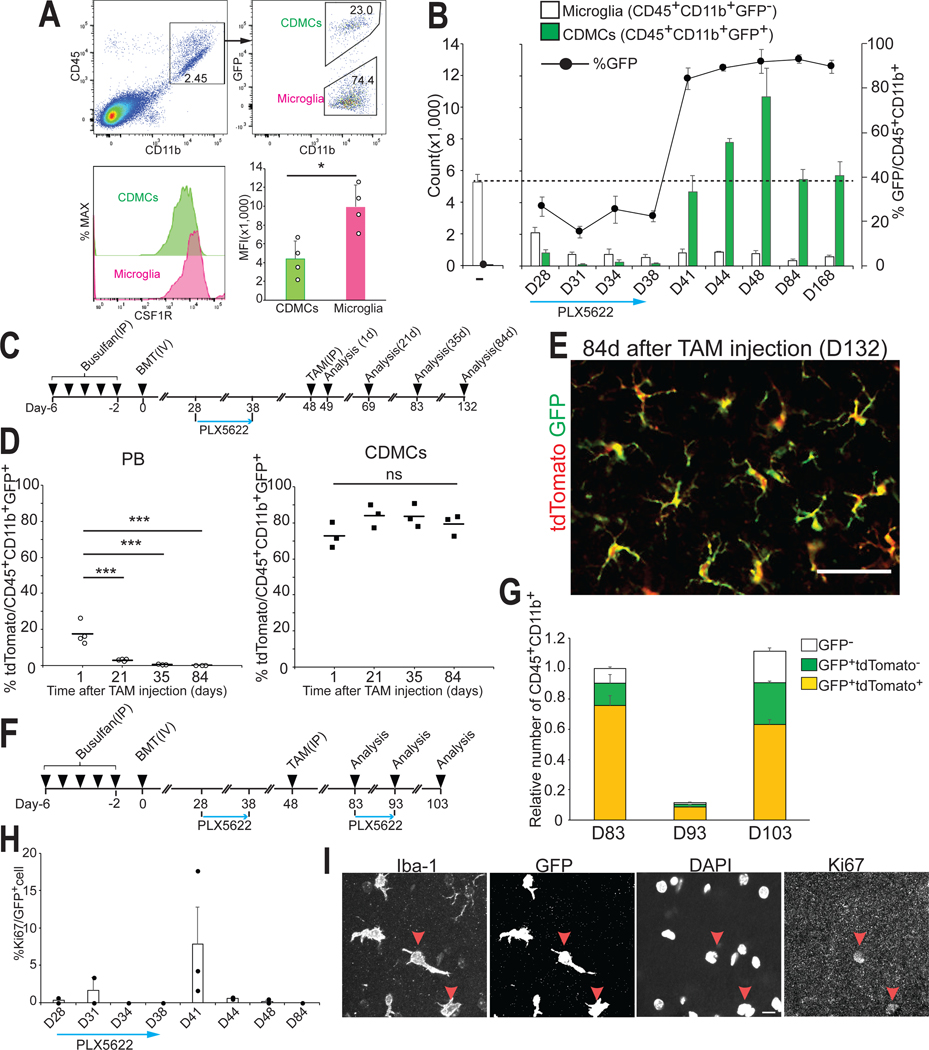
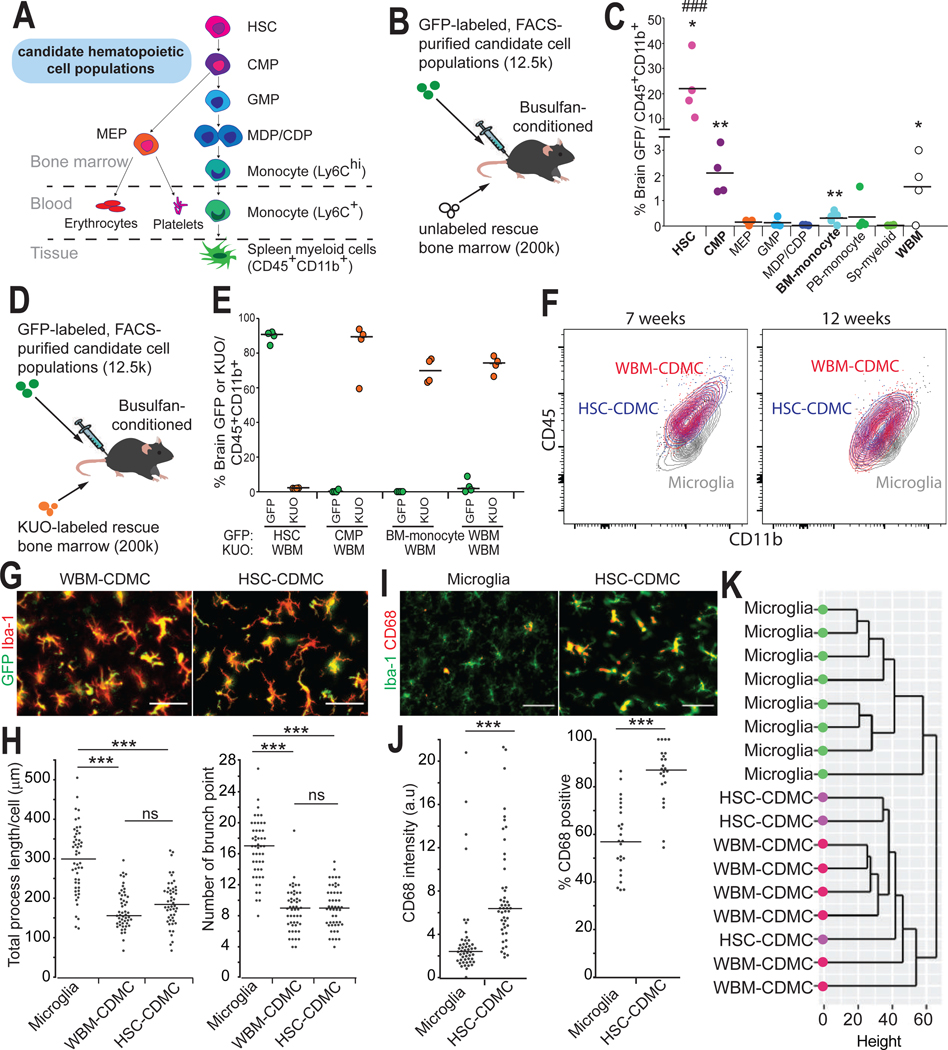
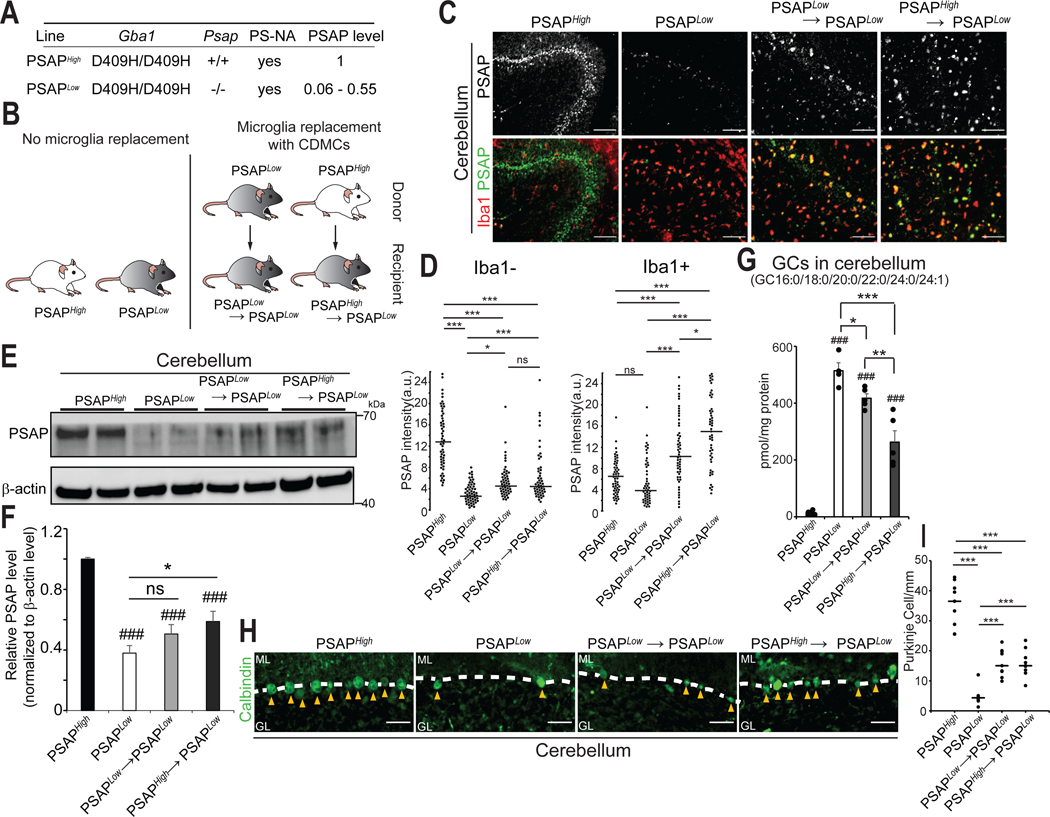
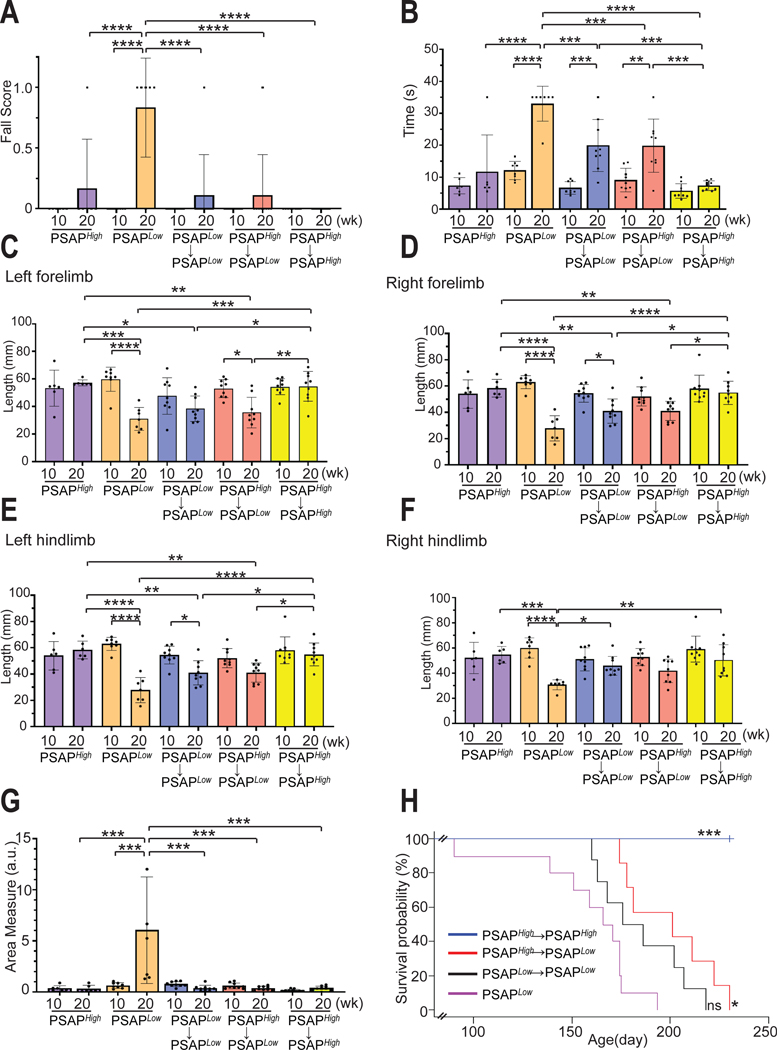
Hematopoietic cell transplantation after myeloablative conditioning has been used to treat various genetic metabolic syndromes but is largely ineffective in diseases affecting the brain presumably due to poor and variable myeloid cell incorporation into the central nervous system. Here, we developed and characterized a near-complete and homogeneous replacement of microglia with bone marrow cells in mice without the need for genetic manipulation of donor or host. The high chimerism resulted from a competitive advantage of scarce donor cells during microglia repopulation rather than enhanced recruitment from the periphery. Hematopoietic stem cells, but not immediate myeloid or monocyte progenitor cells, contained full microglia replacement potency equivalent to whole bone marrow. To explore its therapeutic potential, we applied microglia replacement to a mouse model for Prosaposin deficiency, which is characterized by a progressive neurodegeneration phenotype. We found a reduction of cerebellar neurodegeneration and gliosis in treated brains, improvement of motor and balance impairment, and life span extension even with treatment started in young adulthood. This proof-of-concept study suggests that efficient microglia replacement may have therapeutic efficacy for a variety of neurological diseases.


Conflict of interest statement

Competing interests:

The authors declare no conflict of interest.

Figures

Fig. 1
Fig. 1. Microglia replacement after bone marrow transplantation is a slow, inefficient and variable process.
(A) Schematic overview of bone marrow transplantation (BMT). (B and C) Flow cytometry analysis of donor chimerism in peripheral blood (PB) leukocytes (CD45+cells) and brain myeloid cells (CD45+CD11b+cells) at the indicated time point. GFP chimerism in PB leukocytes (B) (Mean ± SEM, n=5–20/time point, ***p < 0.001, ns: not significant, ANOVA). GFP chimerism in brain myeloid cells (C) (Mean ± SEM, n=5/time point, *p<0.05, **p<0.01, ns: not significant, ANOVA). (D) Representative images of circulation-derived myeloid cells (CDMCs) (Iba-1+GFP-) and host microglia (Iba-1+ GFP-) cells and DAPI in the cortex of recipient mice at the indicated time points. Scale bars:50 mm. (E) Percentage of ramified GFP+ cells at the indicated time points (n=3/time point, 3 brain slices/animal were quantified). (F) Schematic overview of direct intracerebral (IC) injection of GFP+ bone marrow cells with or without PLX5266 pre-treatment of recipient mice. (G) Representative images of GFP+ and Iba-1+ cells and DAPI in the brain 14 days post IC injection. The right panels are enlarged images of the boxed areas in the left panels. Scale bars: 500 μm (left), 50 μm (right). (H) Quantification of transplanted GFP+ bone marrow cells in coronal brain sections. Upper: Percentage of ramified GFP+ cells. Lower: Maximum migration distance of GFP+ cells from the injection site. Horizontal bars represent mean values (n=3/group, 3 brain slices/animal were quantified. **p<0.01, ***p<0.001, Student’s t-test). (I) Flow cytometry analysis of GFP+ bone marrow cells 14 days after direct intracerebral IC injection with (bottom) and without (top) PLX5622 pre-treatment of recipient mice.
Fig. 2
Fig. 2. A transient treatment with PLX5622 after BMT results in efficient and stable donor myeloid chimerism in the brain
(A) Schematic overview of BMT with PLX5622 treatment. Recipient mice were treated with PLX5622 or vehicle control (CTRL) for 10 days starting on D28. Donor chimerism was analyzed at the indicated time points. (B) Flow cytometry gating for analysis of myeloid chimerism in the brain. (C) Myeloid chimerism in the brain was analyzed by flow cytometry at the indicated time points. (Horizontal bars represent median values, n=5–6/time point, **p<0.01, ***p < 0.001, Student’s t-test). (D) Representative images of GFP+ and Iba-1+ cells in the cortex on D83. Scale bars: 50 μm. (E) Sagittal brain sections showing GFP+ cells and DAPI on D83. Scale bars: 1 mm. (F) Quantification of GFP+ and Iba-1+ cells in the indicated brain regions on D83. Ob: olfactory bulb, Cx: cortex, Hp: hippocampus, BS: brain stem (Mean ± SEM, n=6/group, 3 brain sections/animal were quantified. ***p < 0.001, Student’s t-test Student’s t-test).
Fig. 3
Fig. 3. CDMCs and microglia are transcriptionally distinct cells
(A) Principal component analysis (PCA) plot for microglia (n=4, green), CDMC (BMT+P) (n=3, purple), and CDMC (BMT only) (n=2, yellow) using 2,500 most variable genes. Ellipses demarcate 95% confidence interval for assigned clusters. (B) Unsupervised hierarchical clustering of microglia, CDMC (BMT+P) and CDMC (BMT only). (C) Unsupervised hierarchical clustering of our dataset and a published dataset of various microglia-like cells of different origins (24). Our samples are shown as open triangles and the published data as filled circles. CDMC after BMT with PLX5622 treatment (CDMC (BMT+P)), CDMC after conventional BMT without PLX5622 treatment (CDMC (BMT only)), microglia (MG), intracranial transplanted (ICT)-P5 microglia (ICT P5 MG), ICT-cultured microglia (ICT cultured MG), ICT-adult microglia (ICT MG), ICT- yolk sac cells (ICT YS), ICT-fetal brain cells FB (ICT FB), ICT-fetal liver cells (ICT FL), ICT-BM cells (ICT BM), ICT-PB (ICT Blood), Bone marrow transplanted by IP (BMT). (D) Quantitative real-time PCR analysis of bone marrow-derived microglia-like cell marker Ms4a7 and Clec12a in microglia and CDMCs (Mean ± SEM, n=6, *p < 0.05, **p < 0.01, ns: not significant, ANOVA). (E) Overlaid density plots of CDMCs (red) of BMT+PLX5622 protocol (BMT+P) at the indicated time points and myeloid cells of untransplanted mice (gray). (F) Representative images of GFP+ and TMEM119+ cells in the cortex on D83. Scale bars: 50 μm.
Fig. 4
Fig. 4. CDMCs are morphologically and functionally similar but distinct from microglia
(A) Representative images of Iba-1+ cells in the cortex of untransplanted mice (−), mice after BMT+P (12 weeks after transplantation), and mice after BMT+P (24 weeks after transplantation). Lower panels are enlarged images of the boxed areas in the upper panels. Scale bars: 50 μm (upper), 25 μm (lower). (B) Quantitative, morphological analysis of Iba-1+ in the indicated samples. Left: total length of processes. Center: number of branch points. Right: cell density (Horizontal bars represent median values, n=3/group, 3 brain slices/animal were quantified, ***p < 0.001, ns: not significant. ANOVA). (C) Schematic overview of in vitro phagocytosis assay of brain myeloid cells. Phagocytosis of pH-sensitive fluorescent beads was analyzed by flow cytometry. (D) Mean fluorescence intensity (MFI) of pH-sensitive fluorescent beads in the indicated samples 1 and 4 hours of incubation (Mean ± SEM, n=8, *p < 0.05, ***p < 0.001, ns: not significant, ANOVA) (E) Microglia (CX3CR1-GFP+/−) and CDMCs (CX3CR1-GFP+/→WT) were visualized in vivo by two photon microscopy. Individual frames from 30 min time-lapse imaging of microglia (upper) and CDMCs (lower). Representative images shown. Arrow heads indicate extension and retraction of processes. Scale bars: 25 μm. (F) Changes in process length were analyzed in 8 cells/group (total of 12 processes/group). Images were taken every 1 min for 30 min. (G) Motility of processes in microglia and CDMCs. (Horizontal bars represent median values, n=12 processes/group, *p < 0.05, Student’s t-test)
Fig. 5
Fig. 5. Efficiently engrafted CDMCs are primarily derived from expanded residual cells rather than from continued influx
(A) Flow cytometry analysis of expression of CSF1R in CDMCs and microglia on D28 (Mean ± SEM n=4/group, *p<0.05, Student’s t-test) (B) Time-course analysis of CD45+CD11b+GFP- (endogenous microglia) and CD45+CD11b+GFP+ cells (CDMCs) after BMT during and after PLX5622 treatment. Number of the indicated cell populations was analyzed by flow cytometry (n=3–4/time point). (C) Schematic of the BMT+P experimental protocol. (D) Expression of tdTomato in GFP+ myeloid cells in PB and the brain (CDMCs) were analyzed by flow cytometry at the indicated time point (Horizontal bars represent mean values. n=3/time point, ***p < 0.001, ns: not significant, ANOVA). (E) Representative images of GFP+ and tdTomato+ cells in the cortex on D132, i.e. 84 days after tamoxifen injection. Scale bar: 50 μm. (F) Schematic of BMT with PLX5622 to study repopulation of CDMCs after acute depletion. (G) Expression of GFP and tdTomato in brain myeloid cells was analyzed by flow cytometry at the indicated time points. (n=3/time point). (H) Ki67+GFP+ cells in the brain were quantified using immunofluorescence microscopy during and after PLX5622 treatment (n=2–3/time point). (I) Representative images of Iba-1+, GFP+, Ki67+ cells and DAPI on D41. Red arrow heads indicate Ki67+ cells. Scale bars: 10 μm
Fig. 6
Fig. 6. Hematopoietic stem cells have the highest capacity to become brain CDMCs after BMT
(A) Schematic representation of the 8 different hematopoietic subpopulations isolated for this experiment along with key surface markers used for sorting. HSC: hematopoietic stem cell, CMP: common myeloid progenitor, GMP: granulocyte/macrophage progenitor, MEP: Megakaryocyte/erythrocyte progenitor, MDP/CDP: Macrophage-Dendritic Progenitor/ Common Dendritic Progenitor. (B) Schematic of competitive transplantation using GFP-labeled hematopoietic populations (12.5×10^3 cells) and non-labeled whole bone marrow (WBM) (200×10^3 cells). (C) Percent GFP+ cells among the brain’s CD45+CD11b+ cell population was analyzed by flow cytometry on D28. SP: spleen (Horizontal bars represent median values, n=4/population. *p< 0.05, **p<0.01. p-values were calculated using a one sample t-test vs hypothetical value of 0. ###p<0.001 vs WBM, ANOVA). (D) Schematic of competitive transplantation using GFP-labeled hematopoietic populations (12.5×10^3 cells) and Kusabira orange (KUO)-labeled competitor cells (200×10^3 cells). (E) Percent GFP+ cells and KUO+ cells among the brain’s CD45+CD11b+ cell population was analyzed by flow cytometry on D48 (Horizontal bars represent median values, n=4/population). (F) Overlaid density plots of WBM-CDMCs (red), HSC-CDMCs (blue) and microglia (gray) at the indicated time points. (G) Representative pictures of GFP+ and Iba-1+ cells in the cortex of WBM-transplanted mice (left), and HSC-transplanted mice (right). Scale bars: 50 μm. (H) Quantitative, morphological analysis of Iba-1+ in the indicated samples. Left: total length of processes. Right: number of branch points (Horizontal bars represent median values, n=3/group, 3 brain slices/animal were quantified, ***p < 0.001, ns: not significant. ANOVA). (I) Immunofluorescence staining for Iba-1 and the activated microglia marker CD68 in untransplanted mice (microglia) and HSC-transplanted (HSC-CDMC) mice on D48. Representative images are shown. Scale bars: 50 μm. (J) Quantification of CD68+ cells in the indicated mice. Left: fluorescence intensity of CD68. Right: percentage of CD68+cells in Iba-1+cells (Horizontal bars represent median values, n=3/group, 3 brain slices/animal, ***p < 0.001, Student’s t-test). (K) Unsupervised hierarchical clustering of microglia, WBM-CDMCs, and HSC-CDMCs.
Fig. 7
Fig. 7. Microglia replacement with CDMCs mitigates Purkinje cells degeneration in a mouse model of Psap deficiency
(A) Gene mutation and transgene in PSAPHigh and PSAPLow mice. PSAPLow mice show symptoms of neurodegeneration. (B) Schematic of experimental BMT outline. (C) Representative pictures of PSAP+ and Iba-1+ cells in the cerebellum of indicated mice. Scale bars: 100 μm (D) Quantitative analysis of fluorescence intensity of PSAP in Iba-1compartment (left) and Iba-1+ cells (right) in the indicated samples. (*p<0.05, ***p<0.001, ns: not significant, ANOVA) (E) Brain extracts from the cerebellum of the indicated groups were analyzed by Western blot for PSAP protein. Representative blot is shown. (F) Quantification of blots (n=6/group, ### p<0.001 vs PSAPHigh, *p<0.05, ns: not significant, ANOVA). (G) Six glucocerebrosidase (GC) species (GC16:0, GC18:0, GC20:0, GC22:0, GC24:0 and GC24:1) in the cerebellum of the indicated samples were quantified by supercritical fluid chromatography tandem mass spectrometry (SFC-MS/MS) (n=4–5, ### p<0.001 vs PSAPHigh, *p<0.05, **p<0.01, ***p<0.001, ANOVA) (H) Representative pictures of Calbindin-positive Purkinje cells (arrow heads) in the cerebellum in the indicated samples. ML: molecular layer. GL: granular layer. Scale bars: 50 μm. (I) Quantitative analysis of Calbindin-positive Purkinje cells in the cerebellum of the indicated samples (n=3/group, 3 brain slices/animal were quantified, ***p<0.001, ANOVA).
Fig. 8
Fig. 8. Microglia replacement with CDMCs ameliorates disease progression in Psap-deficient mice
(A and B) Motor coordination in the indicated groups was evaluated by the elevated beam test. The beam used was 100 cm in length and 17 mm in width. Number of falling off the beam (A) (df=9, F= 8.377, p<0.0001) and time to cross the beam (B) (df=9, F=18.33, p<0.0001) were measured. (C to F) Footprints of the indicated groups were evaluated for stride length of left forelimb (C) (df=9, F= 8.467, p<0.0001), right forelimb (D) (df=9, F= 12.47, p<0.0001), left hindlimb (E) (df=9, F= 6.486, p<0.0001), and right hindlimb (F) (df=9, F= 6.832, p<0.0001). (G) Locomotor behavior was assessed by the open field test in the indicated groups. Plot demonstrates area measure, a metric of the number of sharp turns instead of straight-line runs during a 20-minute open field trial (df=8, F= 9.59, p<0.0001). All behavior assays were analyzed statistically by ANOVA. Mean ± SEM, *p<0.05, **p<0.005, ***p<0.0005, ****p<0.0001. PSAPHigh (n=6), PSAPLow(n=7), PSAPLow→PSAPLow(n=9), PSAPHigh→PSAPLow (n=9), PSAPHigh→PSAPHigh (n=9) (H) Lifespan of PSAPLow (green, n=10), PSAPLow→PSAPLow (black, n=9), PSAPHigh→PSAPLow (red, n=7), and PSAPHigh→PSAPHigh, (blue, n=8). (***p< 0.001, *p< 0.05, ns: not significant, vs PSAPLow mice, Logrank. Chi square= 35.9, df=3, p<0.0001).

References

    1. Barker RA, Parmar M, Studer L, Takahashi J, Human Trials of Stem Cell-Derived Dopamine Neurons for Parkinson’s Disease: Dawn of a New Era. Cell Stem Cell. 21, 569–573 (2017). - PubMed
    1. Tao Y, Vermilyea SC, Zammit M, Lu J, Olsen M, Metzger JM, Yao L, Chen Y, Phillips S, Holden JE, Bondarenko V, Block WF, Barnhart TE, Schultz-Darken N, Brunner K, Simmons H, Christian BT, Emborg ME, Zhang S-C, Autologous transplant therapy alleviates motor and depressive behaviors in parkinsonian monkeys. Nat Med. 27, 632–639 (2021). - PMC - PubMed
    1. Gupta N, Henry RG, Strober J, Kang S-M, Lim DA, Bucci M, Caverzasi E, Gaetano L, Mandelli ML, Ryan T, Perry R, Farrell J, Jeremy RJ, Ulman M, Huhn SL, Barkovich AJ, Rowitch DH, Neural Stem Cell Engraftment and Myelination in the Human Brain. Science Translational Medicine. 4, 155ra137–155ra137 (2012). - PMC - PubMed
    1. Copelan EA, Hematopoietic Stem-Cell Transplantation. New England Journal of Medicine. 354, 1813–1826 (2006). - PubMed
    1. Malatack JJ, Consolini DM, Bayever E, The status of hematopoietic stem cell transplantation in lysosomal storage disease. Pediatr Neurol. 29, 391–403 (2003). - PubMed

Publication types