. 2022 Mar 16;14(636):eabg8402.
doi: 10.1126/scitranslmed.abg8402. Epub 2022 Mar 16.

Metabolic adaptation of ovarian tumors in patients treated with an IDO1 inhibitor constrains antitumor immune responses

Affiliations

Metabolic adaptation of ovarian tumors in patients treated with an IDO1 inhibitor constrains antitumor immune responses

Kunle Odunsi et al. Sci Transl Med. .

Abstract

To uncover underlying mechanisms associated with failure of indoleamine 2,3-dioxygenase 1 (IDO1) blockade in clinical trials, we conducted a pilot, window-of-opportunity clinical study in 17 patients with newly diagnosed advanced high-grade serous ovarian cancer before their standard tumor debulking surgery. Patients were treated with the IDO1 inhibitor epacadostat, and immunologic, transcriptomic, and metabolomic characterization of the tumor microenvironment was undertaken in baseline and posttreatment tumor biopsies. IDO1 inhibition resulted in efficient blockade of the kynurenine pathway of tryptophan degradation and was accompanied by a metabolic adaptation that shunted tryptophan catabolism toward the serotonin pathway. This resulted in elevated nicotinamide adenine dinucleotide (NAD+), which reduced T cell proliferation and function. Because NAD+ metabolites could be ligands for purinergic receptors, we investigated the impact of blocking purinergic receptors in the presence or absence of NAD+ on T cell proliferation and function in our mouse model. We demonstrated that A2a and A2b purinergic receptor antagonists, SCH58261 or PSB1115, respectively, rescued NAD+-mediated suppression of T cell proliferation and function. Combining IDO1 inhibition and A2a/A2b receptor blockade improved survival and boosted the antitumor immune signature in mice with IDO1 overexpressing ovarian cancer. These findings elucidate the downstream adaptive metabolic consequences of IDO1 blockade in ovarian cancers that may undermine antitumor T cell responses in the tumor microenvironment.


Conflict of interest statement

Competing interests: K.O. is a co-founder of Tactiva Therapeutics and receives research support from AstraZeneca and Tesaro. R.K. is a co-founder of Tactiva Therapeutics, and engaged in past or current consulting for Terumo BCT, Coastar, and Medicago, and these have no relation to the current manuscript. All NanoString Technologies employees (L.D., P.D., S.W.) declare that they are employees and shareholders of NanoString Technologies. A.R.M. is a paid Consultant for Cellular Analytics, Inc., which is developing TIL-based therapies for cancer. D.M. is President and CEO of Enhanced Pharmacodynamics, LLC, and he declares no conflict of interest. C.D.M. had held restricted stock in OmniSeq but no longer holds that stock and declares no conflict of interest. C.M. is a paid consultant for Merck for a vaccine product, but it is unrelated to this work. A.H., A.L., A.M.L., C.D.M., D.E.M., E.Z., F.D., H.Y., J.C., J.C.K., J.M., L.D.A., M.A.C., M.A.G., M.L.D., N.P., N.R., R.G., R.K., S.B., S. Liu, S. Lele, S.P.F., F.Q., S. Ravi, S. Rosario, T.C., T.T., V.A.N., V.P., and W.Z. declare no conflict of interest.

Figures

Figure 1.
Figure 1.. Overall survival and metabolic assessment of pre- and post-treatment tumors from patients with ovarian cancer
(A) Kaplan-Meier summary of overall survival proportions, (B) Unsupervised principal component (PC) analysis of metabolites within tumors from D00 to D15 was performed on tumors from 12 patients. (C) Alterations from D00 to D15 of key metabolite classes relative to Trp abundance based on PC1 projection for the same tumors from the same patients. (D) Pathway impact of changes in metabolite classes.
Figure 2.
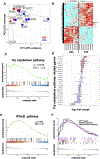
Figure 2.. Transcriptional immune signature driven by EPA.
(A) Principal component analysis using D00 (red) and D15 (blue) tumors from 12 patients with sufficient amount of paired tissue samples. Matched D00 and D15 samples are connected, indicating the overall shift of the transcriptional pattern within the same patient. (B) Heatmap showing differentially expressed genes (n=1,208, FDR≤0.01, log2FC≥0.5) between D00 and D15. Red and cyan indicate high and low expression, respectively. (C) Gene Set Enrichment Analysis (GSEA) analysis for Trp pathway. Rank statistics (bottom portion of the figure, see y axis label) and normalized enrichment scores (top portion of the figure, see y axis label) indicate down- and up-regulation, respectively, for the Trp pathway. (D) Boxplot indicating the transcript log2 fold changes (x axis) of Trp catabolism. (E) GSEA analysis for IFN pathway. Rank statistics (bottom portion of the figure, see y axis label) and normalized enrichment scores (top portion of the figure, see y axis label) indicate down- and up-regulation, respectively, for the IFN pathway. (F) GSEA plot of pathways upregulated in D15 vs. D00. MYC targets, Normalized Enrichment Score (NES)=1.72 P=4e-04, TGFβ Signaling NES=1.61 P=5e-03, WNT/β-Catenin Signaling NES=1.77P=7e-04.
Figure 3.
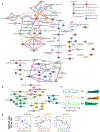
Figure 3.. Metabolic assessment of tumors reveals alternative pathways for Trp catabolism.
(A) Integrated transcriptomic and metabolomics network of Trp and nicotinamide metabolism in tumors from 12 patients. Major paths of Trp and NAD+ metabolism are marked: 1) Kyn generation upstream of kynurenate (Kyna) production and nicotinamide metabolism (blue lines); 2) serotonin and melatonin metabolism (red lines); 3) Preiss-Handler pathway for NAD+ synthesis (brown); 4) de novo synthesis pathway for NAD+ synthesis (purple); 5) salvage pathway for NAD+ synthesis and nicotinamide metabolism (orange). (B) Correlation network of genes and metabolites in Trp metabolism and Nic metabolism pathways clustered by greedy maximization of modularity. Four clusters were identified: cluster Kyn, cluster Ser, cluster NAD, and cluster Nic. (C) Kyn reduction, serotonin elevation, and Nic elevation scores from D00 to D15 in samples evaluated by transcriptomics and metabolomics. (D) Linear regression analysis was performed for associations between changes in SAM:SAH ratio and scores were: the Kyn (R2=0.63) and Nic (R2=0.44) clusters, and serotonin cluster (R2=0.08).
Figure 4.
Figure 4.. Genome-wide reconstruction of metabolic subsystem reactions using reaction differential expression analysis on Recon 3D human metabolic network.
(A) Enrichment analysis of the reaction differential expression in Recon3D model. Over-represented metabolic subsystems (FDR<0.1) are upregulated (red) or downregulated (blue). Significantly altered metabolic subsystems of (B) glycolytic and pentose phosphate pathway, (C) NAD+ biosynthesis, (D) Trp metabolism, and (E) citric acid cycle. Metabolites are represented as nodes on the network with red indicating upregulation or blue signifying downregulation between D00 and D15. Values above reactions are mean log fold change of the reaction expression.
Figure 5.
Figure 5.. Spatial relationship of immune cells within TME.
(A) IHC measurement of tumor infiltrating CD3 and CD8 expression at D00 and D15 across 12 patients. (B) IHC measurement of IDO1 expression based on H-score in D00 and D15 tumor tissue. (C) Quantification of CD8+, FoxP3+, and IDO1+ cells from IMC staining. Bar plots (left side) indicate the ratio of marker positive cells calculated over the total number of tumor and stroma cells, separated by D00 (blue) and D15 (red). IMC representative mask images of samples with high or low infiltration as indicated by the corresponding bar plots. (D) IMC images highlighting IDO1 and HLA-DR expression and changes between D00 (left) and D15 (right). Yellow arrows indicate focal points of co-localization. (E) IMC analyses indicating CD8 and CD27 co-expression in samples at D00 (left) and D15 (right). (F-G) Distance score of IDO1+ cells (F) and CD8+ cells (G) vs. keratin+ tumor cells from D00 to D15, ordered by distance to tumor cells. Red and blue indicate samples at D00 and D15, respectively, thus showing separation between the two time points.
Fig. 6.
Fig. 6.. Phenotypic and functional attributes of immune cells infiltrating tumors following IDO1 blockade.
CyTOF analysis of samples at D00 and D15 in 13 patients. (A) tSNE projection of the 12 clusters identified highlighting the predominant cell types. (B) Heatmap of the median abundance of the markers used for CyTOF analysis per each cluster. Red and blue cells indicate high and low abundance, respectively. (C) tSNE projection of data acquired from single cell tumor suspension indicating distribution between D00 (blue) and D15 (red). (D) Number of cells per each cluster per each time point (D00 = blue, D15 = red). (E) Distribution of key immune markers across clusters, split by Days, with green and purple indicating high and low marker abundance, respectively. (F) Correlation of immune marker expression with metabolic scores. Orange and blue indicate positive and negative correlation, respectively.
Figure 7:
Figure 7:. Effects of purinergic receptors on NAD+-mediated T cells suppression.
(A) Cumulative data of the fold change in human healthy donor CD8+ T cell proliferation stimulated with anti-CD3/CD28 beads in the presence of the indicated combinations of NAD and antagonists to A2BR (PSB 1115), A2AR (SCH 58261), P2XR (oATP), P2X1R (NF 449), P2X3R (NF 110), A1R (PSB 36), P2X4R (5-BDBD) and P2Y1R (MRS 2279) respectively. In all box charts, the median and min-max of the values are presented; *P < 0.05, **P < 0.01, ***P < 0.001,****P < 0.0001. Wilcoxon and one-way ANOVA tests. (B) Survival data of IE9mp1-mIDO1 tumor-bearing mice treated with EPA, A2a, A2b receptor antagonist, or combination of EPA, A2a, and A2b receptor antagonist (n= 5 animals per group). Mice were treated by oral gavage with 300mg/kg EPA in 200μl 0.5% methylcellulose, i.p. injection 5 days on and two days off from d7-d21, with or without (i) NAMPT inhibitor FK866 (500 μg per mouse i.p.) once every week for 3 weeks (on day 13, 20, 27); and (ii) with or without A2a, A2b or A2a/A2b antagonists (1mg/kg, i.p. 5 days on two days off from d7-d21). *, P<0.05 compared to vehicle. Statistical analysis was calculated using a log-rank analysis. (C). Heatmap representing the Log2FC of core set genes of immune pathways that are significantly differentially expressed (FDR < 0.05) in the treatment groups compared with the vehicle group of mice. Blue and red indicate down- and up-regulation, respectively.

References

    1. Munn DH, Mellor AL, Indoleamine 2,3-dioxygenase and tumor-induced tolerance, J Clin Invest 117, 1147–1154 (2007). - PMC - PubMed
    1. Uyttenhove C, Pilotte L, Theate I, Stroobant V, Colau D, Parmentier N, Boon T, Van den Eynde BJ, Evidence for a tumoral immune resistance mechanism based on tryptophan degradation by indoleamine 2,3-dioxygenase, Nat Med 9, 1269–1274 (2003). - PubMed
    1. Munn DH, Sharma MD, Baban B, Harding HP, Zhang Y, Ron D, Mellor AL, GCN2 kinase in T cells mediates proliferative arrest and anergy induction in response to indoleamine 2,3-dioxygenase, Immunity 22, 633–642 (2005). - PubMed
    1. Metz R, Rust S, Duhadaway JB, Mautino MR, Munn DH, Vahanian NN, Link CJ, Prendergast GC, IDO inhibits a tryptophan sufficiency signal that stimulates mTOR: A novel IDO effector pathway targeted by D-1-methyl-tryptophan, Oncoimmunology 1, 1460–1468 (2012). - PMC - PubMed
    1. Fallarino F, Grohmann U, Hwang KW, Orabona C, Vacca C, Bianchi R, Belladonna ML, Fioretti MC, Alegre ML, Puccetti P, Modulation of tryptophan catabolism by regulatory T cells, Nat Immunol 4, 1206–1212 (2003). - PubMed

Publication types