. 2022 Mar 16;18(3):e1009970.
doi: 10.1371/journal.pcbi.1009970. eCollection 2022 Mar.

Simulation atomic force microscopy for atomic reconstruction of biomolecular structures from resolution-limited experimental images

Affiliations

Simulation atomic force microscopy for atomic reconstruction of biomolecular structures from resolution-limited experimental images

Romain Amyot et al. PLoS Comput Biol. .

Abstract

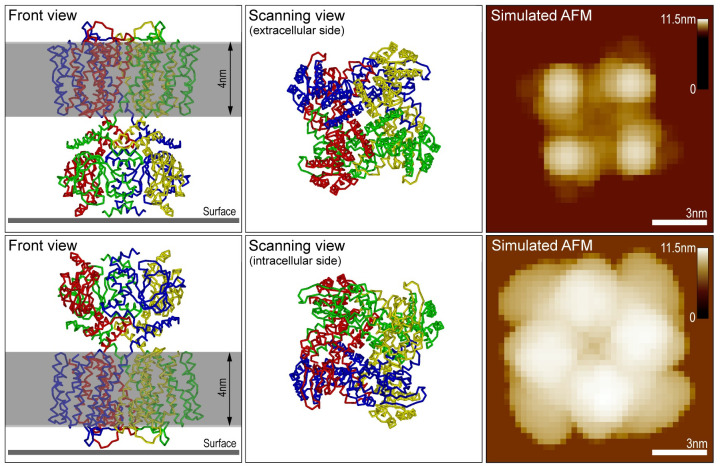
Atomic force microscopy (AFM) can visualize the dynamics of single biomolecules under near-physiological conditions. However, the scanning tip probes only the molecular surface with limited resolution, missing details required to fully deduce functional mechanisms from imaging alone. To overcome such drawbacks, we developed a computational framework to reconstruct 3D atomistic structures from AFM surface scans, employing simulation AFM and automatized fitting to experimental images. We provide applications to AFM images ranging from single molecular machines, protein filaments, to large-scale assemblies of 2D protein lattices, and demonstrate how the obtained full atomistic information advances the molecular understanding beyond the original topographic AFM image. We show that simulation AFM further allows for quantitative molecular feature assignment within measured AFM topographies. Implementation of the developed methods into the versatile interactive interface of the BioAFMviewer software, freely available at www.bioafmviewer.com, presents the opportunity for the broad Bio-AFM community to employ the enormous amount of existing structural and modeling data to facilitate the interpretation of resolution-limited AFM images.


Conflict of interest statement

The authors have declared that no competing interests exist.

Figures

Fig 1
Fig 1. BioAFMviewer interactive interface.
Central are the synchronized molecular viewer and AFM windows which provide live simulated scanning of the loaded molecular structure in arbitrary orientations. The Assistant window (left) allows to conveniently change scanning parameters such as spatial resolution and tip shape, and to adjust the height range and color scale of the displayed simulated AFM graphics. The Toolbox provides the implemented topography analysis tools and the tool for fitting to an uploaded experimental AFM image (right). Here, the actin filament was used for demonstration.
Fig 2
Fig 2. Optimal fitting to AFM images.
A,D: HS-AFM images of the 2D lattice formation of SthK channels obtained from scanning the extracellular side in the activated state (A), and resting state (D), respectively. B,E: Simulated AFM images obtained from optimized fitting the molecular channel structure (PDB 6CJQ) individually into 15 selected AFM surface scans for each lattice (marked by red frames in A,D). C,F: Arrays of corresponding atomistic SthK structures for the activated state (C), and resting state lattice (F), respectively. For clarity the extracellular regions and voltage sensing domains are displayed in opaque colors, while intracellular domains are transparent (colors represent different domains in the tetramer). The lipid bilayer is schematically illustrated in gray. For a selected channel in the resting state lattice (F), the contact interfaces of its voltage sensing domains with that of neighboring channels are marked by pink ellipses using solid (tight interactions) and dashed (membrane-mediated interactions) borders.
Fig 3
Fig 3. Fitting to AFM images.
Top row: Superposition of the actin-filament all-atom structure and the simulated AFM image (left) obtained from fitting to the experimental HS-AFM image (right). In the molecular structure the barbed-end is located at the right side (red and blue colored domains.) Bottom row: Reconstruction of the atomistic protein structure from fitting to AFM images for the ClpB chaperone (left, PDB 5KNE), and the F1-ATPase (right, PDB 1SKY). The ClpB HS-AFM image is adopted from [17] (scale bar is 5nm) and that of F1-ATPase is from [10].
Fig 4
Fig 4. Demonstration of the Topography Tools.
A-D: Line Tool function applied to the simulated and experimental AFM image of F-actin (A,B). The two chosen lines are displayed in red. Their corresponding height topographies obtained from simulated and AFM scanning of the molecular surface are compared in panels (C) and (D). E-H: Cross Tool applied to the ClpB protein. Height profiles along vertical and horizontal red lines chosen in simulated (E, using PDB 5KNE) and experimental AFM images (F, adopted from [17]; scale bar is 5nm) are compared in panels (G) and (H). I,J: Peak Tool applied to F1-ATPase images. In both simulated (I, using PDB 1SKY) and AFM graphics (J, adopted from [10]), user-selected regions are marked by red rectangles, inside which red spheres indicate positions with the largest surface height (corresponding values are given).
Fig 5
Fig 5. Demonstration of the Membrane Tool.
Simulated scanning of the SthK ion channel (PDB 6CJQ) from the extracellular side (top row), and the intracellular side (bottom row). Channel structures in the orientations in which scanning is performed from the top are shown in the middle panel. The corresponding front view perspectives (left panel) display the placement of the solid double layer. On the right side the simulated AFM images are shown together with the respective color bars of detected height for the channel double-layer system.

References

    1. Nakajima H, Kunioka Y, Nakano K, Shimizu K, Seto M, Ando T. Scanning force microscopy of the interaction events between a single molecule of heavy meromyosin and actin. Biochem Biophys Res Commun. 1997; 234: 178–182. doi: 10.1006/bbrc.1997.6612 - DOI - PubMed
    1. Allison DP, Hinterdorfer P, Han W. Biomolecular force measurements and the atomic force microscope. Curr Opin Biotech. 2002; 13: 47–51. doi: 10.1016/S0958-1669(02)00283-5 - DOI - PubMed
    1. Müller DJ, Janovjak H, Lehto T, Kuerschner L, Anderson K. Observing structure, function and assembly of single proteins by AFM. Prog Biophys Mol Biol. 2002; 79: 1–43. doi: 10.1016/S0079-6107(02)00009-3 - DOI - PubMed
    1. Hinterdorfer P, Dufrêne YF. Detection and localization of single molecular recognition events using atomic force microscopy. Nat Methods. 2006; 3: 347–355. doi: 10.1038/nmeth871 - DOI - PubMed
    1. Müller DJ, Dufrêne YF. Atomic force microscopy as a multifunctional molecular toolbox in nanobiotechnology. Nat Nanotechnol. 2008; 3: 261–269. doi: 10.1038/nnano.2008.100 - DOI - PubMed

Publication types