. 2022 Mar 16;18(3):e1010375.
doi: 10.1371/journal.ppat.1010375. eCollection 2022 Mar.

Experimental evolution links post-transcriptional regulation to Leishmania fitness gain

Affiliations

Experimental evolution links post-transcriptional regulation to Leishmania fitness gain

Laura Piel et al. PLoS Pathog. .

Abstract

The protozoan parasite Leishmania donovani causes fatal human visceral leishmaniasis in absence of treatment. Genome instability has been recognized as a driver in Leishmania fitness gain in response to environmental change or chemotherapy. How genome instability generates beneficial phenotypes despite potential deleterious gene dosage effects is unknown. Here we address this important open question applying experimental evolution and integrative systems approaches on parasites adapting to in vitro culture. Phenotypic analyses of parasites from early and late stages of culture adaptation revealed an important fitness tradeoff, with selection for accelerated growth in promastigote culture (fitness gain) impairing infectivity (fitness costs). Comparative genomics, transcriptomics and proteomics analyses revealed a complex regulatory network associated with parasite fitness gain, with genome instability causing highly reproducible, gene dosage-independent and -dependent changes. Reduction of flagellar transcripts and increase in coding and non-coding RNAs implicated in ribosomal biogenesis and protein translation were not correlated to dosage changes of the corresponding genes, revealing a gene dosage-independent, post-transcriptional mechanism of regulation. In contrast, abundance of gene products implicated in post-transcriptional regulation itself correlated to corresponding gene dosage changes. Thus, RNA abundance during parasite adaptation is controled by direct and indirect gene dosage changes. We correlated differential expression of small nucleolar RNAs (snoRNAs) with changes in rRNA modification, providing first evidence that Leishmania fitness gain in culture may be controlled by post-transcriptional and epitranscriptomic regulation. Our findings propose a novel model for Leishmania fitness gain in culture, where differential regulation of mRNA stability and the generation of modified ribosomes may potentially filter deleterious from beneficial gene dosage effects and provide proteomic robustness to genetically heterogenous, adapting parasite populations. This model challenges the current, genome-centric approach to Leishmania epidemiology and identifies the Leishmania transcriptome and non-coding small RNome as potential novel sources for the discovery of biomarkers that may be associated with parasite phenotypic adaptation in clinical settings.


Conflict of interest statement

The authors declare that they have no conflict of interest.

Figures
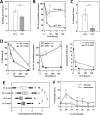
Fig 1
Fig 1. Phenotypic analysis of EP.1 and LP.1 parasites reveals fitness tradeoff between in vitro proliferation and macrophage infectivity.
(A) Histogram plot representing the generation time of EP.1 and LP.1 promastigotes in culture calculated based on parasite density during logarithmic growth phase. The mean value of three independent experiments +/- SD is represented. *p-value ≤ 0.05. (B) Macrophage infection assay. The mean relative number of intracellular EP.1 (open circles) and LP.1 (grey circles) parasites +/- SD of three independent triplicate experiments using promastigotes from day-3 stationary culture is represented. **p-value ≤ 0.01. (C) Histogram plot representing the percentage of EP.1 and LP.1 metacyclic forms that were enriched by Ficoll density gradient centrifugation from cultures at stationary growth phase. Each bar represents the mean +/- SD of four independent experiments. *p-value ≤ 0.05. (D) Macrophage infection assay using Ficoll-enriched metacyclic parasites. Percentage of infected macrophages (left panel), mean relative number of intracellular EP.1 and LP.1 parasites (middle panel) and mean number of parasites per 100 macrophages (right panel) are shown. Open triangles, EP.1 meta; close triangles, LP.1 meta. The mean values +/- SD of one triplicate experiment are shown. **p-value ≤ 0.01. (E) Morphological characterization of EP.1 and LP.1 Ficoll-enriched metacyclic parasites. Body width, flagellum and body length were measured on 200 promastigotes using the Image J software package. The ratio flagellum-to-body length was computed from two biological replicate experiments and the median values +/- SD are represented by the box plot with the upper and lower quartiles indicated. **p-value ≤ 0.01. (F) Percentage of metacyclic-like parasites recovered by Ficoll gradient centrifugation from cultures seeded successively for 6 in vitro passages with either EP.1 from stationary growth phase (stat-stat) or EP.1 metacyclic-enriched parasites (meta-meta). Mean values of two independent experiments are shown with +/-SD denoted by the bars.
Fig 2
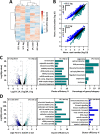
Fig 2. RNA-seq analyses of EP.1 and LP.1 promastigotes reveal stage-specific changes in RNA abundance and RNA signatures linked to fitness gain in culture and fitness cost in infectivity.
(A)Cluster analysis of differentially expressed genes observed in triplicate RNAseq analyses of EP.1 log and LP.1 log, EP.1 stat and LP.1 stat, and EP.1 meta parasites. (B) Ratio plots of normalized RNAseq reads for EP.1 log compared to EP.1 stat (upper panel) and LP.1 log compared to LP.1 stat (lower panel). Blue and dark cyan dots represent gene expression changes with FC > 1.5 and adjusted p-value ≤ 0.01; black dots correspond to gene expression changes with adjusted p-value > 0.01. Only genes with at least 10 reads in one of the two conditions were considered. Top panel, 1,499 and 1,501 transcripts more abundant in EP.1 log (dark cyan) and EP.1 stat (blue), respectively. Lower panel, 1,129 and 1,384 transcripts more abundant in LP.1 log (dark cyan) and LP.1 stat (blue), respectively (see Sheets a and d in S2 Table). (C) Differential expression profiling of LP.1 log and EP.1 log parasites. Transcripts more abundant in EP.1 log correspond to transcripts less abundant in LP.1 log. Volcano plot representing the changes in transcript abundances of LP.1 log and EP.1 log parasites with 344 transcripts more abundant in LP.1 log (LP.1 log up) versus 433 transcripts less abundant in LP.1 log (LP.1 log down) (left panel) (see Sheets g and h in S2 Table for the list of regulated genes). Transcripts with significant increased abundance FC > 1.5 and adjusted p-value ≤ 0.01 in LP.1 log up and LP.1 log down are indicated respectively in cyan and blue and were used to perform the GO analysis for the category ‘biological process’. The histogram plot (middle panel) shows ‘cluster efficiency’, which represent the percentage of genes associated with a given GO term compared to the total number of genes with any GO annotation in the considered set of genes. Only functional enrichments associated with adj. p-value < 0.05 were considered. For transcripts more abundant in LP.1 log (LP.1 log up), only 134 out of 344 genes are associated with a GO ID (see Sheet o in S2 Table for details). Transcripts showing increased abundance and adj. p-value <0.01 in LP.1 log were categorized in functional groups (right panel). The histogram plot shows the percentage of genes which represent the number of genes for the indicated gene families compared to the total number of genes with a known function or product (see Sheet I in S2 Table for details). (D) Differential expression profiling of LP.1 stat and EP.1 stat parasites. Transcripts more abundant in EP.1 stat correspond to transcripts less abundant in LP.1 stat. Volcano plot representing the changes in transcript abundances of LP.1 stat and EP.1 stat parasites with 662 transcripts more abundant in LP.1 stat (LP.1 stat up) versus 710 transcripts less abundant in LP.1 stat (LP.1 stat down) (left panel) (see Sheets k and l in S2 Table for the list of up regulated genes). Transcripts with significant increased abundance FC > 1.5 and adjusted p-value ≤ 0.01 in LP.1 stat up and LP.1 stat down are indicated respectively in cyan and blue and were used to perform the GO analysis. Results of GO analyses for the category ‘biological process’ performed on transcripts showing statistically significant increased (middle panel) and decreased (right panel) abundance in LP.1 stat are shown (see Sheet o in S2 Table). Cluster efficiencies were calculated based on 258 and 274 genes with GO IDs in LP.1 stat up and LP.1 stat down set of genes, respectively. Only the functional enrichments associated with adj. p-value < 0.05 were considered.
Fig 3
Fig 3. RNA abundance during fitness gain in culture is regulated by gene dosage and post-transcriptional mechanisms.
(A) Ratios of DNA and RNA normalized read counts for all genes were plotted for LP.1 log compared to EP.1 log (left panel) and for LP.1 stat compared to EP.1 stat (right panel). Green dots correspond to genes encoded on trisomic chromosomes in LP.1 parasites. The regression line is represented by the dotted red line. Pearson correlation coefficients and p-values were estimated for both ratio plots using SigmaPlot software. For LP.1 log compared to EP.1 log: ρ = 0.341 and p-value < 10−10. For LP.1 stat compared to EP.1 stat: ρ = 0.333 and p-value < 10−10. (B) Normalized coverage based on the ratio of DNA read counts in LP.1 versus EP.1 for the trisomic chromosomes 5 (upper panel) and 26 (middle panel), and the disomic chromosome 36 (lower panel). The coverage ratio is indicated by the lines, while ORFs are indicated by the vertical bars. The color code reflects the DNA strand on which the ORFs are encoded (see Sheets f and h in S5 Table). (C) Post-transcriptional regulation of transcript abundance. RNA read counts were normalized by DNA read counts and plotted for all genes in LP.1 log compared to EP.1 log (left panel) and EP.1 stat compared to LP.1 stat (right panel). Green dots correspond to genes encoded on trisomic chromosomes in LP.1 (see Sheets a and c in S5 Table). The calculated (red) and expected (blue) regression lines are represented. (D) Cluster efficiency computed from GO term-enrichment analysis for the ‘biological process’ category for 659 gene dosage-independent genes. Transcripts with adj. p-value < 0.01 were considered to determine the ratio of ‘normalized RNA abundance in LP.1/RNA normalized abundance in EP.1’ (see Sheet I in S5 Table for details). Cluster efficiency was calculated based on 274 genes with GO IDs out of the 659 genes that showed at least a 1.2-fold increase in LP.1 normalized RNA abundance compared to EP.1. Only the functional enrichments associated with adj. p-value < 0.05 were considered. (E) Table listing selected gene dosage-dependent and -independent expression changes (from Sheets d and e in S5 Table). The fold change values computed from RNA (grey bars) and DNA (black bars) normalized read counts for LP.1 versus EP.1 log parasites are shown.
Fig 4
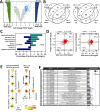
Fig 4. Quantitative analysis of the fitness-adapted proteome.
(A) Volcano plot representing changes in protein abundance in EP log (blue dots, mean values of EP.2, EP.3, EP.4 and EP.5 are shown) compared to LP log (green dots, mean values of LP.2, LP.3, LP.4 and LP.5 are shown). Proteins identified by at least two peptides in at least three out of four biological replicates were considered. Colored dots indicate values with FDR < 0.01 and fold changes ≥ 2 (see Sheets b and f in S6 Table). The grey dots indicate non-significant expression changes. The bars indicate unique protein identifications in LP (LP only, green) and EP (EP only, blue) samples, with relative abundance indicated by the iBAQ value. (B) Venn diagram showing the number of proteins quantified and associated to a p-value < 0.01 with increased (left panel) or decreased (right panel) abundance in all four LP log biological replicates (see Sheets c and e in S6 Table). (C) Manual Gene ontology analysis of the proteins shared in all four LP log biological replicates expressed as the percentage of proteins quantified with associated p-value < 0.01 for the indicated gene categories (see Sheets h and I in S6 Table). (D) Double ratio plots comparing the fold changes computed for each gene between LP and EP log parasites for RNA (x-axis) versus protein (y-axis) (left panel) and DNA (x-axis) versus protein (y-axis) (right panel). All proteins with LFQ values were considered to determine the protein ratio LP/EP (see Methods). Grey dots represent all proteins and red dots those encoded on trisomic chromosomes 5 and 26 (see Sheets a and h in S7 Table). Cluster 1.1 and 1.2 (Cl 1.1 and Cl 1.2) includes proteins whose change in abundance shows the same tendency compared to RNA abundance or gene dosage, respectively. The regression line is represented by the dotted red line. The Pearson correlation coefficients and the p-values were estimated for both ratio plots using Sigma Plot software. For protein versus RNA ratio plot: ρ = 0.349 and p-value < 10−10. For protein versus DNA ratio plot: ρ = 0.145 and p-value < 10−10. (E) Graphical representation of the GO term-enrichment analysis for the category ‘biological process’ for the 452 proteins from cluster 1 (common proteins between clusters 1.1 and 1.2), which includes 201 proteins with a GO annotation (cluster 1, see right panel D and Sheet c in S7 Table). The size of the circle is indicative of the number of genes falling in each category and the color ranging from yellow to orange indicates the p-values associated as indicated in the legend. Only proteins quantified in all four biological replicates for each condition and associated with a p-value < 0.01 were considered for the GO analysis (see Sheet b in S7 Table). (F) Table listing selected genes associated with the GO term ‘post-transcriptional regulation of gene expression’ from the GO enrichment analysis presented in panel E (see Sheet c in S7 Table for details). Their respective fold change values computed from Protein LFQ intensities (grey bars) and DNA normalized read counts (black bars) for LP versus EP log parasites are represented. *proteins exclusive to EP log parasites.
Fig 5
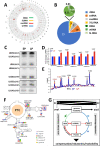
Fig 5. The fitness tradeoff in LP promastigotes correlates with snoRNA expression changes and increased rRNA pseudouridinylation levels.
(A) Genomic map of L. donovani Ld1S ncRNA genes. (B) Composition of the small RNome identified in EP parasites. (C) Northern blot analysis of selected snoRNAs, Ld14Cs1H3 was used as loading control. Two representative northern blots out of four are presented. The analyses were performed with two independent cultures derived from the same frozen stock (see S10 Fig for details). (D) Histogram plot representing the fold changes between LP (red bars) and EP (blue bars) log parasites corresponding to densitometric analysis of the signals shown in (C). Data are presented as mean ± S.E.M. Student’s t-test was performed to determine the p-value. * p-value < 0.05; ** p-value < 0.005. (E) Line graph of the fold change in rRNA pseudouridinylation level (Ψ-fc, log2) in EP (blue line) and LP parasites (red line). The shown result is representative of three independent cultures derived from the same frozen stock (see S10 Fig for details). Positions where the Ψ level is increased in all three replicates are indicated in red. (F) The location of Ψ sites in the rRNA is depicted on the secondary structure. Hypermodified sites are highlighted in red squares. The snoRNAs guiding each Ψ are indicated. The color code for each Ψ site is indicative of the organism where it was already reported. (G) Model of Leishmania evolutionary adaptation. Different environments (E1, E2) select for different fitness traits (F1, F2), which modify the parasite population structure (pop 1, pop 2). In the absence of transcriptional regulation, Leishmania exploits genome instability to generate changes in gene dosage via chromosome and gene copy number variations. These changes are either correlated (blue arrows) or not (green arrow) to changes in transcript and protein abundance. The gene dosage-regulated transcriptome and proteome (right panel) is highly enriched for the GO term ‘post-transcriptional regulation of gene expression’ and thus likely regulates gene dosage-independent changes in RNA abundance (red arrow, left panel). The enrichment of these transcripts in ncRNAs in turn can control RNA stability and translatability by guiding modifications of mRNA or rRNAs. This allows for (i) compensation of deleterious gene dosage effects, (ii) phenotypic robustness despite genetic heterogeneity, and (iii) maintenance of evolvability despite selection pressure.

References

    1. WHO. Leishmaniasis in high-burden countries: an epidemiological update based on data reported in 2014. 2016 Jun 3. Report No.: 0049–8114 (Print) 0049–8114 (Linking) Contract No.: 22. - PubMed
    1. Lindgren E, Andersson Y, Suk JE, Sudre B, Semenza JC. Public health. Monitoring EU emerging infectious disease risk due to climate change. Science. 2012;336(6080):418–9. doi: 10.1126/science.1215735 - DOI - PubMed
    1. Koonin EV, Wolf YI. Evolution of microbes and viruses: a paradigm shift in evolutionary biology? Front Cell Infect Microbiol. 2012;2:119. doi: 10.3389/fcimb.2012.00119 - DOI - PMC - PubMed
    1. Michaeli S. Trans-splicing in trypanosomes: machinery and its impact on the parasite transcriptome. Future Microbiol. 2011;6(4):459–74. doi: 10.2217/fmb.11.20 - DOI - PubMed
    1. Clayton CE. Gene expression in Kinetoplastids. Curr Opin Microbiol. 2016;32:46–51. doi: 10.1016/j.mib.2016.04.018 - DOI - PubMed

Publication types