. 2022 Mar 2;39(3):msac045.
doi: 10.1093/molbev/msac045.

Episodes of Diversification and Isolation in Island Southeast Asian and Near Oceanian Male Lineages

Affiliations

Episodes of Diversification and Isolation in Island Southeast Asian and Near Oceanian Male Lineages

Monika Karmin et al. Mol Biol Evol. .

Abstract

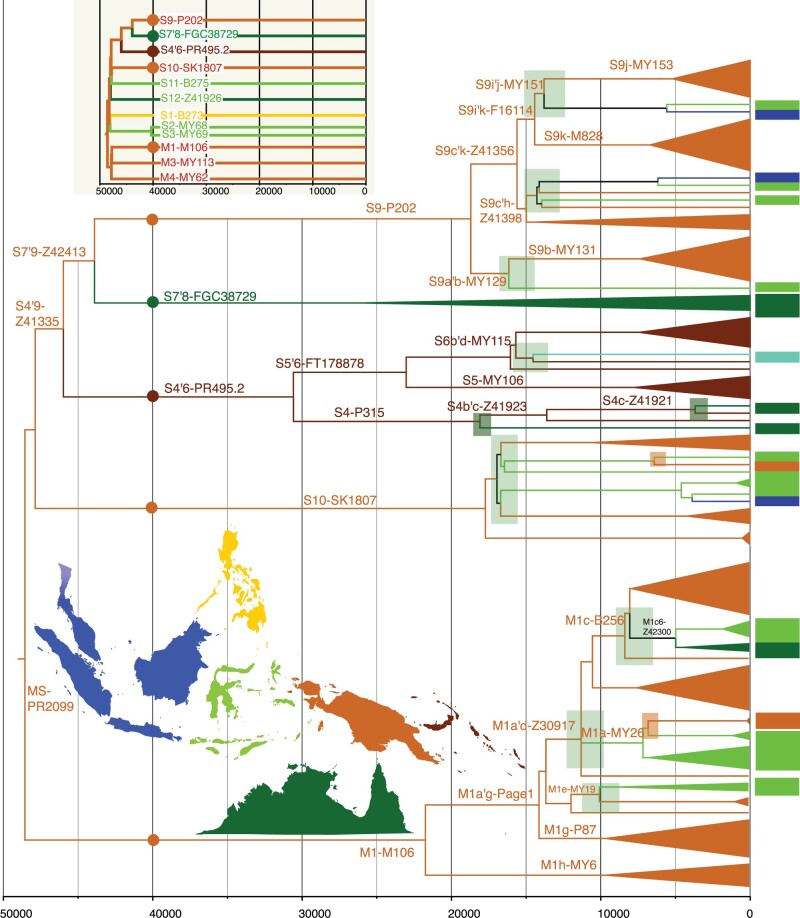
Island Southeast Asia (ISEA) and Oceania host one of the world's richest assemblages of human phenotypic, linguistic, and cultural diversity. Despite this, the region's male genetic lineages are globally among the last to remain unresolved. We compiled ∼9.7 Mb of Y chromosome (chrY) sequence from a diverse sample of over 380 men from this region, including 152 first reported here. The granularity of this data set allows us to fully resolve and date the regional chrY phylogeny. This new high-resolution tree confirms two main population bursts: multiple rapid diversifications following the region's initial settlement ∼50 kya, and extensive expansions <6 kya. Notably, ∼40-25 kya the deep rooting local lineages of C-M130, M-P256, and S-B254 show almost no further branching events in ISEA, New Guinea, and Australia, matching a similar pause in diversification seen in maternal mitochondrial DNA lineages. The main local lineages start diversifying ∼25 kya, at the time of the last glacial maximum. This improved chrY topology highlights localized events with important historical implications, including pre-Holocene contact between Mainland and ISEA, potential interactions between Australia and the Papuan world, and a sustained period of diversification following the flooding of the ancient Sunda and Sahul continents as the insular landscape observed today formed. The high-resolution phylogeny of the chrY presented here thus enables a detailed exploration of past isolation, interaction, and change in one of the world's least understood regions.

Keywords: Island Southeast Asia; Y chromosome; human population genetics; migration; phylogeography.


Figures

Fig. 1.
Fig. 1.
Paternal lineages from ISEA and Near Oceania in the context of the global chrY phylogeny. ML tree of 795 chrY sequences. Colors in the target region correspond to the geographic origin of the samples (numbers shown on the map): dark blue—western Indonesia and the Malay peninsula (Sunda); light green—Eastern Indonesia (Wallacean Islands), yellow—Philippines and Taiwan; brick orange—New Guinea and the Bismarck Archipelago (Northern Sahul); dark green—Australia (Southern Sahul); violet—Mainland Southeast Asia; pink—East Asia; bright blue—Pacific islands; gray—other world regions. The approximate maximum extent of the Sunda and Sahul land masses are shown on the map in light blue. Yellow boxes highlight lineages from the studied region. The root and the deepest splits have been shortened for better fit on the figure.
Fig. 2.
Fig. 2.
Region-specific lineages of C-M130, M-P256, and S-B254 diversified rapidly and early in contrast to later-arriving O-M175. Dated schematic Y chromosomal phylogenies of haplogroups C-M130 (N = 129), F-MY1500 (N = 3), M-P256 (N = 50), NO2-MY1503 (N = 5), O-M175 (N = 230), P-B252 (N = 3), and S-B254 (N = 66). Black—samples from ISEA and Near Oceania; gray—Mainland Asia and Eurasia. Lineages with coalescence dates more recent than ∼25 kya have been collapsed to emphasize the early branching events and the long pause ∼40–30 kya in many of the local lineages within haplogroups M-P256, S-B254, and C-M130, in contrast to the mainland Asian lineages of haplogroups O-M175 and C3-M217. The rare lineages of F-MY1500, P2-B252, and NO2-MY1503 all show early branching events, although their rarity prevents further conclusions about their later diversification history. Triangles are proportional to sample size, and background colors denote time windows as framed in the text. All full or target-captured chrY sequences available to us from ISEA, Oceania, and Australia are included. Haplogroups G-M201, P1-M45, and N-M231 are represented by only a few lineages; the main structures within C3-M217 and some O-M175 subgroups from other well-sampled global regions are represented, but thinned to a smaller number of individuals.
Fig. 3.
Fig. 3.
Contacts between Northern Sahul and neighboring areas within the MS-PR2099 lineages. The basic structure of haplogroup MS-PR2099 lineages is shown in the upper inset; circles denote sublineages that show evidence of contact between Northern Sahul and other regions, and are illustrated in more detail in the main figure. Colors on the tree and map denote the geographic origin of individuals. Light green boxes show likely westward paternal gene flow from Northern Sahul mostly to the Wallacean Islands, but also beyond; darker green boxes denote potential contact between New Britain and Australia. Light brick brown boxes show likely back migration to New Guinea from Wallacea. Light teal represents lineages from Pacific islands. For more details, see supplementary figure S3 and tables S1 and S4, Supplementary Material online.
Fig. 4.
Fig. 4.
Haplogroup O-M175 sublineages in ISEA, New Guinea, and Oceania. A number of distinct sublineages (black) of O-M175 have penetrated from the Asian mainland into ISEA and beyond, and are likely associated with the expansion of Austronesian speakers. Most of these lineages coalesce ∼6–5 kya within subsets of the wider Asian diversity, except for O1b-F819 and O3f-M7 sublineages, which have earlier diversification times (details in supplementary fig. S4 and table S1 and S5, Supplementary Material online). In contrast, lineage NO2-MY1506, found today on Sunda and Sulawesi, split very early from its South Asian sister lineage.

References

    1. Abecasis GR, Altshuler DL, Bentley DR, Chakravarti A, Clark AG, Collins FS, De La Vega FM, Donnelly P, Egholm M, et al.; 1000 Genomes Project Consortium. 2010. A map of human genome variation from population-scale sequencing. Nature 467(7319):1061–1073. - PMC - PubMed
    1. Alam O, Gutaker RM, Wu C-C, Hicks KA, Bocinsky K, Castillo CC, Acabado S, Fuller D, d'Alpoim Guedes JA, Hsing Y-I, et al.2021. Genome analysis traces regional dispersal of rice in Taiwan and Southeast Asia. Mol Biol Evol. 38(11):4832–4846. - PMC - PubMed
    1. Ball MP, Bobe JR, Chou MF, Clegg T, Estep PW, Lunshof JE, Vandewege W, Wait Zaranek A, Church GM. 2014. Harvard Personal Genome Project: lessons from participatory public research. Genome Med. 6(2):10. - PMC - PubMed
    1. Beckett J. 1987. Torres Strait Islanders: custom and colonialism. Cambridge: Cambridge University Press.
    1. Bellwood P. 2004. First farmers: the origins of agricultural societies. New York: Wiley.

Publication types

Substances