. 2022 May;96(5):1387-1409.
doi: 10.1007/s00204-022-03251-z. Epub 2022 Mar 16.

Inter-individual variation in chlorpyrifos toxicokinetics characterized by physiologically based kinetic (PBK) and Monte Carlo simulation comparing human liver microsome and Supersome cytochromes P450 (CYP)-specific kinetic data as model input

Affiliations

Inter-individual variation in chlorpyrifos toxicokinetics characterized by physiologically based kinetic (PBK) and Monte Carlo simulation comparing human liver microsome and Supersome cytochromes P450 (CYP)-specific kinetic data as model input

Shensheng Zhao et al. Arch Toxicol. 2022 May.

Abstract

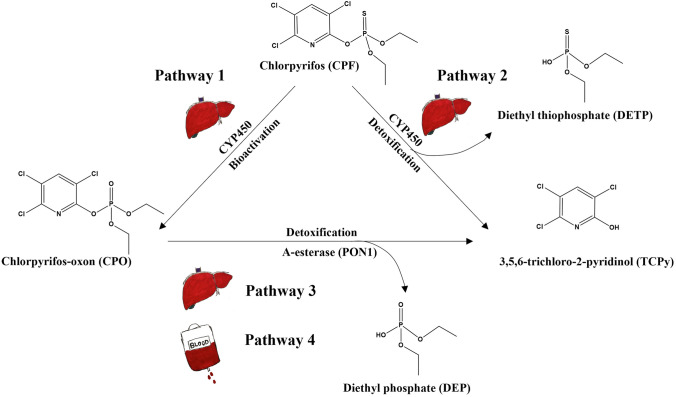
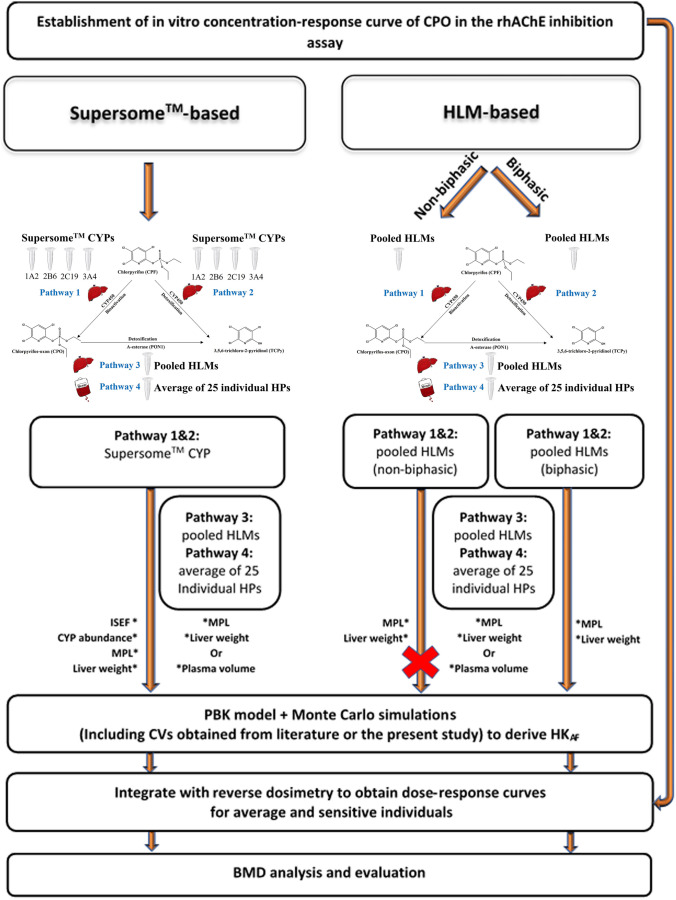
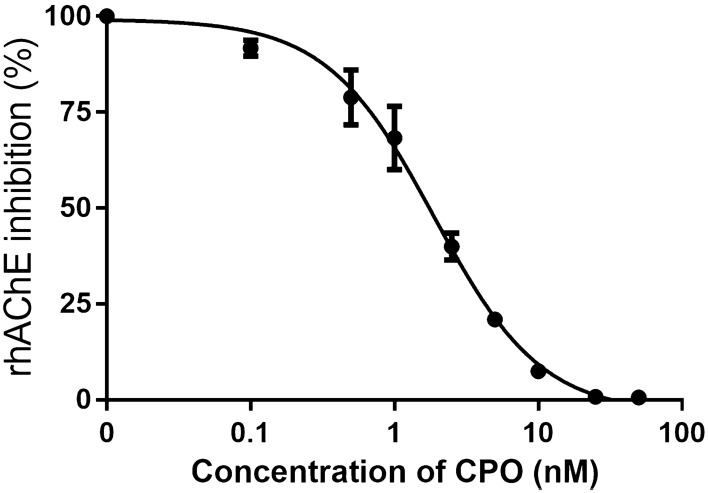
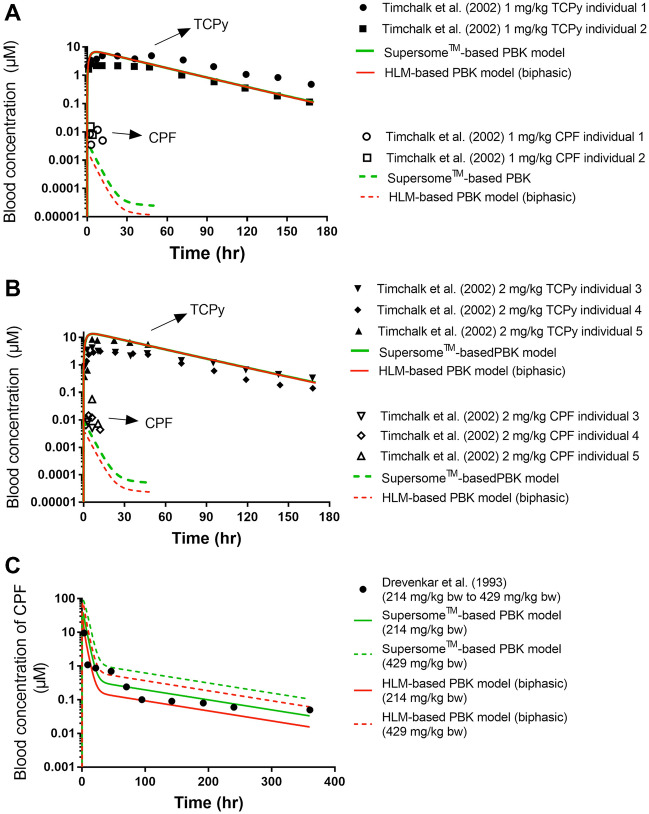
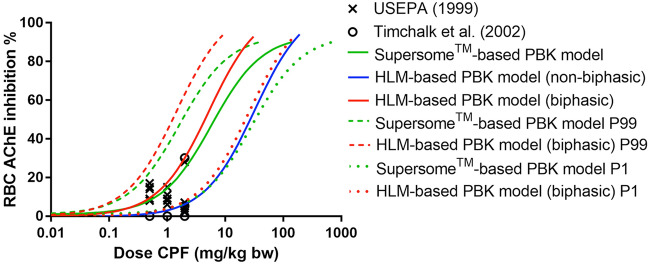
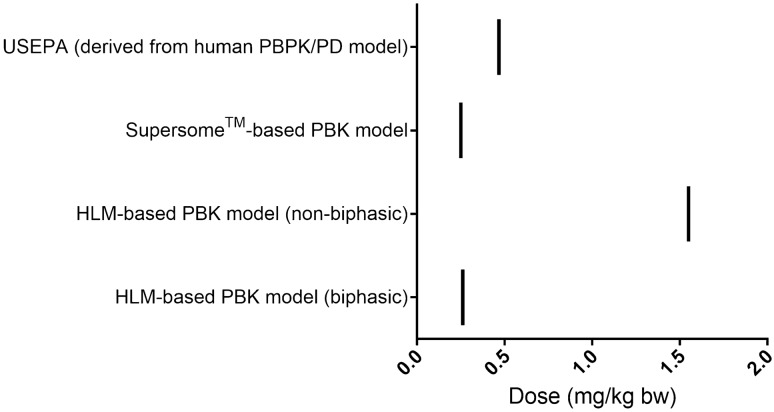
The present study compares two approaches to evaluate the effects of inter-individual differences in the biotransformation of chlorpyrifos (CPF) on the sensitivity towards in vivo red blood cell (RBC) acetylcholinesterase (AChE) inhibition and to calculate a chemical-specific adjustment factor (CSAF) to account for inter-individual differences in kinetics (HKAF). These approaches included use of a Supersome cytochromes P450 (CYP)-based and a human liver microsome (HLM)-based physiologically based kinetic (PBK) model, both combined with Monte Carlo simulations. The results revealed that bioactivation of CPF exhibits biphasic kinetics caused by distinct differences in the Km of CYPs involved, which was elucidated by Supersome CYP rather than by HLM. Use of Supersome CYP-derived kinetic data was influenced by the accuracy of the intersystem extrapolation factors (ISEFs) required to scale CYP isoform activity of Supersome to HLMs. The predicted dose-response curves for average, 99th percentile and 1st percentile sensitive individuals were found to be similar in the two approaches when biphasic kinetics was included in the HLM-based approach, resulting in similar benchmark dose lower confidence limits for 10% inhibition (BMDL10) and HKAF values. The variation in metabolism-related kinetic parameters resulted in HKAF values at the 99th percentile that were slightly higher than the default uncertainty factor of 3.16. While HKAF values up to 6.9 were obtained when including also the variability in other influential PBK model parameters. It is concluded that the Supersome CYP-based approach appeared most adequate for identifying inter-individual variation in biotransformation of CPF and its resulting RBC AChE inhibition.

Keywords: Chlorpyrifos (CPF); Inter-individual differences; Monte Carlo (MC) simulation; Physiologically based kinetic (PBK) modeling; Red blood cell (RBC) acetylcholinesterase (AChE) inhibition.


Conflict of interest statement

The authors declared no potential conflicts of interest with respect to the research, authorship, and/or publication of this article.

Figures

Fig. 1
Fig. 1
Proposed metabolic pathways of chlorpyrifos in human
Fig. 2
Fig. 2
Schematic presentation of the two approaches that were applied in the present study to assess inter-individual variation in the biotransformation of CPF and its resulting HKAF values as well as dose–response curves for CPF-mediated RBC AChE inhibition. CYP is Cytochrome P450, CPF is chlorpyrifos, HLM is human liver microsome, HP is human plasma, CVs is coefficients of variation, HKAF is the chemical-specific adjustment factor (CSAF) for human variability in toxicokinetics of chlorpyrifos, MPL is liver microsomal protein scaling factor, ISEF is the intersystem extrapolation factor for each CYP derived based on differences in activity between Supersomes and HLMs by incubating them with each relevant CYP-specific probe substrate, BMD is benchmark dose, “X” means the approach was terminated
Fig. 3
Fig. 3
Effect of increasing concentration of CPO on recombinant human acetylcholinesterase (rhAChE) activity at 37 ℃. Each value represents the mean ± SD of five independent experiments
Fig. 4
Fig. 4
Concentration-dependent metabolic velocity of each CYP in whole liver for (A) bioactivation of CPF to CPO and (B) detoxification of CPF to TCPy. Since different concentration ranges were used in the different CYP incubations, the velocity of concentrations exceeding the incubation concentration range of each CYP were set equal to its corresponding Vmax value, to facilitate the graphical comparison. The insert presents the data at the lower concentration range (up to 1 µM in A, and 5 µM in B) in some more detail
Fig. 5
Fig. 5
Comparison between reported in vivo data and PBK model predictions for time-dependent blood concentrations of CPF and time-dependent blood concentrations of TCPy at 1 mg/kg bw (A), and 2 mg/kg bw (B) (Timchalk et al. 2002), and 214 mg/kg bw (solid line) to 429 mg/kg bw (dash line) (C) the latter equal to the estimated dose range, for the estimated intake dose of poisoning victim A (Drevenkar et al. 1993)
Fig. 6
Fig. 6
Comparison of the prediction for the CPF dose-dependent total Cmax of CPO by the different approaches
Fig. 7
Fig. 7
The predicted in vivo dose–response curves for AChE inhibition upon CPF exposure in human using the Supersome-based PBK model (green solid line for average population, green dash line for 99th percentile sensitive individuals, and green dot line for 1st percentile sensitive individuals), the HLM-based PBK model (non-biphasic, blue solid line) and the HLM-based PBK model (biphasic, red solid line for average population, red dash line for 99th percentile sensitive individuals, and red dot line for 1st percentile sensitive individuals) for the reverse dosimetry. The individual data points represent available in vivo data for RBC AChE inhibition in human upon oral exposure to CPF at different dose levels as reported by USEPA (1999) and Timchalk et al. (2002) (color figure online)
Fig. 8
Fig. 8
Comparison of predicted BMDL10 values by the present study to reported BMDL10 values established by USEPA (2014)

References

    1. Ali SM, Chia SE. Interethnic variability of plasma paraoxonase (PON1) activity towards organophosphates and PON1 POLYMORPHISMS among Asian populations—a short review. Ind Health. 2008;46:309–317. doi: 10.2486/indhealth.46.309. - DOI - PubMed
    1. Barter ZE, Bayliss MK, Beaune PH, Boobis AR, Carlile DJ, Edwards RJ, Brian Houston J, Lake BG, Lipscomb JC, Pelkonen OR. Scaling factors for the extrapolation of in vivo metabolic drug clearance from in vitro data: reaching a consensus on values of human micro-somal protein and hepatocellularity per gram of liver. Curr Drug Metab. 2007;8:33–45. doi: 10.2174/138920007779315053. - DOI - PubMed
    1. Bizoń A, Milnerowicz H. The effect of divalent metal chelators and cadmium on serum phosphotriesterase, lactonase and arylesterase activities of paraoxonase 1. Environ Toxicol Pharmacol. 2018;58:77–83. doi: 10.1016/j.etap.2017.12.019. - DOI - PubMed
    1. Bouchard M, Carrier G, Brunet RC, Bonvalot Y, Gosselin NH. Determination of biological reference values for chlorpyrifos metabolites in human urine using a toxicokinetic approach. J Occup Environ Hyg. 2005;2:155–168. doi: 10.1080/15459620590922407. - DOI - PubMed
    1. Brown RP, Delp MD, Lindstedt SL, Rhomberg LR, Beliles RP. Physiological parameter values for physiologically based pharmacokinetic models. Toxicol Ind Health. 1997;13:407–484. doi: 10.1177/074823379701300401. - DOI - PubMed

LinkOut - more resources